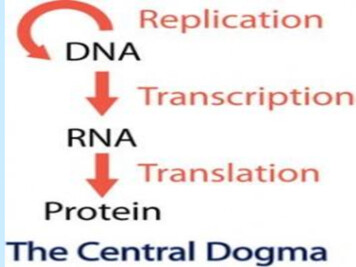
Transcription
University of BirminghamConserved Transcription Factors Steer GrowthRelated Genomic Programs in DaphniaSpanier, Katina I.; Jansen, Mieke; Decaestecker, Ellen ; Huselmans, Gert; Becker, Dorthe;Colbourne, John; Orsini, Luisa; De Meester, Luc; Aerts, SteinDOI:10.1093/gbe/evx127License:Creative Commons: Attribution-NonCommercial (CC BY-NC)Document VersionPublisher's PDF, also known as Version of recordCitation for published version (Harvard):Spanier, KI, Jansen, M, Decaestecker, E, Huselmans, G, Becker, D, Colbourne, J, Orsini, L, De Meester, L &Aerts, S 2017, 'Conserved Transcription Factors Steer Growth-Related Genomic Programs in Daphnia', GenomeBiology and Evolution, vol. 9, no. 6, pp. 1821-1842. https://doi.org/10.1093/gbe/evx127Link to publication on Research at Birmingham portalPublisher Rights Statement:This article has been accepted for publication in Genome Biology and Evolution : The Author 2017. Published by Oxford University Press.All rights reserved.General rightsUnless a licence is specified above, all rights (including copyright and moral rights) in this document are retained by the authors and/or thecopyright holders. The express permission of the copyright holder must be obtained for any use of this material other than for purposespermitted by law. Users may freely distribute the URL that is used to identify this publication. Users may download and/or print one copy of the publication from the University of Birmingham research portal for the purpose of privatestudy or non-commercial research. User may use extracts from the document in line with the concept of ‘fair dealing’ under the Copyright, Designs and Patents Act 1988 (?) Users may not further distribute the material nor use it for the purposes of commercial gain.Where a licence is displayed above, please note the terms and conditions of the licence govern your use of this document.When citing, please reference the published version.Take down policyWhile the University of Birmingham exercises care and attention in making items available there are rare occasions when an item has beenuploaded in error or has been deemed to be commercially or otherwise sensitive.If you believe that this is the case for this document, please contact UBIRA@lists.bham.ac.uk providing details and we will remove access tothe work immediately and investigate.Download date: 08. Jul. 2022
GBEConserved Transcription Factors Steer Growth-RelatedGenomic Programs in DaphniaKatina I. Spanier1,2,3, Mieke Jansen1, Ellen Decaestecker4, Gert Hulselmans2,3, Dörthe Becker5,6,John K. Colbourne5, Luisa Orsini5, Luc De Meester1,*, and Stein Aerts2,3,*1Department of Biology, Laboratory of Aquatic Ecology, Evolution and Conservation, KU Leuven, Belgium2Department of Human Genetics, Laboratory of Computational Biology, KU Leuven, Belgium3VIB Center for Brain and Disease Research, KU Leuven, Belgium4Department of Biology, Laboratory of Aquatic Biology, Science and Technology, KU Leuven Campus Kulak, Kortrjik, Belgium5Environmental Genomics Group, School of Biosciences, College of Life and Environmental Sciences, University of Birmingham, United Kingdom6Department of Animal and Plant Sciences, University of Sheffield, Western Bank, United Kingdom*Corresponding authors: E-mails: luc.demeester@kuleuven.be; stein.aerts@kuleuven.vib.be.Accepted: July 11, 2017AbstractEcological genomics aims to understand the functional association between environmental gradients and the genes underlyingadaptive traits. Many genes that are identified by genome-wide screening in ecologically relevant species lack functional annotations.Although gene functions can be inferred from sequence homology, such approaches have limited power. Here, we introduceecological regulatory genomics by presenting an ontology-free gene prioritization method. Specifically, our method combinestranscriptome profiling with high-throughput cis-regulatory sequence analysis in the water fleas Daphnia pulex and Daphnia magna.It screens coexpressed genes for overrepresented DNA motifs that serve as transcription factor binding sites, thereby providing insightinto conserved transcription factors and gene regulatory networks shaping the expression profile. We first validated our method,called Daphnia-cisTarget, on a D. pulex heat shock data set, which revealed a network driven by the heat shock factor. Next, weperformed RNA-Seq in D. magna exposed to the cyanobacterium Microcystis aeruginosa. Daphnia-cisTarget identified coregulatedgene networks that associate with the moulting cycle and potentially regulate life history changes in growth rate and age at maturity.These networks are predicted to be regulated by evolutionary conserved transcription factors such as the homologues of DrosophilaShavenbaby and Grainyhead, nuclear receptors, and a GATA family member. In conclusion, our approach allows prioritising candidate genes in Daphnia without bias towards prior knowledge about functional gene annotation and represents an important steptowards exploring the molecular mechanisms of ecological responses in organisms with poorly annotated genomes.Key words: cis-regulation, omics data integration, prioritization, crustacea endocrine signaling, functional enrichment,motif discovery.IntroductionUnderstanding how organisms respond and adapt to theirnatural environments is a key objective of biology (Federand Mitchell-Olds 2003). Evolutionary and ecological functional genomics is a discipline of biology that arose from theapplication of modern sequencing technologies to uncovergenetic variation under natural selection (Feder andMitchell-Olds 2003; Andrew et al. 2013; Pardo-Diaz et al.2015). In its search for genes and other elements of the genome that underpin adaptive traits, an expanding suite oforganisms is emerging as ecological model species, whichare accessible to both laboratory and field studies along defined environmental gradients. Discoveries made from ecological genomics include adaptive variation arising fromboth de novo (Karasov et al. 2010) and standing genetic variation (Colosimo et al. 2005); phenotypes that evolve by selection on multiple small effect loci (Burke et al. 2010) or on afew loci of major effect (Lamichhaney et al. 2016); and newphenotypes resulting from major effect mutations that alterprotein coding sequences (Protas et al. 2006) or gene regulation (Manceau et al. 2011). Moreover, tools and approachesthat were once reserved to traditional biomedical modelß The Author 2017. Published by Oxford University Press on behalf of the Society for Molecular Biology and Evolution.This is an Open Access article distributed under the terms of the Creative Commons Attribution Non-Commercial License (http://creativecommons.org/licenses/by-nc/4.0/), which permitsnon-commercial re-use, distribution, and reproduction in any medium, provided the original work is properly cited. For commercial re-use, please contact journals.permissions@oup.comGenome Biol. Evol. 9(6):1821–1842. doi:10.1093/gbe/evx127 Advance Access publication July 14, 20171821
GBESpanier et al.species, such as genome-wide forward or reverse genetics,are increasingly being applied to ecological model species(Ekblom and Galindo 2010; Stapley et al. 2010; Alvarezet al. 2015; Pardo-Diaz et al. 2015).Genome-wide gene expression profiling is a particularlypowerful method to identify regulated genes under differentecological conditions and linked to phenotypic change (Purdyet al. 2010). The set of all genes that are expressed in a givencondition and in a particular cell or tissue type (the transcriptome) is itself a “molecular phenotype” (Hughes et al. 2000).This molecular phenotype is under the control of transcriptionregulation that genetically varies, based on the ecological andevolutionary history of populations (Dalziel et al. 2009).Hence, the transcriptional responses of natural isolates to environmental perturbation are a rich source of both phenotypicand genotypic information about the mechanisms of adaptation (Todd et al. 2016). The use of next generation sequencingfor data-driven genome-wide investigations of transcriptomes(RNA-Seq, Wang et al. 2009) is increasingly used in studies onecological model species (Todd et al. 2016), because thismethod is comprehensive and does not assume prior knowledge of the functional elements of the genome, nor of thegene annotations. However, the biological interpretation ofRNA-Seq data obtained from ecological model speciesremains challenging, because these investigations often provide the first evidence of the biological functions of geneswithin an ecological context (Colbourne et al. 2011; Alvarezet al. 2015). The challenge is particularly acute for lineagespecific genes having no identified sequence homology to thefunctionally annotated genes of related model species(Colbourne et al. 2011). Otherwise, the genes that haveknown homologues are often analyzed using GeneOntology or pathway enrichment tools to test for the statistical significance of their enrichment within a coexpressedgene set (Primmer et al. 2013; Kanehisa et al. 2012).Although this homology-based approach makes use of thevast knowledge obtained from traditional model species, itmakes many assumptions on the reliability of ascribing functional orthology to gene family members across large evolutionary distances (Primmer et al. 2013; Pavey et al. 2012).Another powerful method at identifying ecologically important elements of genomes is the analysis of cis-regulatorysequences, also referred to as motif discovery (reviewed by ez-Cuna et al. 2013; AertsHardison and Taylor 2012; Y an2012). Motif discovery finds enriched motifs in the promotersor upstream sequences of coexpressed genes, which mayrepresent shared binding sites for a particular transcriptionfactor (TF). If such a TF is known, direct TF-target interactionscan be inferred leading to the prediction of gene regulatorynetworks (GRN). This concept is proven for genetic modelspecies and human, by producing experimentally validatedpredictions (Van Loo et al. 2008; Warner et al. 2008; Aertset al. 2010). For ecological model species, however, little isknown about gene regulation and its mechanisms. On one1822hand, rapid turnover of regulatory sequences (Schmidt et al.2010; Weirauch and Hughes 2010; Sayou et al. 2014; Bakeret al. 2011) and complete rewiring of GRNs (Tsong et al.2006) across evolutionary time scales have been documented.On the other hand, evidence shows that TFs, their bindingspecificities and even complete GRNs can be highly conservedbetween distantly related species (Del Bene et al. 2007; Nittaet al. 2015; Weirauch et al. 2014; Villar et al. 2015; Guertinet al. 2010; Green et al. 2015). Therefore, it remains unknownif and to what extend knowledge about the regulatory code(e.g., TF binding specificities) obtained from genetic modelspecies can be transferred to ecological model species.Here, we propose a motif discovery method for ecologicalmodel species, namely for the water fleas Daphnia pulex andDaphnia magna. Water fleas (Crustacea: Cladocera) are keystone species in lake and pond ecosystems and are intensivelyused as model organisms in ecology, evolutionary biology,and ecotoxicology (Lampert and Kinne 2011; Miner et al.2012). They are well-studied for their phenotypic responsesto various environmental conditions (see e.g., Miner et al.[2012] and a draft genome sequence is available for bothD. pulex and D. magna (Colbourne et al. 2011; Wfleabase).However, the GRNs underlying ecological responses inDaphnia are unknown.To discover GRNs in D. magna and D. pulex, we developedthe method Daphnia-cisTarget that identifies overrepresentedcis-regulatory motifs and candidate regulators in a set of coexpressed genes. The approach and algorithm are based oncisTargetX. cisTargetX and its follow-up methods i-cisTargetand evo-cisTarget are successfully applied for motif discoveryin fruit fly, human, and mouse (Aerts et al. 2010; Herrmannet al. 2012; Janky et al. 2014; Imrichov a et al. 2015; NavalSanchez 2014). We use Daphnia-cisTarget to computationallypredict transcription factors and gene regulatory networks inDaphnia, using RNA-Seq data and TF binding specificitiesfrom other species. We validate our method by linking theinferred factors and networks to morphological and life history traits.Materials and MethodsDaphnia-cisTargetDaphnia-cisTarget is based on the Drosophila melanogasterspecific method cisTargetX (Aerts et al. 2010). To adapt thismethod to Daphnia, we used an established protocol anddefault thresholds that are empirically determined. Our approach includes two major steps: 1) Definition of a motifsearch space and subsequent genome-wide motif cluster prediction, and 2) motif enrichment analysis on a set of coexpressed genes and target gene prediction. Daphnia-cisTargetis available through a web interface at http://daphniacistarget.aertslab.org/ (last accessed July 17, 2017). To delineate candidate cis-regulatory regions, we used the genomesequences of D. magna and D. pulex together with theirGenome Biol. Evol. 9(6):1821–1842 doi:10.1093/gbe/evx127 Advance Access publication July 14, 2017
GBEDaphnia Gene Regulatory Networksgene catalogues. First, we assigned potential regulatoryregions to each gene. Those regions include all exons andintrons, 30 - and 50 -UTRs, and a region upstream of the transcription start site. The upstream region comprises either300 bp or 5 kb. If another gene at the same strand falls withinthis region, the region is terminated at the margin of thatupstream gene. Next, we scored the potential cis-regulatory sequences generated in the previous step for homotypicmotif clusters with the program Cluster-Buster (Frith et al.2003). Cluster-Buster uses a Hidden Markov Model andallows regions with clusters of multiple motif matches to receive higher scores than regions with single motif instances.The Cluster-Buster cluster score threshold was set to zero toreceive a score for every region, resulting in several scores foreach gene. Only the highest score was retained and assignedto the gene. The above procedure results in one score for eachgene for a given motif. This score was used to rank all genes.We repeated this scoring and ranking step for each motif in alibrary of 9713 transcription factor motifs collected from various species (Janky et al. 2014) and compiled the resulting9713 rankings into a database. The search space delineationand motif scoring steps outlined above were done separatelyfor each of the two Daphnia species (pulex and magna) andthe two search space delineations (300 bp and 5 kb), resultingin four databases in total. In the motif enrichment step, thedatabase is queried with a set of coexpressed genes to determine which motifs are enriched in this set as compared withthe whole-genome background. For each of the 9713 motifrankings within a queried database, Daphnia-cisTarget calculates a cumulative recovery curve of the input gene set alongthe ranking (blue curve fig. 1C). It also calculates the areaunder the recovery curve (AUC) as a measure of enrichment.Because we are mainly interested in highly ranked genes, theAUC is calculated for a fraction of the top ranked genes only.This fraction is delimited by the AUC threshold, which defaultsto 3% of the total number of ranked genes (927 for D. pulexand 990 for D. magna). Lowering the threshold increasesspecificity by favoring motifs with steeper enrichment curves,i.e., where the input gene set is highly enriched at the top ofthe ranking of all genes. A threshold of 3% has proven sensible for cisTargetX (Potier et al. 2012). We have shown thatmotif and TF recovery are robust across a wide range of AUCthresholds in a version of cisTargetX for human (Janky et al.2014). Note that the user can adjust the AUC threshold inDaphnia-cisTarget and compare the impact of different settings. To normalize the AUC, Daphnia-cisTarget calculatesfirst an average recovery curve by taking the mean of allAUC scores across all motifs in the database (red curve fig.1C), and second the normalized enrichment score asNES ¼ (AUC-AUCmean)/AUCstd, where AUCstd is the standard deviation of the mean AUC. Only motifs with a NESabove a specified threshold (default 2.5) are consideredenriched. To simplify the output, the enriched motifs aregrouped into clusters of similar motifs using STAMP(Mahony and Benos 2007). Motifs assigned to the same cluster are given the same color in the results table. To retrieve anoptimal subset of the input gene set as putative target genes,a “leading edge” is determined as the rank position (belowthe AUC threshold) where the difference between the signal(recovery curve: blue curve fig. 1C) and the background(mean recovery curve across all motifs plus two standard deviations: green curve) is largest. The input genes within thisleading edge are predicted as target genes for the given motif.To enable the identification of TFs that putatively bind to theenriched motifs and regulate the predicted target genes, candidate transcription factors are mapped to the motifs.Specifically, these candidate TFs comprise Daphnia genesthat are homologous to D. melanogaster genes that havebeen mapped to the same motifs in the motif2TF databasedeveloped by Janky et al. (2014).Heat Shock Data SetThe D. pulex heat shock signature used for the validation ofDaphnia-cisTarget was retrieved from an experiment by Beckeret al. (unpublished data; GSE91031). Briefly, 20 C-acclimatedanimals (adult females with a body length of 2–2.5 mm, carrying parthenogenetic eggs and embryos), were exposed for 2,4, or 8 h to either 30 6 0.2 C (test condition) or 20 6 0.3 C(control condition). After exposure, animals were shock-frozenin liquid nitrogen and short-term stored at 80 C. For eachexperimental condition, four independent replicates (50 animals each) were analyzed. Whole-body RNA-levels were measured using a 12-plex 60 nt-oligonucleotide microarrayplatform, which is described elsewhere (Colbourne et al.2011). For each treatment, four independent RNA sampleswere processed and the labeled cDNA were competitively hybridized (test vs. control condition) on four replicate microarrays including dye swaps. To obtain differential geneexpression profiles, data were analyzed as described elsewhere(Colbourne et al. 2011). We selected upregulated genes withan FDR 0.05 as input for Daphnia-cisTarget.Reanalysis of the Chronic Cyanobacteria Data SetTo recover GRNs that are affected by chronic cyanobacteriaexposure, we reanalyzed the RNA-Seq data produced bySchwarzenberger et al. (2014) (SRA177938). Briefly, theauthors exposed D. magna to two different cyanobacteriastrains, one expressing Microcystin-LR (“toxic;” here named“BX”), and a microcystin-free strain (“less-toxic;” here named“BN”). We mapped the reads with TopHat v2.0.12 (Trapnellet al. 2009) (option –max-multhits 1) against the D. magnareference genome (v2.4) and used HTSeq v0.6.1p1 (Anderset al. 2014) (–stranded ¼ no) for read counting. We calculateddifferential gene expression with the Bioconductor(Gentleman et al. 2004) R-package DESeq2 v1.6.1 (Loveet al. 2014) and applied a cut-off of jlog2F Cj 2 andFDR 0.05 to obtain the lists of differentially expressed genes.Genome Biol. Evol. 9(6):1821–1842 doi:10.1093/gbe/evx127 Advance Access publication July 14, 20171823
GBESpanier et al.FIG. 1.—Daphnia-cisTarget. (A) Transcription factors (TFs) bind to specific motifs in cis-regulatory regions to control gene expression. (B) This in vivoprocess can be inferred in silico by combining motif discovery and gene expression data, since genes that are coexpressed and share the same motif are likelyto be regulated by the same transcription factor. (C) For a given input gene set, Daphnia-cisTarget generates a cumulative recovery curve for each motifranking in the database (blue line left panel). The area under this curve (AUC) is calculated as a measure of enrichment (grey area), and those motifs thatsurpass the AUC cut-off (dotted line right panel) are listed in the output. The red line in the left panel represents the average recovery over the entire motifranking database. This average plus two standard deviations yields the green line.We ran Daphnia-cisTarget on the four sets of differentiallyexpressed genes (i.e., up-/downregulated genes of BN & BXtreatment), and selected all predicted target genes of the topscoring motif clusters (containing NR, ovo/Svb and GATAmotifs). To reduce the number of false positives, we usedonly the motif-gene mappings of the 300 bp version to construct Cytoscape (Shannon et al. 2003) networks.Acute Exposure of D. magna to CyanobacteriaTo compare the responses to chronic and acute cyanobacteriaexposure in D. magna, we designed a follow-up experiment.Experimental conditions and RNA-Seq data generation aredescribed by Orsini et al. (2016) (SRA272145). Briefly, we exposed 5-days-old juvenile females for 4 h to a unicellular,Microcystin-LR producing strain of M. aeruginosa (strain T4,characterized by van Gremberghe et al. (2009)), and the mutant strain CCAP 1450/1, which lacks the gene to produce thetoxic cyanobacterial Microcystin-LR. We used the two D.magna Straus, 1820 genotypes described by Routtu et al.1824(2014), originating from different habitats (Iinb1: Munich,Germany; Xinb3: Tv arminnen, Finland). Replicates wereobtained from three maternal lines (“cohorts”) cultured separately for two generations. For full-body RNA extraction, library preparation and Illumina RNA-Seq sequencing detailswe refer to Orsini et al. (2016). We processed the reads similarly to the chronic data set. To assess the treatment-specificand cohort effects, respectively, we performed two differentdifferential expression analyses. First, for each clone and cohort, we contrasted the control and each of the two treatment samples separately, resulting in 12 comparisons.Expressed genes that had a mean of 10 reads per exonbase position across two samples were excluded from theanalysis. This filtering step resulted in about 11,300–14,000genes having sufficient coverage. We calculated the log2-foldchange (log2FC) between each treatment and its control using the Bioconductor (Gentleman et al. 2004) R packageDESeq v1.18.0 (Anders and Huber 2010) and ranked thegenes according to this value. For subsequent analysis withDaphnia-cisTarget, we used 24 gene sets containing the 1000Genome Biol. Evol. 9(6):1821–1842 doi:10.1093/gbe/evx127 Advance Access publication July 14, 2017
GBEDaphnia Gene Regulatory Networksmost differentially expressed genes (i.e., the 500 most up- anddownregulated genes of each comparison, respectively), corresponding to 7–8.8% of the whole ranking. The resulting 24gene sets were objected to a Daphnia-cisTarget analysis.Predicted target genes for each cluster of GATA, NR, ovo/Svb, Blimp-1, and Grh motifs were pooled, and genes thatcontained a motif in at least three Daphnia-cisTarget runs(300 bp version) were displayed as a network withCytoscape (Shannon et al. 2003). Second, we consideredthe three samples (control and two cyanobacteria treatments)of each cohort as replicates and contrasted the cohorts, whichresulted in six comparisons (2 clones 3 cohorts). We filteredfor read coverage of 10 reads per exon base position acrossthe six samples that were to be compared (11,700–13,800genes retained), and calculated differential expression withDESeq2 v1.6.3 (Love et al. 2014). It is important to notethat the three cohorts of the I-clone (1–3) are independentfrom the three X-clone cohorts (10 –30 ), as the experimentswere carried out on different days. Sample details includingSRA accession numbers are available as supplementary tableS1, Supplementary Material online.Expression Data and Gene Network VisualizationThe heat maps in figures 3A and 4B and D and supplementaryfigures S2C and S3A, Supplementary Material online weregenerated with the MultiExperiment Viewer of the TM4 software suite (Saeed et al. 2003). We normalized the read countmatrix obtained by HTSeq by removing all genes having anexpression across all samples in the lowest 40% quantile. Thequantile filtered data were imported into the MultiExperimentViewer, where they were library size corrected, log2transformed, and median-centered per row (i.e., gene). Theread mapping in supplementary figure S3C, SupplementaryMaterial online was displayed with the integrative genomicsviewer IGV v2.3.70 (Robinson et al. 2011). Gene regulatorynetworks were generated with the software Cytoscape v3.3.0(Shannon et al. 2003).Functional Annotation and Gene Homology betweenSpeciesProtein homologies between Daphnia species were determined by blasting all D. pulex predicted proteins against theD. magna protein catalogue using the NCBI program blastpv2.2.25þ (Altschul et al. 1997). Only the best hit in terms of Escore and total bit score was retained. The gene models of D.magna were functionally annotated by blasting the translatedgenes against the D. melanogaster protein catalogue v6.02(blastp, E value cut-off 1 10 20, best hit only). D. melanogaster orthologues for the D. pulex gene catalogue wereretrieved from Ensembl BioMart (Kinsella et al. 2011). Thisresulted in 8268 D. magna and 8524 D. pulex genes mappingto 5824 and 7270 D. melanogaster genes, respectively. Asgene name, we kept the gene symbol of the closestD. melanogaster homologue. If a closer inspection of thegene revealed a different function or if the gene model hadto be modified, the genes were given names preceded by“Dam” for D. magna. We italicize gene names (DamSvb)and use roman type for gene products (DamSvb) and motifnames (ovo/Svb).Sequence Alignment and Phylogenetic TreeWe determined homology between protein sequencesthrough sequence alignment with the online programClustal Omega v1.2.1 (Sievers et al. 2011). For the transcription factors discussed in this paper, we retrieved the D. melanogaster DNA-binding domain sequences from the CIS-BPdatabase v1.02 (Weirauch et al. 2014), aligned them to the D.magna predicted protein sequence with Clustal Omega, andcalculated amino acid identities.Gene Ontology (GO)GO-term enrichment analysis was carried out using theCytoscape plug-in BiNGOv3.0.3 (Maere et al. 2005).Blasting D. magna against D. melanogaster protein sequencesfrequently yielded several water flea genes that map to thesame fruit fly gene and thus share the same annotation.Therefore, we created a custom background for this analysis.To this end, we assigned the GO-terms attributed to D. melanogaster genes to the respective homologous D. magnagenes (8268 D. magna genes had sufficient homology) andused those as background set (option “select organism/annotation”). Gene ontologies for D. melanogaster wereobtained from the Gene Ontology Consortium (Blake et al.2015). BiNGO was used with the settings “ontology file”:go.obo; “statistical test”: hypergeometric; “multiple testingcorrection”: Benjamini and Hochberg; False Discovery Rate(FDR) correction with a significance level of 0.05. Otherwise,default settings were used.Gene Set Enrichment Analysis (GSEA)To determine whether the differentially expressed genes fromthe chronic cyanobacteria experiment are also affected by theacute cyanobacteria treatment, we used the software GSEAv2.1.0 (Subramanian et al. 2005) with the default commandline options, except for “xtools.gsea.GseaPreranked”,“scoring scheme classic” and “nperm 10,000”. We considered enrichments with FWER 0.01 and jNESj 2 significant.Enrichments were visualized in supplementary figure S5B,Supplementary Material online as density trace with the Rpackage beanplot v1.2 (Kampstra 2008).Overrepresentation AnalysisTo test whether D. magna homologues of known D. melanogaster GATAe and Svb targets were enriched amongthe differentially expressed genes from the chronicGenome Biol. Evol. 9(6):1821–1842 doi:10.1093/gbe/evx127 Advance Access publication July 14, 20171825
GBESpanier et al.cyanobacteria data, we calculated the probability of overlapwith the hypergeometric distribution function phyper in R. Asbackground we used the number of genes that have D. melanogaster homology (i.e., 8268).Explained VariationTo visualize the variation that can be explained by the GRNspredicted with Daphnia-cisTarget, we generated cumulativerecovery curves. To this end, we sorted the STAMP-predictedmotif clusters by the NES score of their highest-ranking members, and generated a cumulative recovery curve by countingthe number of unique predicted target genes (supplementarytable S5, Supplementary Material online). We also calculatedthe percentage of input gene sets recovered by 1) the highestscoring motif cluster, 2) by motif clusters containing GATA,NR, ovo/Svb, Grh, and Blimp-1 motifs, and 3) by all motifclusters recovered with Daphnia-cisTarget, representing themaximal variation that can be explained with motif discovery.Data AvailabilityThe genomic resources and databases used in this study arelisted in supplementary table S4, Supplementary Materialonline.ResultsDesign and Implementation of Daphnia-cisTargetThe motif discovery method Daphnia-cisTarget is comprisedof two steps: a computationally intensive motif scoring andranking step, and a fast motif recovery step (see Materials andMethods). For the motif scoring step, we first define thesearch space for potential cis-regulatory sequences. We testedour method by delineating two different intervals: a smallsearch space of 300 bp, and a larger search space of 5 kbsequence upstream of the TSS. The average intergenic spaceis 1,800 bp in D. magna, with 44% and 88% of the geneshaving an upstream sequence smaller than 300 bp and 5 kb,respectively. For D. pulex, those values are 3,200 bp, 21% and83%. The defined sequence search spaces capture thus alarge proportion of the intergenic space. Next, we scoredthose sequences for the occurrence of specific DNA sequencemotifs. To this end, we used motifs derived from differentspecies including yeast, fruit
within an ecological context ( Colbourne et al. 2011; Alvarez et al. 2015). The challenge is particularly acute for lineage-specific genes having no identified sequence homology to the functionally annotated genes of related model species (Colbourne et al. 2011). Otherwise, the genes that have known homologues are often analyzed using Gene