Transcription
QRishing: The Susceptibility of Smartphone Users toQR Code Phishing AttacksTimothy Vidas, Emmanuel Owusu, Shuai Wang, Cheng Zeng, Lorrie CranorNovember 5, 2012CMU-CyLab-12-022CyLabCarnegie Mellon UniversityPittsburgh, PA 15213
QRishing: The Susceptibility of Smartphone Users to QR Code Phishing AttacksTimothy Vidas, Emmanuel Owusu, Shuai Wang, Cheng Zeng, Lorrie CranorCarnegie Mellon UniversityPittsburgh, PA, USA{tvidas, eowusu, shuaiwang, chengzeng, lorrie}@cmu.eduAbstract—The matrix barcodes known as Quick Response(QR) codes are rapidly becoming pervasive in urban environments around the world. QR codes are used to represent data,such as a web address, in a compact form that can be readilyscanned and parsed by consumer mobile devices. They arepopular with marketers because of their ease in deploymentand use. However, this technology encourages mobile users toscan unauthenticated data from posters, billboards, stickers,and more, providing a new attack vector for miscreants. Bypositioning QR codes under false pretenses, attackers can enticeusers to scan the codes and subsequently visit malicious websites, install programs, or any other action the mobile devicesupports. We investigated the viability of QR-code-initiatedphishing attacks, or QRishing, by conducting two experiments.In one experiment we visually monitored user interactions withQR codes; primarily to observe the proportion of users whoscan a QR code but elect not to visit the associated website.In a second experiment, we distributed posters containing QRcodes across 139 different locations to observe the broaderapplication of QR codes for phishing. Over our four-weekstudy, our disingenuous flyers were scanned by 225 individualswho subsequently visited the associated websites. Our surveyresults suggest that curiosity is the largest motivating factorfor scanning QR codes. In our small surveillance experiment,we observed that 85% of those who scanned a QR codesubsequently visited the associated URL.Figure 1. An example of a QR code used in this study. The encodedcontent is http://2dpromo.net/g2tr1.a marketplace application such as Google Play or AppleApp Store. The content represented by a QR code is often ahyperlink, and the associated action is to launch the device’sweb browser and visit the website specified by the code.QR codes can be found on store-front windows, magazines, newspapers, websites, posters, mass mailings, andbillboards. Businesses display QR codes on advertisementsto direct people to their websites. One study found over 14million U.S. mobile users scanning QR codes during June2011 [30].The ease with which one can create and distribute QRcodes has not only attracted businesses, but also scammersseeking to direct people to phishing websites. Phishing isa semantic attack that cons individuals, under the guiseof a legitimate organization or individual, into visiting amalicious website or providing sensitive information [24].With the increased usage of QR codes, QR code phishing,or QRishing (phonetically: “krihsh-ing”), presents a threat tothis new, convenient technology. Concerns for the safety ofQR codes are increasing [13], [27], [30], [32]. An attackermight place a sticker of a QR code containing maliciouscontent over a legitimate QR code or create an entirely newQR code advertisement masquerading as a legitimate entity.Some QR code reader applications may perform actionswithout first presenting the human-readable QR code contentI. I NTRODUCTIONA Quick Response code (QR code) is a two-dimensionalmatrix of black and white pixels [23] that can be usedto store information in a compact and optically-scannableform. QR codes have gained popularity due to their higherinformation density and improved readability compared toone-dimensional barcodes. An example QR code can beseen in Figure 1. As the number of smartphone users growsrapidly [10], businesses are turning to QR codes en masseto provide a fun and simple way to direct smartphone usersto their websites and products. QR codes are designed tobe readable regardless of orientation and in cases where acode is partially damaged or masked [2]. These propertiesfacilitate the use of QR codes in consumer applications toconvey information to users.QR codes are typically “scanned” by photographing theQR code using a mobile device, such as a smartphone. Theimage is then interpreted by a QR code reader that users mayinstall as an application on their mobile device. The readerdecodes the message and performs an operation based on themessage. For example, if the encoded data contains a linkto a mobile application download, the reader may launch1
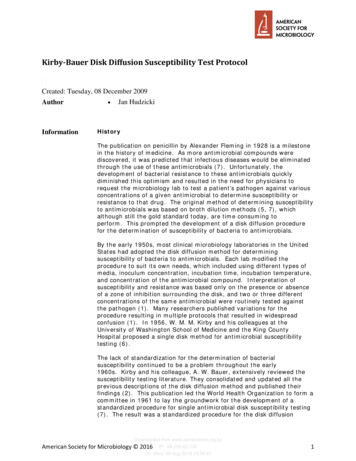
RankApplicationVendor12Barcode ScannerShopSavvy (Barcode and QRScanner)RedLaser Barcode and QRScannerScanLife Barcode and QRReaderAT&T Code Scannerpic2shop - Barcode ScannerBakodo - Barcode ScannerNeoReader - QR vvy, Inc.AutoVisitnoyes12ZXingShopSavvy, Inc.eBay, Inc.no3SimpleAct, Inc.noScanbuy, Inc.yes4eBay MobilenoAT&T IncVision SmartsDedoware, IncNeoMedia Technologies, Inc3GVisionMobile Tagnononoyes5Barcode ScannerShopSavvy Barcode ScannerQuickMark Barcode ScannerRedLaser Barcode and QRReaderScanLife Barcode and QRReaderBarcode scanneri-nigma Barcode ScannerAT&T Code ScannerAutoVisitnoyesScanbuy, Inc.yesi-nigma QR Code scannerMOBILETAG - BarcodeScanner(a) iOS Applications678yesyes910george android3G VisionAT&T Service,Inc.ixMAT Barcode Scannerixellence.comBARCODE SCANNERJet Ho(b) Android ApplicationsnoyesnononoTable 1. Five of the top ten free iOS applications and three of the top ten free Android applications automatically visit URLs scanned from QR codes.When applications employ this feature, the user has no opportunity to visually inspect the URL prior to visiting that URL.Thirty percent of these top ten free scanning applications inthe Google Play Market and 50% in the Apple App Storeimmediately visit a scanned URL in the default configuration.The purpose of this study is to measure the threat QRcodes pose as a phishing attack vector and to identify ways toimprove the safety of QR code interaction. We are interestedin the behaviors of smartphone users when they see QRcodes posted in public places, including whether or not theylook for context around the QR code, scan the QR code, andvisit the website from the QR code.The user study consisted of two experiments. (1) AQRishing experiment and (2) a baseline surveillance studyof user interaction with QR codes, which we describe inSection II and Section III, respectively. Security implicationsof the study are presented in Section IV. We provide relatedwork in Section V, and conclusions in Section VI.Figure 2.Screen capture of the most popular “barcode scanner” onAndroid: ZXing. With default settings, the URL is prominently shown tothe user after scanning.to the user. For example, an application may automaticallyopen a hyperlink in the device’s web browser withoutpermitting the user to first verify the hyperlink. In thiscase, it is easier for attackers to deceive users into handingover private information or, even worse, installing malicioussoftware on their phones. On the other hand, if the barcodeapplication displays the URL to the user, an astute user maynotice a suspicious-looking URL. However, URL shortenerscan make it more difficult for users to evaluate a URL.Figure 2 depicts an application displaying the URL to theuser and awaiting further action by the user.To frame the scope of the problem we tested the most popular applications from the Android and Apple marketplaces.We downloaded and tested the top ten free applications for“barcode scanner” from Google Play and the Apple AppStore. Tables 1(a) and 1(b) show the specific applicationstested, whether the application automatically visits a URLretrieved from a barcode, and the order (top to bottom) ofpopularity on March 8, 2012. Several of the most populariOS applications were either not free, or did not scan QRcodes. We did not test any applications that were not free.II. QR ISHING E XPERIMENTThe ease with which one can create and distribute QRcodes may make them attractive to scammers seeking todirect people to phishing websites. The purpose of thisstudy is to understand how users interact with QR codes inpublic spaces and to assess the susceptibility of smartphoneusers to QRishing attacks. In this experiment, we distributedflyers around the city of Pittsburgh, PA. Each passerby whoscanned one of the flyers was directed to a a brief onlinesurvey.A. MethodologyWe posted flyers with QR codes both on the CarnegieMellon University campus and in public locations aroundPittsburgh (e.g., at bus stops, public bulletin boards atrestaurants, coffee shops, etc). All flyers were posted inpublic locations where flyers are routinely placed. EachQR code on a poster represented a unique URL to ourwebserver, allowing us to unambiguously know in which2
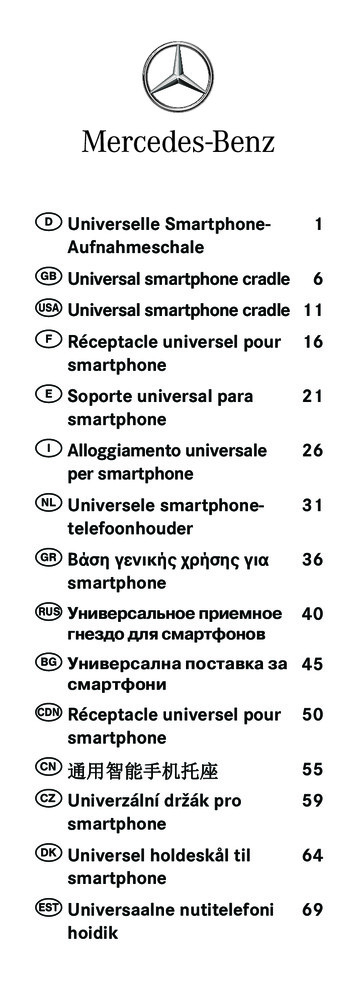
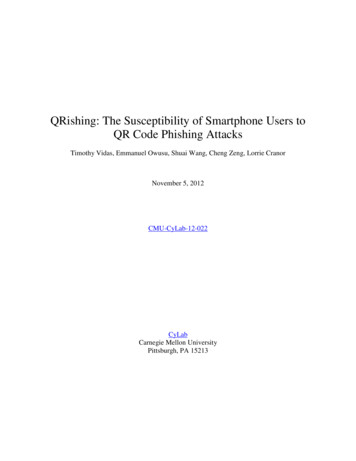
(a) qrcode only(b) qrcode instructions(c) qrcode SNS(d) ripoff SNSFigure 3. An example flyer for each of the four conditions deployed in the QRishing experiment. (a) shows qrcode only –flyers with a QR code. (b)shows qrcode instructions –flyers with a QR code and usage instructions. (c) shows qrcode SNS –flyers advertising a mock SNS study with QR code. (d)shows ripoff SNS –flyers advertising a mock SNS study with rip-off tabs.location the participant observed our flyer. We used random,unique URLs similar to popular “URL shortening” servicesfor each flyer. Such URLs are commonly used in QR codeadvertising. Further, the use of random URLs minimizes therisk that after scanning one flyer, curious participants couldeasily determine and visit URLs associated with other flyers.In the last week of January and first week of February 2012,we posted flyers at 139 different locations: 104 campuslocations, 35 off-campus locations. Each flyer was checkedweekly and, if needed, replaced. This experiment had fourconditions (pictured in Figure 3): qrcode only. A flyer with only a QR code. qrcode instructions. In addition to the QR codegraphic, includes instructions on how to use a QR code. qrcode SNS. Innocuous flyer utilizing a QR code (a“social networking” user study advertisement). ripoff SNS. A user study flyer similar to 3, but withtraditional rip-off tabs instead of a QR code.All conditions were randomly distributed across the selected locations and ran simultaneously for four weeks.When a participant scanned the QR codes (or visited theURL on the rip-off tab), they were taken to our website where they were informed about the experiment andprompted to participate in an optional survey.Conditions qrcode only and qrcode instructions did nothave any advertised function, thus any participant in theseconditions is likely to have scanned the QR code outof curiosity, compulsion, fun, etc. Conditions qrcode only,qrcode instructions and qrcode SNS all involve the use ofQR codes and thus provided insight into the frequency withwhich QR codes on flyers are scanned. Without a QR code,ripoff SNS served as a performance baseline to comparewith the other three conditions.Regardless of condition, upon visiting the URL, participants were notified of the study via webpage and given thechoice to follow a link to take an optional survey. Uponcompletion of the survey (or electing not to partake in thesurvey) the participant was automatically taken to a debriefwebpage for the experiment. Participants who reported beingunder 18 years old were informed that their data would notbe used in research and we discarded associated data. Wealso recorded the time of access, the IP address, and useragent from the server web log.B. ResultsOf the 139 posted flyers, 85 (61%) were utilized byparticipants at least once, totaling 225 hits across all conditions. Examination of source address, access time and posterlocation (URL) indicated that only once did the same devicescan a QR code twice. One hundred twenty-two participants(54%) completed the optional survey. Seventeen participantsstarted, but did not complete the survey, and five participantsself-reported to be under 18, and were removed from thestudy.In the survey, participants were asked “Do you know whata QR code is?” (for full survey text see Appendix A). Themajority (83%) of survey takers responded “Yes,” indicatingsome familiarity with the technology. Even 51% of participants in ripoff SNS, which did not use a QR code, answered“Yes,” further indicating that participants were aware of thetechnology. We posit that although some smartphone usersmay not know the term “QR code,” the majority of usersknow the function of a QR code when presented with one.We also asked participants about the primary reason theychose to scan the QR code (including an option for “I didnot scan a QR code”). We observed far more participantsscanning the QR code out curiosity than for related information. Figure 4 shows the distribution of survey responsesfrom participants. More than 75% of the survey respondentsscanned the flyer out of curiosity (64%) or for fun (14%).Less than 4% claim to have scanned the QR code becausethe related information seemed useful. Twenty percent of therespondents indicate that they did not scan a QR code, andall of these participants were in ripoff SNS. As expected,participants not using a mobile device were also predominately in the condition without a QR code, ripoff SNS,though not exclusively (Figure 5).Among the four conditions, qrcode only had the most3
Figure 4. Survey responses. Most participants scanned QR codes out of curiosity, agree than QR codes are useful, read the URL prior to visiting thewebsite, and know the term “QR code.” Full survey text can be found in Appendix A.Figure 5.Mobile vs desktop users by condition.Figure 6.participants while ripoff SNS had the least number ofparticipants. Figure 6 shows the distribution of participantswho both visited the URL and completed the survey acrossthe four conditions. While curiosity was reported to be themain reason for initially scanning a QR code, participantswere significantly more likely (χ2 3.8639, df 1, p 0.049) to complete the survey in conditions that explicitlyadvertised a study (73%) than those that had no advertisedfunctionality (36%).Fifty-eight percent of respondents report reading the URLprior to visiting the link. While this behavior is likely saferthan that of the 36% who did not read the URL, they stillvisited an obscure URL to an unrecognized domain (weregistered the domain just prior to the study).Across all four conditions we found that men were atleast 2.5 times more likely to participate, especially inqrcode only where we observed more that 7.6 times asmany male participants. While we are uncertain of exactlyhow many individuals passed our flyers, nor how manyof them possessed mobile devices, we can approximatepercentages based on demographic data for the respectiveareas. For the on-campus flyers we can compare to CMU’sgeneral population [28], and for off-campus flyers we cancompare to Pittsburgh census [14] data for the area weposted flyers. Further, we can use market penetration data [6][7] to approximate percentages of smartphone owners. TheVisited URLs and Survey Completion by conditiongender distribution on-campus is 63% male, 37% female[28], and off-campus in the Pittsburgh area is 52% male,48% female [14]. Among U.S. smartphone users, the genderis distributed 47% male, 53% female [7]. The incumbentpopulation suggests that approximately 50–60% of our participants should be male, yet we observed 75%.Figure 7. Self-reported gender by condition. qrcode instructions has fewermale and more “Prefer not to answer” participants than any other condition.The only condition that fell within the expected gender ratio was qrcode instructions. As shown in Figure 7,qrcode instructions has fewer male respondents and more“Prefer not to answer” than the other three conditions. Thereis no way to tell the gender of those who selected “Prefer notto answer.” While the result is not statistically significant, itis clear that in our experiment qrcode instructions had more4
employed, such as a local band or work-from-home opportunities, but would have similarly limited the set of individualsattracted to the flyer.In our experiments we used “shortened URLs,” whichhave their own security implications [26]. It is possible thatusers may be more likely to follow a typical URL, but wefelt that using a shortened URL exhibited more realisticconditions as shortened URLs are often used in QR codeadvertisements. The short property of shortened URLs alsofits nicely with mobile devices as the limited screen spacewill cause many URLs to be truncated for display, resultingin the user only having the ability to observe part of theURL. Further, we wanted seemingly random URLs so thatusers could not easily predict the URL of a poster they hadnot physically encountered.Particular to ripoff SNS, participants may have been lesslikely to correctly type or may have had less desire toparticipate in the study due to the URL format. The URLsused in all conditions were similar to those found in popularURL shortening services (e.g., http://bit.ly, http://goo.gl).Such a random pattern (e.g., skx0r132) may be perceiveddifferently by participants than a link consisting of a domainname and a common webpage naming convention (e.g.,study.php).Figure 8. Poster performance by location type. Blue bars indicate thenumber of posters posted for each location type. Red bars show theaccumulated clicks for all posters of each location type.respondents who wished not to reveal their gender.Our two most observed age ranges (on and off campus)were 18–24 and 25–34, together accounting for 78% of ourparticipants. This closely aligns with the two age groups thathave most adopted smartphones [6].We found that flyers at bus stops far outperformed otherlocations. On average, flyers posted at bus stops solicitednearly seven URL visits per flyer. Figure 8 shows thedistribution of off-campus flyers as grouped by bus stop,restaurant, coffee shop and other. Flyers posted at bus stopsmay receive more attention simply due to behavior at sucha location. For example, those waiting for the bus to arriveare likely bored and are forced to wait idly at the locationfor a non-trivial duration.We examined other metrics such as day-of-week, timeof-day, and user perception of QR code usefulness all ofwhich did not prove useful as a predictor of behavior.Additionally, we examined the networks from which deviceswere connecting, and the results were as expected in the U.S.Of the cellular network users 54% used Verizon Wireless,31% AT&T, and 15% Sprint. The non-cellular users primarily (63%) used campus networks while the primary homeInternet providers where Comcast (18%) and Verizon (6%)III. S URVEILLANCE E XPERIMENTSince QR codes are abundant in urban areas, we wantedto observe how people interact with them in public spaces.Specifically, we wanted to identify how many participantswould scan the QR code and also visit the associated websiteversus the number of participants who would scan the QRcode but elect not to visit the website. This observationprovides insight about the potential for QR codes as a phishing attack vector because examining the URL is a practicaland effective defense against many phishing threats. Theuse of QR codes minimize the person’s effort in obtaininga URL; the person does not have to manually transcribethe URL from the source material. Such reduced interactionmay encourage the unsafe behavior of visiting a questionablewebsite without seeing the URL, sacrificing security in favorof usability.This section describes the methodology, experimentaldesign, and analysis of the surveillance experiment. We referto this experiment as surveillance exp in the subsequent text.C. LimitationsUnlike the envisioned attack scenario, we are bound byethical, legal, and Institution Review Board limitations inthe placement of QR codes. A would-be attacker may havelittle consideration for vandalism, covering existing QRcodes with his own, or any number of other less scrupulousactivities.Like many on-campus studies, our observed populationfor on-campus flyers is biased to the local population ofCMU. Similarly, our off-campus flyer locations were subjectto the respective populations in Pittsburgh and may not berepresentative of other areas.In qrcode SNS and ripoff SNS, the “social networkinguser study,” will have only attracted individuals interestedin such a study. Other false pretenses could have beenA. MethodologyWe posted a flyer containing a QR code on a bulletinboard at Carnegie Mellon University and placed it undervideo surveillance. By comparing captured video footage ofpeople scanning the QR code with server logs, we were ableto identify the number of participants who scanned the codeas well as the number of participants who actually visitedthe URL encoded in the QR code. If a corresponding entrydid not exist on the server we assumed that the participantscanned the QR code, but chose not to visit the website. The5
experiment had two conditions: an incentive condition anda no incentive condition. surv qrcode only. In the no incentive case, we collected two weeks of footage using a flyer containingonly a QR code similar to that in Figure 1. surv incentive. Following the incentive case, we collected two additional weeks of footage using a flyeroffering the chance to win a 50 Amazon gift card.The sequence of events a participant followed in bothconditions is as follows. First, a person who walks by thebulletin board noticed our flyer. They became a participantin our study when they entered the field of view of thecamera and scanned the QR code. If the participant choseto visit the website (or the reader application automaticallyopened the link), they were presented with a simple webpage that thanked the person for their interest in the studyand asked them to take a survey. The person may haveselected “continue” to further participate by taking an onlinesurvey, selected “cancel” to continue directly to the debriefmaterial, or simply elected to close the browser. Similar tothe qrishing exp experiment, participants who reported thatthey were under the age of 18 received an additional debriefmessage stating that their data would not be used in the studyand that they were not eligible to receive the incentive.Every time a participant accessed our secure server, werecorded the time of access, the IP address, and user-agentin the web server log. The IP address was used to assessthe connection type (e.g., campus Wi-Fi). Participants insurv incentive were asked to provide their email addressin order to be notified in the event they won the gift card.Providing an email address was at the sole discretion ofparticipant. Furthermore, we ensured that a participant’semail was not correlated with her survey responses.(a) Setup from front(b) Setup from aboveFigure 9. This figure depicts the equipment setup in the surveillanceexperiment. The camera and netbook are mounted on the area above theannouncements board. The box around the person represents the field ofview of the camera. (a) shows the setup from the front, facing the board.(b) shows an isometric view from above.order to minimize storing more data than required by theexperiment and to protect the privacy of the participant.Figure 10 shows sample images of a participant walkinginto the camera’s field of view from the top, scanning theflyer, and walking away. The time-span represented by theframes in Figure 10 is condensed, we have discarded halfof the frames in order to concisely depict the event.C. Removing False PositivesDue to the sensitivity of the software motion detection andthe communal nature of the experiment site, the vast majorityof collected images are not imminently useful. In manycases, passersby will briefly trigger data capture, people willmove chairs into the field-of-view (shown in Figure 11(a)) orotherwise congregate or loiter. Our flyer was secured at eachcorner with thumb-tacks, however other flyers may havebeen secured only at the top leading to some circumstanceswhere activity outside of camera view caused flyers to move(shown in Figure 11(b)). The situation most apt to provide afalse positive is when a subject appears to be facing the flyer,but it is not clear if the subject is actually photographing theflyer. By examining such situations in context with timeadjacent images, we are able to identify unrelated activities,such as posting or retrieving a flyer unrelated to our study (asshown in Figure 12). The captured images provide enoughfidelity to accurately determine which should be discardedfrom analysis.B. Data CaptureWe posted a flyer containing a QR code in the GatesCenter for Computer Science on CMU’s Pittsburgh campus.The flyer was posted on an announcements board locatedon the main floor of the building, an area which is opento the public and access-controlled only at night. A cameraand netbook were mounted above the board to capture theactivity of people around the poster. We checked the flyerdaily to ensure it was unobstructed and that there wereno other QR codes nearby. Figure 9 shows the experimentconfiguration.After some field trials at the site using Android and iPhonesmartphones, we concluded that a 3-by-3 inch QR codewould best ensure the participant was within the field ofview of the camera.The netbook was configured to capture data only whenmotion was detected. The camera recorded four framesper second for as long as there was motion, and for 60seconds thereafter. Each time a picture was captured, it wasimmediately processed with an edge-detection algorithm inD. ResultsWe collected data for four weeks beginning February 7, 2012, two weeks using the surv qrcode only display (10 participants) followed by two weeks using thesurv incentive display (two participants). We conducted a6
Figure 10. A participant photographing the flyer posted on the bulletin board at the bottom of each frame. The sequential progression is from top-to-bottomand left-to-right. The rectangles that overlay the participant indicate software motion detection. Each frame is processed using an edge-detection algorithmin order to minimize capturing more data than required by the experiment and to protect the privacy of the participant.(a) Foreign object(b) External effects (wind)(a) Possible participantFigure 11.The communal nature of the experiment site encouragesinhabitants to loiter, as seen in (a) where an individual has moved a chairinto the experiment area and relaxed. (b) depicts nearby “wind” whichoccasionally caused nearby flyers to trigger motion detection.(b) Actually posting an unrelatedflyerFigure 12. From the frame shown in (a), it is difficult to discern if theperson in is scanning the flyer or not. However with the additional contextof time-adjacent frames, it is obvious that the person is searching for thebest location to post a flyer unrelated to the study. The posting, (b), isperformed several seconds after (a).follow-on experiment by re-posting surv qrcode only fortwo more weeks (six participants) at which point wecould no longer use the location. From video analysis wedetermined that three individuals likely scanned the QRcode, but elected not to visit the URL. Of these threeindividuals, one was from the surv incentive, one wasfrom the surv qrcode only and one was from the followon no incentive condition. In our study 85% (15/18) ofpeople that scanned a QR code proceeded to visit thewebsite, however our results may not be representative of alarger population. Nine participants visited the URL in thesurv qrcode only (plus five more in the follow-on), and onlyone in surv incentive. This ratio suggests that the incentivemay not have actually enticed the participants to scan theQR code. Moreover, more people scanned the poster in thefollow-on than in surv incentive, further re-enforcing the7
tendency to scan the no incentive condition.Five participants, all in the surv qrcode only, started thesurvey. Of these five, one was under 18 and discarded,another selected “Prefer not to answer” and “Neutral” forevery question. The remaining three participants were allstudents of age 18-24, two male and one female. Of thesethree two completed the survey. Interestingly, one answeredthe question “How often do you scan a QR code?” with“Every time I see one” while the other answered “Rarely.”The devices of the nine participants include four iPhones,four Android devices, and one BlackBerry.Figure 13.tion.E. LimitationsThis experiment was conducted in a single, on-campuslocation, limiting results to a single population. The locationwas in the computer science building, leading to a relativelytechnologically-sophisticated population. The location wasnear a primary walking path and near a coffee shop, bothof which contribute to a wider demographic, but the singlelocation certainly has population bias. Further, the participant pool may have degraded between conditions, since thesame location was used for both conditions. For example,participants may not scan a new poster, anticipating that thenew poster is part of the same study.Another technical limitation was the subjectivity in determining whether a person scanned the QR code. If acorrelated entry appeared in the server logs, the personcertainly scanned the QR code. However, without the serverlog entry, we are forced to decide whether the imagesindicate that a person scanned the QR code. As shown in theresults, nearly all (85%) of people who scanned the code alsovisited the website leaving 15% subject to scrutiny. Nonethe-less, the analysis is subjective and it is possible that someinstances may have been misclassified.Observed user-agent and mobile vs desktop browser distribu-In many cases, executing in the same context as thebrowser may be enough to complete attack objectives suchas reading browser cookies or stealing websi
(c) shows qrcode SNS -flyers advertising a mock SNS study with QR code. (d) shows ripoff SNS -flyers advertising a mock SNS study with rip-off tabs. location the participant observed our flyer. We used random, unique URLs similar to popular "URL shortening" services for each flyer. Such URLs are commonly used in QR code advertising.