Transcription
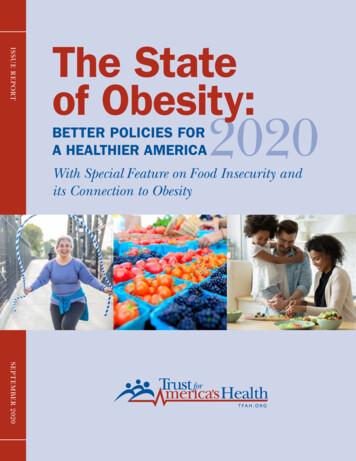
ISSUE REPORTThe Stateof Obesity:BETTER POLICIES FORA HEALTHIER AMERICA2020With Special Feature on Food Insecurity andits Connection to ObesitySEPTEMBER 2020
AcknowledgmentsTrust for America’s Health (TFAH) is a nonprofit, nonpartisanThe Robert Wood Johnson Foundation (RWJF) provided supportpublic health policy, research, and advocacy organization thatfor this report. Opinions in it are TFAH’s and do not necessarilypromotes optimal health for every person and community, andreflect the views of RWJF.makes the prevention of illness and injury a national priority.TFAH BOARD OF DIRECTORSGail Christopher, DNChair of the BoardExecutive Director, National Collaborative onHealth EquityFormer Senior Advisor and Vice President, W.K.Kellogg FoundationDavid Fleming, MDVice Chair of the BoardVice President of Global Health Programs, PATHRobert T. Harris, MDTreasurer of the BoardSenior Medical Director, General Dynamics Information TechnologyTheodore SpencerSecretary of the BoardFounding Board MemberDavid Lakey, MDChief Medical Officer and Vice Chancellor forHealth Affairs,The University of Texas SystemOctavio Martinez Jr., MD, DrPH, MBA, FAPAExecutive Director, Hogg Foundation for MentalHealth,University of Texas at AustinKaren Remley, MD, MBA, MPH, FAAPDirector, Center for Birth Defects andDevelopmental Disabilities,U.S. Centers for Disease Control andPreventionStephanie Mayfield Gibson, MDPopulation Health Advisor and Chair/Member,Nonprofit Boards of DirectorsFormer KY State Public Health Commissionerand Senior Healthcare ExecutiveJohn A. Rich, MD, MPHCo-Director,Center for Nonviolence and Social Justice,Drexel University School of Public HealthREPORT AUTHORSCONTRIBUTORSMolly Warren, SMSenior Health Policy Researcher and Analyst,Trust for America’s HealthLauren BeckerTFAH InternStacy Beck, JDConsultantDaphne Delgado, MPHSenior Government Relations Manager, Trust forAmerica’s Health2Cynthia M. Harris, PhD, DABTDirector and Professor, Institute of Public Health,Florida A&M UniversityTFAH tfah.orgVinu Ilakkuvan, DrPHConsultantSarah Ketchen Lipson, PhD, EdMAssistant Professor,Boston University School of Public HealthAssociate Director,The Healthy Minds NetworkEduardo Sanchez, MD, MPHChief Medical Officer for Prevention and Chief ofthe Center for Health Metrics and Evaluation,American Heart AssociationUmair A. Shah, MD, MPHExecutive Director,Harris County (Texas) Public HealthVincente Ventimiglia, JDChairman of Board of Managers,Leavitt PartnersTFAH LEADERSHIP STAFFJohn Auerbach, MBAPresident and CEONadine J. Gracia, MD, MSCEExecutive Vice President and COOREVIEWERSBill Dietz, MD, PhDChair,Sumner M. Redstone Global Center forPrevention and Wellness, The GeorgeWashington University Milken Institute Schoolof Public HealthGeraldine Henchy, RDN, MPHDirector Nutrition Policy and Early ChildhoodPrograms,Food Research & Action Center
ACKNOWLEDGMENTS . . . . . . . . . . . . . . . . . 2INTRODUCTION . . . . . . . . . . . . . . . . . . . . . 4SECTION 1. S PECIAL FEATURE: FOODINSECURITY AND OBESITY . . . . 9A. Connections Between Food Insecurity andObesity . . . . . . . . . . . . . . . . . . . . . . . . . 12B. F ederal and State Programs to ReduceFood Insecurity . . . . . . . . . . . . . . . . . . . 14i. Federal Hunger and Nutrition Assistance:WIC, School/Child Nutrition Programs,SNAP, Nutrition Incentive Programs, andHealth Food Financing Initiative . . . . . . 14ii. Child Care and Education Settings: HeadStart, ECE State Requirements, K–12Local Wellness Programs, and SmartSnacks . . . . . . . . . . . . . . . . . . . . . . . 23SECTION 2. O BESITY-RELATED DATA ANDTRENDS . . . . . . . . . . . . . . . . . 25A. Trends in Adult Obesity . . . . . . . . . . . . . 25i. State Obesity Rates . . . . . . . . . . . . . . 25ii. Demographic Trends . . . . . . . . . . . . . . 27B. Trends in Childhood Obesity . . . . . . . . . . 34i. National Childhood Obesity Rates . . . . . 35ii. Obesity Rates in Children Ages 10 to 17 . 35iii. High School Obesity Rates . . . . . . . . .36SECTION 3. O BESITY-RELATED POLICIESAND PROGRAMS . . . . . . . . . . . 38A. Economics of What We Eat and Drink . . . 38i. F iscal and Tax Policies that PromoteHealthy Eating: Beverage Taxes, and theNew Markets Tax Credit . . . . . . . . . . . . 38ii. Food and Beverage Marketing . . . . . . . 40B. Nutrition Guidelines and Education . . . . . 42i. Dietary Guidelines, and Nutritionand Menu Labels . . . . . . . . . . . . . . . . . 42The State ofObesityTABLE OF CONTENTSTable of ContentsC. Community Policies and Programs . . . . . 44i. B uilt Environment: Community Design andLand Use, and Safe Routes to Schools . 44ii. CDC Community Initiatives . . . . . . . . . 47Q&A with Nicolas Barton, Southern PlainsTribal Health Board Foundation . . . . . . . 50D. Healthcare Coverage and Programs . . . . 56i. Medicare and Medicaid . . . . . . . . . . . . 56ii. Healthcare and Hospital Programs . . . . 57E. Obesity and the Military . . . . . . . . . . . . . 59i. Recruitment . . . . . . . . . . . . . . . . . . . . 59Q&A with Major General (Ret.) Steven J.Lepper, Mission: Readiness . . . . . . . . . 60ii. Service Members and Families . . . . . . 62iii. Veterans . . . . . . . . . . . . . . . . . . . . . . 62SECTION 4. RECOMMENDATIONS . . . . . . . 63APPENDIX: OBESITY-RELATED INDICATORSAND POLICIES BY STATE . . . . . 74REFERENCES . . . . . . . . . . . . . . . . . . . . . . 81View this report online at tfah.org/stateofobesity2020. For more data on obesityprevalence, policies, and programs, visit stateofobesity.org.SEPTEMBER 2020
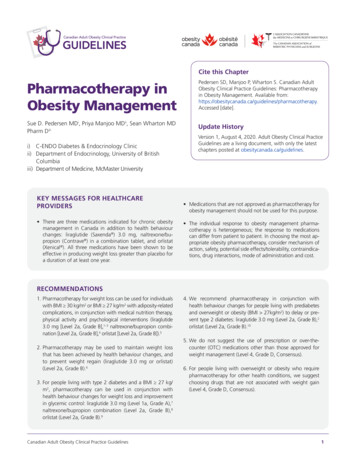
I NT RO D UC TIONINTRODUCTIIONThe State ofObesityIntroductionThe adult obesity rate passed 40 percent nationally for thefirst time according to the 2017–2018 National Health andNutrition Examination Survey (NHANES), a 26 percent jumpfrom 2007–2008.1,2 More recent state-level data from the 2019Behavioral Risk Factor Surveillance System (BRFSS) confirmthe trend that adult obesity rates continue to climb.3 In 2019,12 states had obesity rates in the highest category for thissurvey (35 percent or greater), a jump from three states in2014 and nine in 2018.Percent of Adults and Youth with Obesity, ��99200220–01200420–03200620–0520Percent of Adults (Age 20 ) with ObesitySource: 1620–1518-207012Percent of Youth Age 2–19 with ObesitySEPTEMBER 2020
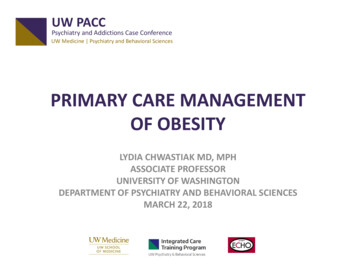
Despite this continuing rise in obesityand its consequences, the United Stateshas failed to create a coordinatedand comprehensive response to theobesity epidemic. The higher ratesof hospitalization and mortality forCOVID-19 patients with underlyingconditions, including obesity andrelated chronic diseases, underscorethe importance of working toward anAmerica where current and futuregenerations live healthier lives.4Furthermore, the racial and ethnicdisparities that characterize COVID-19and obesity are a sharp reminder ofthe effects that underlying social andeconomic conditions and structurescan have on the health and well-beingof Americans at the individual, family,neighborhood, and national level.The United States needs bolderpolicies and more investment in longterm, evidence-based programs thatreduce obesity; more collaborationacross public and private sectors; moreinnovation and better solutions to theobesity crisis; and continued attentionand more action on addressing thestructural and systemic inequities thatundermine many Americans’ health.The COVID-19 pandemic has alsocreated new obstacles, and exacerbatedexisting barriers, to healthy eatingand physical activity—like gymclosures, reduced food purchasingpower for millions due to income loss,and the interruption of school mealprograms—as well as forced a rushedreassessment of safety-net benefitsand food-assistance programs. As thepandemic continues to make Americanssick across the country and limit normalactivity, it is important that policyadjustments designed to sustain andsupport families’ nutrition needs andAdult Obesity Rates by State, NMWVMOVAKYNCTNSCARMSTXINOHALGALA 25%FLAKVTNHMACT RINJDEMDDC25% – 30%30% – 35%HI35% No dataSource: TFAH analysis of BRFSS datasafe physical activity continue to be inplace, and that the nation learns fromthe current disaster to ensure there arepolicies in place to protect Americans’health during future crises.This is the 17th annual report by Trustfor America’s Health on the obesitycrisis in the United States. This year,our special feature highlights thecritical issue of food insecurity, a keysocial determinant of health, and itslink to poor diet quality, obesity, andchronic disease, an issue that hasincreased substantially with the COVID19 pandemic. Additionally, this report,as in previous years, includes a sectionthat reviews the latest data available onadult and childhood obesity rates (seepage 25), a section that examines keycurrent and emerging policies (page38), and, finally, a section that outlinesrecommended policy actions (page 63).TFAH tfah.org5
CONSEQUENCES OF OBESITY: COVID-19 AND BEYONDEarly data suggest that obesity is aof new diabetes diagnoses in childrenrisk factor for more severe diseasebetween the years 2001 and 2012and complications among individualsfound a 7.1 percent annual increaseinfected with COVID-19.5,6It appearsin cases diagnosed per 100,000patients with obesity are more likely tochildren ages 10 to 19 (versus a 1.4require hospitalization: the Centers forpercent increase annually for typeDisease Control and Prevention (CDC)1 diabetes, which is not associateddata from March 2020 show almost halfwith obesity).25(48.3 percent) of hospitalized COVID-19patients ages 18 and older with knownlhad substantially higher medical costshealth histories had obesity, and datathan healthy-weight individuals.26from New York City area hospitals showA 2016 study found that obesity42 percent of their COVID-19 patientsincreased annual medical expenseshad obesity and that it was the second-in the United States by 149 billion.27most common underlying conditionIndirect, or nonmedical, costs fromamong COVID-19 patients.7,8,9to missed time at school and work,associated with a range of physical andlower productivity, premature mortality,mental diseases; causes additionaland increased transportation costs.28losses individually and collectively; andreduces the nation’s military readiness.Specifics include:lll Being overweight or having obesityis one of the most common reasonsyoung adults are ineligible for militaryservice. In addition, the proportion of Obesity increases the risk of a rangeactive-duty service members who haveof diseases for adults—including typeobesity has risen in the past decade—2 diabetes, high blood pressure, heartalong with healthcare costs and lostdisease, stroke, arthritis, depression,work time. According to Mission:sleep apnea, liver disease, kidneyReadiness, a nonpartisan group ofdisease, gallbladder disease,more than 700 retired admirals andpregnancy complications, and manygenerals, excess weight prevents onetypes of cancer—and an overall risk ofin four young adults from qualifyinghigher mortality.10,11,12,13 14,15, 16,17,18,19,20for military service, and the U.S. Children with obesity are also atgreater risk for certain diseases, liketype 2 diabetes, high blood pressure,and depression.21,22,23,24 A 2017 studyTFAH tfah.orgobesity also run into the billions dueIn addition to COVID-19, obesity ishealthcare costs and productivity6 Studies show individuals with obesityDepartment of Defense is spendingmore than 1 billion each year onobesity-related issues.29,30 (Seeinterview on page 60.)
SUMMARY OF 2020 STATE OF OBESITY RECOMMENDATIONSTrust for America’s Health directs most ofits policy recommendations to national andstate officials. TFAH’s two guiding principleswhen making these recommendations are:(1) apply a multisector, multidisciplinaryapproach (because a single effort in justone sector or discipline is not likely tohave a significant impact); and (2) anintentional focus on those populations witha disproportionate burden of obesity first.A summary of TFAH’s recommendationsare below; the full recommendations areon page 63.1. Increase health equity bystrategically dedicating federalresources to efforts that reduceobesity-related disparities by:lKit Leong / Shutterstock.coml Expanding CDC obesity-preventionprograms including the State PhysicalActivity and Nutrition program and Raciallllll Encouraging Community Eligibility Programlpublic health agencies that receiveCOVID-19 flexibilities in SNAP; Incentivizing communities towards publicland use that supports healthy foodoptions, like adding healthful corner stores, Maintaining eligibility, increasing valueparticipation barriers, and extendingcommunity gardens, and farmers’ markets3. Change the marketing and pricingstrategies that lead to healthdisparities by: Improving diet quality in SNAP throughl Closing tax loopholes and eliminating Creating a new Social Determinants ofvoluntary pilot programs, and supportingHealth program at CDC that supportsprograms that promote healthy eating,business-cost deductions related tomultisector collaborations;like SNAP-Ed and GusNIP;the advertising of unhealthy food and Prioritizing health equity in planning andbeverages to children on television,l Adapting federal grantmaking practicesactivities also have the tools to2. Decrease food insecurity while improvingthe internet, social media, and placeschildren and postpartum women,frequented by children;streamline clinic processes, implementingbest able to conduct obesity-preventionsuccessfully apply for grants. Expanding access to WIC for youngextending certification periods toto ensure that organizations that arel Clarifying and further enforcing USDA’sonline purchasing, and investing in locallocal wellness policy regulations tocommunity health partnerships;apply to school-issued digital devices,applications, and online platforms;l Bolstering the Child and Adult Care FoodProgram by allowing a third meal servicel Discouraging unhealthy food and drinkoption, increasing reimbursementsoptions by enacting state-level sugary drinkto support healthier standards,taxes—and using the revenue to address Continuing COVID-19 nutritionstreamlining administrative operations,health and socioeconomic disparities; andwaivers and policies that USDA hasand continuing funding for nutrition andimplemented through the duration of thewellness education;nutritional quality of available foods by:lsetting; andpractices guide to better support statedecision-making at HHS; andlmeals, regardless of school status orschool year;of benefit, ensuring there’s no newl Supporting access to healthy schoolenrolled students for the 2020-2021 Developing an obesity program best-CDC grants;lparticipation and enrollment;and Ethnic Approaches to CommunityHealth program, among others; Expanding no-cost school meals to allpublic health emergency;l Reducing food marketing at schoolsas well as other places that primarilyattract children and adolescents.TFAH tfah.org7
WHAT IS OBESITY?4. M ake physical activity and thebuilt environment safer and more“Obesity” means that an individual’s body fat and body-fat distribution exceed theaccessible for all by:llevel considered healthy.31,32 There are many methods of measuring body fat. Body- Increasing federal education fundingmass index (BMI) is an inexpensive method often used as an approximate measure,to support physical-educationalthough it has its limitations and is not accurate for all individuals (e.g., muscularimplementation efforts;lindividuals often have lower body fat than their BMI would suggest). To calculate Codifying and funding new evidence-BMI, divide a person’s weight (in kilograms) by his or her height (in square meters).based physical-activity guidelines everyThe BMI formula for measurements in pounds and inches is:10 years;l Increasing funding for activeBMI transportation projects like pedestrian(Weight in pounds(Height in inches) x (Height in inches))x 703and biking infrastructure, recreationaltrails, and Safe Routes to Schools;lFor adults, BMI is associated with the following weight classifications: Making Safe Routes to Schools, VisionBMI LEVELS FOR ADULTS AGES 20 Zero, Complete Streets, and non-linfrastructure projects eligible under theBMI LevelWeight ClassificationHighway Safety Improvement Program;Below 18.5Underweight18.5 to 25Healthy weight25 to 30Overweight Linking federal infrastructure fundingwith states’ adoption of CompleteStreets principles; andlMedical professionals measure childhood obesity differently. That’s becausephysical activity and active transport,weights and heights, which are used to calculate BMI, change as children grow,and encouraging of outdoor play.so percentiles of BMI are used, rather than a single absolute value as used inadults. Doctors determine childhood weight classifications by comparing a child’sheight and weight with BMI-for-age growth charts developed by CDC using datacollected from 1963 to 1965 and from 1988 to 1994.34to community settings by:BMI LEVELS FOR CHILDREN AGES 2-19 Clarifying to health insurers that obesityrelated preventive healthcare servicesBMI LevelWeight Classificationmust be covered with no patient cost-Below 5th percentileUnderweightsharing like all other grade A or B5th to 85th percentileHealthy weightU.S. Preventive Services Task Force85th to 95th percentileOverweightAbove 95th percentileObesityrecommendations; Expanding the capacity of healthcareproviders and payers to screen andlrefer individuals to social service needs,coordinate care delivered by health and Eliminating barriers to coverage forgoals and strategies, and evidence-communities of color, rural communities,based programs; andand other underserved populations;social service programs, sufficientlyl Covering evidence-based Addressing social determinants ofcomprehensive pediatric weight-better integrate social needs data intohealth in communities with high levelsmanagement programs and servicesmedical records;of obesity, through community-directedin their Medicaid benefits.reimburse social services providers, and8Severe Obesityspaces more conducive and safer forclose disparities and gaps from cliniclObesity40 and above Working locally to make community5. Work with the healthcare system tol30 and aboveTFAH tfah.orgl
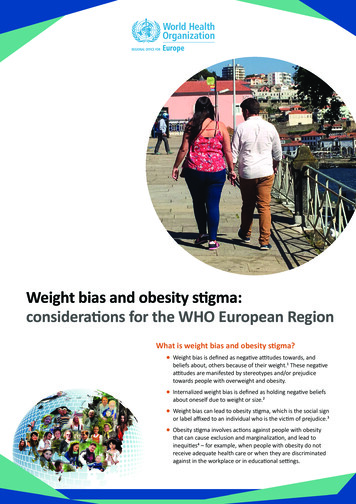
SECTI O N 1Food insecurity — along with many other social determinantsof health — leads to worse health outcomes, is linked with lowerquality diets and higher healthcare costs in certain situations,and tracks with higher levels of obesity in many populations.35The United States Department ofAgriculture (USDA) defines foodsecurity as “access by all people [in ahousehold] at all times to enough foodfor an active, healthy life during theyear.”36 Households with food insecurityreport “being worried food would runout”; that “the food bought did notlast”; and that they “could not afford abalanced meal.” Households with verylow food security additionally reportthey “cut the size of meal or skippedmeal”; “ate less food than felt should”;and “were hungry but did not eat.”37Food Security Levels:1234 High food security: No reported indications of food-access problems orlimitations.Marginal food security: One or two reported indications—typically, anxietyover food sufficiency or a shortage of food in the house. Little or noindication of changes in diets or food intake.Low food security: Reports of reduced quality, variety, or desirability ofdiet. Little or no indication of reduced food intake.Very low food security: Reports of multiple indications of disrupted eatingThe State ofObesitySECTION 1: SPECIAL FEATURE: FOOD INSECURITY AND OBESITYSpecial Feature: Food Insecurityand Obesitypatterns and reduced food intake.Source: USDAPercent of U.S. Household with Food Insecurity, 1999–20191614128642099 00 01 02 03 04 05 06 07 08 09 10 11 12 13 14 15 16 17 18 1919 20 20 20 20 20 20 20 20 20 20 20 20 20 20 20 20 20 20 20 20Food Insecurity (includes very low food security)Very low food securitySource: USDA analysis of data from the Current Population Survey Food Security SupplementSEPTEMBER 202010
The prevalence of food insecuritylinks closely to economic conditions atthe individual and societal level. Lowincome households are much more likelyto be food insecure than the overallpopulation.38 And there were higherlevels of food insecurity in the UnitedStates around the financial crisis andrecession in the late 2000s—and allindications point to even higher foodinsecurity this year from the COVID19 pandemic.39,40 According to ananalysis from Northwestern UniversityInstitute of Policy Research of U.S.Census Bureau’s Household PulseSurvey from April 23–June 3, 2020,25 percent of all respondents and 30percent of respondents with childrenreported experiencing conditions of foodinsecurity.41 This is an huge increase fromthe latest USDA figures, from 2019, when10.5 percent of U.S. households—35.2million Americans—were food insecureat least part of the year.42 USDA has alsoproposed and finalized rule changesover the last few years that would limiteligibility and reduce food safety-netprogram benefits, all of which may becontributing to food insecurity as well.43This section outlines the researchconnecting food insecurity to obesity,key programs, and considerations andapproaches to the issue.Percent of U.S Households with Indicators of Adult Food Insecurity, 20184.8%90.1%Worried food would run out2.8%81.9%Food bought did not last2.9%80.3%Could not afford balanced meal0.2%35%Cut size of meal or skipped meal0.2%0%Hungry but did not eat0%Lost weightDid not eat whole day68.6%3.9%47%0%1%31.8%20Food SecureLow food security4060Very low food securitySource: USDA analysis of data from the Current Population Survey Food Security Supplement10TFAH tfah.org95.9%94.2%10.6%097.2%96.8%35.5%Ate less than felt should98%80100
COVID-19’S EFFECT ON FOODINSECURITYAt the time of this publication, the COVID19 pandemic has hurt Americans in manyways—it has killed more than 190,000people and made millions more sick; ithas caused a huge economic recessionwith more than 20 millions lost jobs inApril 2020 alone and even more jobs thatnow have reduced hours and income; andit has forced many societal changes thathave intensified food insecurity, like abruptschool closures.44,45,46 It has also exposedand exacerbated existing racial/ethnichealth disparities, and gaps in safety-netprograms and the healthcare system.Feeding America, a national nonprofit witha national network of food banks and otherAustin TX residents wait in line at the Central Texas Food Bank, April 2020. Vic Hinterlang / Shutterstock.comProjected Increase in Food Insecurity from COVID-19, from 2018 to 2020community-based agencies, estimatesthat 54 million more Americans, includingWA18 million children, may experience foodMTinsecurity because of the pandemic. (SeeIDdemand and a Northwestern UniversityWISDWYon food insecurity.) Food banks acrossUTNYMIIANENVCAPAILCOKSINAZdue to the pandemic.48,49 The rise inTX(SNAP) enrollment during the pandemicVAKYNCTNSCARMSSupplemental Nutrition Assistance Programmatched these other trends: 2 million moreOKNMOHWVMOsurvey from late April 2020 found that foodinsecurity tripled for families with childrenALGALA 35%FLAK35% – 45%45% – 55%people accessed benefits between February55% and April in the 17 states that have postedHIsuch data, an unprecedented level of need.50For many families, child care and schoolVTNHMACT RINJDEMDDCMNappendix on page 74 for state estimatesthe country have reported large spikes inMENDOR47Source: Feeding Americaclosures compound this income loss.On an average day in 2018, nationalschool programs served nearly 30 millionstudents lunch, including more than 20million free lunches, and almost 15 millionbreakfasts, including almost 12 millionfree breakfasts.51,52 In response to schoolclosures, USDA granted states significantprogram flexibilities for meal-serviceprograms. For example, states could getwaivers that allowed schools to servecontinue offering food and other assistancemeals in non-group settings and outsideto children in their communities.of standard mealtimes, states could serveafter-school snacks and meals outside ofstructured environments, and USDA waivedrequirements that students be presentwhen meals get picked up.53 Many cities,states, and school systems have leveragedthese and other program flexibilities toOn top of all that, higher grocery prices,restaurant closures, new store policies,limited availability of key items, andconcerns about exposure to COVID-19have complicated food access for manyindividuals and families.54TFAH tfah.org11
A. CONNECTIONS BETWEEN FOOD INSECURITY ANDOBESITYFood security is a key social determinantof health, which is defined by CDCas “conditions in the environmentsin which people are born, live, learn,work, play, worship, and age that affecta wide range of health, functioning, andquality-of-life outcomes and risks”.55Food insecurity and obesity have manyof the same risk factors (e.g., incomeor race/ethnicity) and often coexistin populations. Researchers havehypothesized several mechanisms forhow food insecurity might lead to obesity.These include the direct limitations to ahealthy diet that come from inadequatefood affordability and/or availability;stress and anxiety about food insecuritythat generate higher levels of stresshormones, which heighten appetite;and a physiological response in whichthe body stores higher fat amounts inresponse to reduced food availability.56FROM FOOD DESERTS TO FOOD SWAMPS: THE KIND OF FOODAVAILABLE MATTERS12TFAH tfah.orgOver the last decade, there have beenResearchers suggest one way toconsiderable efforts to eliminate foodtackle the challenge of food swampsdeserts, which are low-income areasand promote health equity is throughthat lack a full-service grocery store.zoning laws that incentivize healthy foodRecent research suggests that a moreoutlets to open stores in underservedholistic measure of the kind of foodneighborhoods and that restrict fast-available in an area is more importantfood and other outlets that sell primarilythan supermarket access alone.57,58unhealthy food.62 Others have suggestedResearchers have found a correlationincentivizing or requiring retailers thatbetween fast-food availability and fast-accept SNAP benefits to stock a certainfood consumption among low-incomeamount of healthy food, including freshrespondents.59 A 2017 study foundproduce, although this may have anthat food swamps—communitiesunintended consequence of reducingwith a high density of outlets sellingretailers in neighborhoods that alreadyhigh-calorie, ultra-processed food,have limited options.63 Clearly, additionalsuch as fast-food restaurants andefforts are necessary to ensure that allconvenience stores, compared withAmericans live in neighborhoods that offerones that sell healthy food—haveplenty of opportunities to purchase fresh,a stronger association with obesitynutritious food and fewer opportunities tothan communities that only lackbuy products that may be convenient andsupermarkets.affordable but are largely unhealthy.60,61
Research looking at the effect offood insecurity on obesity, whilecontrolling for socioeconomic anddemographic factors, has foundvariations across populations. Thestrongest associations are amongchildren and women:ll 2015 study using NHANESAdata for 2001–2010 looked at theassociation between food insecurityand obesity among 9,700 childrenages 2 to 11 and found personalfood insecurity associated with anincreased risk of obesity in childrenages 6 to 11 years (but not for underage 6).64 smaller 2016 study found anAassociation between food insecurityand obesity among young Latinxchildren (ages 2 to 8) in low-incomefamilies. The association was strongerin households where mothers wereoverweight or had obesity.65ll 2017 study of 20,000 adults agesA18 to 59 from National HealthInterview Survey data foundfood insecurity was associatedwith 41 percent higher odds ofbeing overweight/having obesityfor white women and 29 percenthigher odds of being overweight/having obesity for Latinx women.They did not find an associationamong Black women, or men of anyrace/ethnicity after adjusting fordemographic differences.66 study using 2009 BRFSS data fromA66,000 adults across 12 states foundthat adults who were food insecurehad a 32 percent greater chance ofhaving obesity compared with foodsecure adults.67The complex relationship betweenfood insecurity and obesity suggests aneed for additional research to fullyunderstand the connection, causalmechanisms, and other potentialmediating or protective factors.Food insecurity is also associatedwith a multitude of other poorhealth outcomes. In adults withfood insecurity, rates of diseases likedepression, diabetes, hypertension, andhigh cholesterol, as well as generallybeing in poor or fair health are higher.Among children, food insecurity isassociated with higher odds of havingasthma, anemia, and fair or poorhealth, and it is associated with a higherrisk of cognitive issues, aggression,anxiety, depression, behavior problems,depression, suicide, ideation, andhospitalization.68CDC’S RESEARCH AND RECOMMENDATIONS ON FOOD INSECURITYThe Nutrition and Obesity Policy Research and Evaluation Network (NOPREN), supported by CDC’s Division of Nutrition, PhysicalActivity and Obesity, conducts transdisciplinary research related to nutrition and obesity, and it evaluates the effectiveness ofobesity-prevention policies. Recognizing the relationship between food insecurity and obesity, NOPREN has a working groupfocused on food insecurity.69NOPREN food insecurity working group members have proposed the following models to strengthen the anti-hunger safety net:l Have healthcare providers: (a) writeand healthcare systems to invest inthem to stock a variety of staple andfood
increased annual medical expenses in the United States by 149 billion.27 Indirect, or nonmedical, costs from obesity also run into the billions due to missed time at school and work, lower productivity, premature mortality, and increased transportation costs.28 l Being overweight or having obesity is one of the most common reasons