Transcription
2010 ERP REPORTERP Vendor AnalysisCopyright 2010 Panorama Consulting Group LLC. All reserved. No unauthorized reproduction without the author’s writtenconsent. All references to this publication must cite Panorama Consulting Group as the author and include a link to theoriginal report on Panorama’s site at: !"# %%#&'()&*& ,('-./0'12,(*%)3-(.),3 ,3'43)%5676 3)# 83'9() &'&/:-;-%24 6 0 0 S . S y r a c u s e , S u i t e 9 0 0 - D e n v e r, C O 8 0 2 3 7 Te l e p h o n e : 1 . 3 0 3 - 2 5 6 - 6 2 5 3 w w w. p a n o r a m a - c o n s u l t i n g . c o m
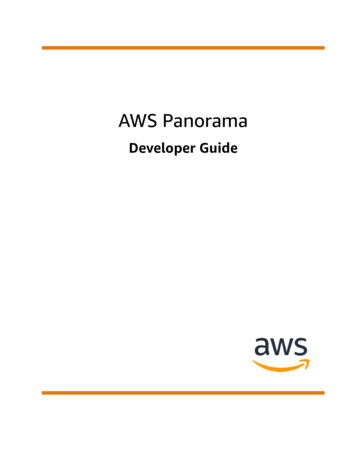
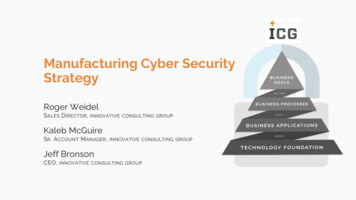
Introduction and SummaryPanorama Consulting Group, an independent and vendor-neutral ERP consulting firm, developed the 2010Enterprise Resource Planning (ERP) Vendor Analysis Report based on survey results from 1,600organizations that have selected or implementedFigure A: Major Vendors’ Market Share inERP within the last four years. This report analyzesproject benefits and drawbacks and summarizesimplementation approach and satisfaction indicatorssegmented by major Tier I, Tier II, and Tier IIITier IIvendor. Figure A indicates market share by major30%SAPvendors in 2009. One point of note is that Tier II31%vendors have increased their market share from23% in 2008 to 30% at the time of the survey.The 2010 ERP Vendor Analysis Report providesfindings on detailed project factors such asimplementation costs, durations, and paybackperiods summarized by vendor. Metrics on selectionsatisfaction and benefits realization based on vendorinteraction are also included to illustrate the marketresults by vendor.2009MS Dynamics15% Oracle25%This report summarizes data on over 20 ERP software solutions considered by surveyed organizations(Figure B). The research sample is categorized into Tier I, Tier II, and Tier III solutions.Figure B: Sample VendorsTier ITier IITier IIISAPOracleOracle eBusiness SuiteOracle JD EdwardsOracle PeoplesoftMicrosoft DynamicsEpicorSageInforIFSQADLawsonCDC SoftwareABASActivant Solutions Inc.Bowen and aWorldConsonaSysproCopyright 2010 Panorama Consulting Group2 0 1 0 E R P R e p o r t - E R P Ve n d o r A n a l y s i sPage 2
Key Vendor FindingsTop 10 Short-listed VendorsParticipating companies in Panoramaʼs 2009 survey were asked to identify four short-listed vendors underconsideration for software selection (Figure C). Tier I vendors were listed most frequently, with one out of fivecompanies (20.4%) considering SAP, 14.9% of companies considering Microsoft Dynamics, and 9.8%considering Oracle eBusiness Suite. The strong presence of Tier I vendors is most likely due to strong brandawareness and reputation as well as the variety of products offered by these vendors.As might be expected, seven of the most frequently short-listed vendors were also the most frequentlyselected. The selection rate was based on the frequency of each vendor being selected over the frequency ofeach being considered in the selection phase (see Figure D). At 54%, Oracle eBusiness Suite and SAP hadthe highest selection rate. Each of the top seven selected vendors were Tier I or Tier II, which indicates thatTier I and Tier II vendors are more likely to be selected following the evaluation process.Figure C: Top 10 short-listed VendorsFigure D: Top 7 Selected ERP VendorsVendorFrequencySelected VendorSelection RateSAP20.4%Oracle eBusiness Suite54.2%Microsoft Dynamics14.9%SAP54.1%Oracle eBusiness Suite9.8%Infor38.5%Epicor7.9%Oracle JDE37.5%Infor4.1%Epicor33.3%Oracle JDE3.1%Oracle PeopleSoft2.6%IFS2.2%Copyright 2010 Panorama Consulting Group2 0 1 0 E R P R e p o r t - E R P Ve n d o r A n a l y s i sPage 3
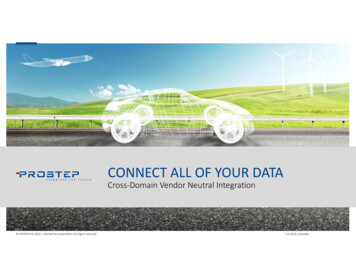
Tier I ERP Packages Have the Lengthiest Implementation DurationsAccording to the 2010 ERP Report published by Panorama Consulting Group in February (available online atwww.panorama-consulting.com), many companies have unrealistic expectations about the duration time oftheir ERP implementations. The implementation process involves numerous steps, including process design,requirements gathering, configuration, business and technical testing, and end-user training. Each step takesa significant amount of time to complete. The expected duration depends on realistic estimations for eachstep. The failure of any one step will result an underestimation of the duration.Overall, 35.5% of organizations found their implementations tookFigure E: Duration Expectationlonger than expected, and 21.5% found their implementations wereshorter than expected (Figure E). Less than half of the companies(43%) completed their implementation projects within the expected21.5%timeline. Tier I implementations have the highest likelihood of taking35.5%longer than expected (30%), while Tier II and III implementationshave the lowest (18% and 5%), respectively (Figure F) .The overall average duration is just over one year (12.3 months).The average actual duration of Tier I implementations was 13.2months, which is approximately the same as Tier IIIimplementations (Figure G). At 11.1 months, Tier II packages hadthe shortest duration times. Eighty percent of companies thatselected Tier III vendors met expected duration time, and 15%experienced duration times shorter than expected.43.0%Longer than expectedAs expectedShorter than expectedFigure F: Duration Expectation by TierFigure G: Average Duration (Months)0%20.0%40.0%60.0%80.0%53%Tier IVendor TierDurationTier I13.2Tier II11.1Tier III13.1Other10.3Overall Average12.330%18%Tier II9%Tier III73%18%5%80%15%As ExpectedShorter than ExpectedLonger than ExpectedCopyright 2010 Panorama Consulting Group2 0 1 0 E R P R e p o r t - E R P Ve n d o r A n a l y s i sPage 4
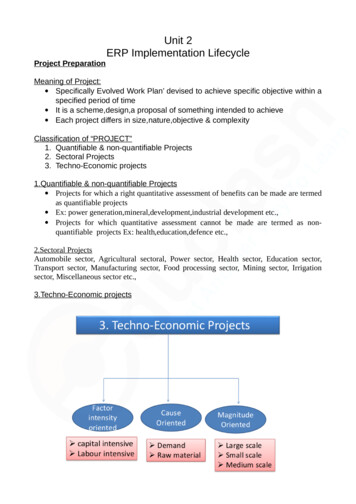
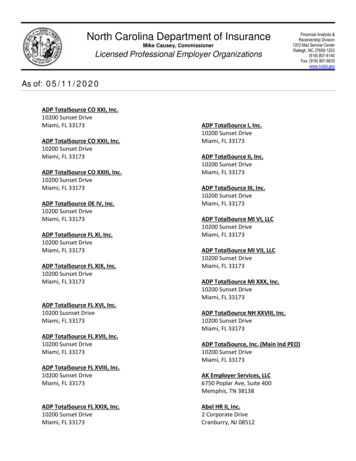
51% of Implementations Are At Risk of Going Over BudgetThe difference between budgeted costs and actual costs is a major issue for most companies implementingERP software packages. Over half (51.4%) of the total respondents indicated their actual costs were overbudget, 40% were on budget, and only 8.6% came in under budget (Figure H). Compared with TIer I and TierIII software packages, Tier II clients have a better chance of limiting ERP spending and coming in under or onbudget (Figure I). Over 50% of Tier II and Tier III clients had actual costs that exceeded budget.Figure I: Budget by Vendor TierFigure H: Budget60.0%45.0%40.0%51.4%8.6%Over budgetUnder budgetOn budget56%53%38%59%34%33%30.0%15.0%11%9%0%Tier IOver budgetThe Most Common Payback Period IsTwo to Three YearsTier IIUnder budget6%Tier IIIOn budgetFigure J: Payback PeriodPanoramaʼs study shows that most companies that completedERP implementations have a payback period (i.e., the lengthVendor TierAverage PaybackPeriod (Years)of time taken to recover the project investment) of two to threeTier I3.0years. Tier I software packages were found to have thelongest payback period (3 years), while Tier II paybackTier II2.2Tier III1.7averaged 2.2 years, and Tier III just 1.7 years (Figure J). Thisfinding is consistent with Panoramaʼs experience with itsclients.Because of its flexibility and niche functions, Tier III software is preferred by small companies, which usuallyhave less than 30 users and less demanding needs. These companies often are looking to expand theircapabilities and want to recoup their capital expenditures as quickly as possible. Mid-size companies (withless than 100 users) that have outgrown Tier III packages often become Tier II clients. They usually have justa few localized sites and prefer short-term investments. Tier I software vendors - who historically targetedlarge enterprises - have begun to woo potential Tier II clients with reduced costs, simplified transactionprocesses, and financial incentives. Tier I software packages, which take ten months longer than Tier IIsolutions to “payback,” can be very attractive to large companies and fast growing small- and mid-sizeenterprises.Copyright 2010 Panorama Consulting Group2 0 1 0 E R P R e p o r t - E R P Ve n d o r A n a l y s i sPage 5
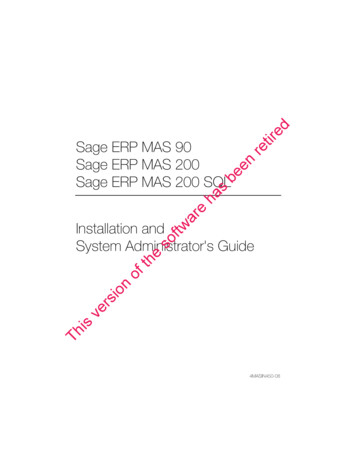
The study also provides a snapshot of major vendorsʼpayback periods (Figure K). Microsoft Dynamics hasthe shortest payback period (2.6 years), and Oraclehas the longest payback period (3.2 years).The distribution of payback periods for each vendortends to be normal, which gives a realistic expectationof an average payback period of 2.7 years. With theexclusion of the five major vendors, the remainingsampled vendors take an average of 1.8 years torecoup costs (almost one full year shorter than SAPʼspayback period).Figure K: Payback Period - Major VendorMajor VendorAverage PaybackTime (Years)Microsoft 8Sample Average2.7Epicor clients paybackperiods are evenlydistributed from one tofour years (around 22%each).The distribution of paybackperiods are very similaramong other major vendors.Copyright 2010 Panorama Consulting Group2 0 1 0 E R P R e p o r t - E R P Ve n d o r A n a l y s i sPage 6
Companies Tend to Customize Their ERP SoftwareWhile Panoramaʼs report found that only 25% of companies choose to heavily customize or completelycustomize their ERP software, the majority of companies tend to do at least some customization duringimplementation. Nearly half of the companies surveyed (47.8%) chose mostly vanilla customizations with atleast some customization to the software. Only 28.3% implemented with no customization at all.Since customizing an ERP packageFigure M: Customization Levelis inherently expensive,complicated, and tends to delaydelivery of the obvious benefits ofCompletely Customizedan integrated system, companiesare not willing to take a lot of riskHeavily Customizedwhen customizing their ERPpackages. However, most4.4%19.4%Mostly Vanillacompanies need to customize their47.8%VanillaERP packages to suit theirbusinessʼs needs. No software28.3%0%12.5%25.0%37.5%50.0%package can meet 100% of abusiness specific requirements. The high rate of mostly vanilla customization projects (47.8%) indicates thatlimited customization is the choice for companies who understand the importance of the process but aretrying to avoid the risks and delays resulting from heavy customization.Figure N shows that the leading three Tier I vendors have fairly similar customization rates. These threevendors have small percentages of complete customization and higher percentages of mostly vanillaimplementations. Although 22% of Tier II clients and 43% of Tier III clients chose vanilla customizations, 69%of Tier II clients and 38% of Tier III clients chose at least some customization. This indicates that small andmid-size enterprises that chose Tier II or Tier III software also required some customization to fit theirbusiness processes.Figure N: Customization Level by %3%SAPCompletely customized22%21%0%Oracle43%38%42%37%Microsoft DynamicsHeavily customizedCopyright 2010 Panorama Consulting Group3%6%Tier IIMostly vanilla12%7%Tier IIIVanilla2 0 1 0 E R P R e p o r t - E R P Ve n d o r A n a l y s i sPage 7
Most Are At Least Fairly Satisfied With Their Selected Software VendorsThe survey responses show that almost half of companies (49.8%) are “fairly satisfied” with their selectedERP software vendor (Figure O). The second highest response was “very satisfied” (18.9%) while just 3.5%are “satisfied.” Therefore, 72% of companies are at least fairly satisfied with their selections. As noted inprevious Panorama studies, satisfaction levels can be misleading. Some executives are just happy tocomplete projects, protect the company from risk and give little thought to whether or not the company isbetter off with the new software or whether or not they're getting as much out of the system as possible. Inaddition, post-implementation user satisfaction differs from initial selection satisfaction. ERP users achievehigh satisfaction levels through advanced operational processes and robust functionality. A forthcomingPanorama study will research leading factors for higher employee satisfaction.Figure O: Satisfaction LevelVery Satisfied18.9%Satisfied3.5%Fairly Satisfied49.8%Neutral4.6%Fairly Unsatisfied15.4%Unsatisfied1.2%Very Unsatisfied6.6%0%13%25%38%50%Figure P indicates selection satisfaction with respect to software vendor tiers. Most companies ratethemselves as “fairly satisfied” within any of the three vendor tiers. Almost 75% of companies are at least“fairly satisfied” with Tier I software, 73% of Tier II clients are at least “fairly satisfied” with theirselections, and almost 70% of Tier III clients are at least “fairly satisfied” with their software.Figure P: Satisfaction by Vendor Tiers60.0%54%43%45.0%26%30.0%18%15.0%0%38%18%14%3% 4%Very Satisfied7%Satisfied3% 6%Fairly SatisfiedTier ITier IICopyright 2010 Panorama Consulting Group10%Neutral17%11% 10%1% 0% 3%4%9%Fairly Unsatisfied Unsatisfied Very UnsatisfiedTier III2 0 1 0 E R P R e p o r t - E R P Ve n d o r A n a l y s i sPage 8
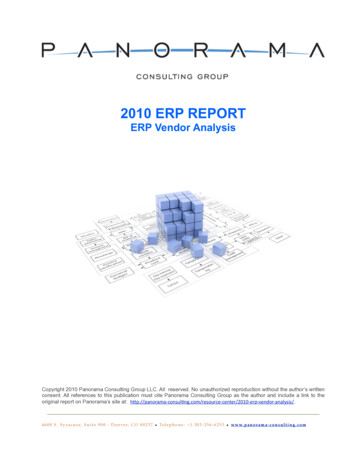
Despite Vendor Selection Satisfaction, Overall Realized Benefits Are LowOverall, most companiesʼ realized benefits fall below 50% of what they expected to achieve. Notably, 55% ofcompanies realized 30% or less of expected business benefits (Figure Q). These failures are especiallyevident with Tier I and Tier III clients. Nearly 70% of Tier I clients and 72% of Tier III clients fail to realize atleast 50% of business benefits (Figure R).Figure Q: Realized Benefits - Market 12%11%10%6%2%5%6%72.0%69.8%18%7.5%0%Figure R: Realized Benefits by Vendor 00%0%Tier IBelow 50%Tier IITier IIIOver 50%Figure S shows that once companies realize 20% of business benefits, the marginal utility of realized benefitsbegins to decrease. This means the chance of getting higher realized benefits becomes smaller. The red lineshows actual realized business benefits, and the blue line shows expected realized benefits. The expectedchance of failure to deliver 50% of business benefits is 61.1%, which provides for only a 38.9% probability ofrealizing over 50% of business benefits.Copyright 2010 Panorama Consulting Group2 0 1 0 E R P R e p o r t - E R P Ve n d o r A n a l y s i sPage 9
Panoramaʼs findings show that realized business benefits are independent from selection satisfaction. Therationale behind this is most likely due to the fact that satisfaction with software selection is usually the resultof a smooth evaluation process, while realized implementation benefits result from the success of variousother factors. CIOs are usually happy with selection as long as the ERP package suits the needs ofmanagement.Companies who donʼt have a business case to quantify realized benefits may be unable to accuratelymeasure go-live results. The 2010 ERP Report showed that 15% of companies donʼt have a business case.In such cases, the satisfaction levels may be over-estimated because executives donʼt have the propermodels to quantify how much more they could achieve. Selection satisfaction is not enough, best-in-classenterprise software initiatives also include effective organizational change management activities to ensureemployees are comfortable, efficient, and productive with the new system.Risk Factors Most Likely to Occur During ImplementationFigure T shows the three risks identified in the survey responses: over-budget, over-time, and failure todeliver 50% of business benefits. Most implementations go over budget (51%) and fail to realize at least 50%expected business benefits (62%). In addition, a large proportion (36%) take longer than expected tocomplete.Figure T: Risk Factor LikelihoodBusiness Benefit 6%Over budgetUnder budgetOn budget62%43.0%Longer than expectedAs expectedShorter than expectedFail to realize 50% Realize 50% Given the high percentage of these unfavorable factors, there is a very high probability that one or more willhappen during implementation. Based on the probability analysis of the entire sample, there is a nearly threeout of four chance (72.4%) that at least one negative result will occur and a nearly one in three chance (31%)that two or more negative results occur in any given implementation.Copyright 2010 Panorama Consulting Group2 0 1 0 E R P R e p o r t - E R P Ve n d o r A n a l y s i sP a g e 10
Tips for Selecting the Right ERP Software PackagePanorama consultants lead clients through a complete evaluation to ensure that ERP software vendors arealigned with the company’s individual business requirements. The following tips are based on our experiencewith dozens of client companies and over 150 software vendors:1. Understand the total cost of ownership. Very little of a typical ERP project's total budget is spent onERP software licenses. In fact, our research shows that the average percentage of cost is approximately25%. The remaining 75% of the budget is typically devoted to implementation services, hardware upgrades,software maintenance, customization, backfilling internal project team resources, and so forth.2. Understand the real implementation demands. Implementations rarely take as little time as softwaresales representatives will claim. Although efforts must be made to control extended timeframes, it’s just a factthat successful ERP implementations take considerable time. A detailed implementation plan should bedeveloped prior to the final decision, and this plan should include details on business process design,configuration, testing, conference room piloting, end-user training, data migration, and more.3. Conduct an organizational readiness assessment. No ERP project succeeds without addressing theend-users of the software. Conducting an organizational readiness assessment prior to making the final ERPdecision will help identify pockets of resistance within the company and determine the organizational changemanagement needed to make the project successful.4. Negotiate with your selected ERP vendor. Some companies spend a great deal of time and moneyanalyzing and selecting a system and then forget to negotiate a fair deal with the vendor. There are severaleffective ways to negotiate a fair cost and contract terms that help optimize overall cost of ownership.ConclusionThe current ERP market is experiencing both growth and challenges. The issues Panorama identified in thisresearch have been experienced by the surveyed companies for various reasons, not least of which is due totheir choice of vendor. Companies that select the right ERP software and address issues properly will improvetheir chances of completing a successful ERP project on time and on budget.Panorama Consulting Group offers independent ERP software selection and implementation expertise andtools to reduce the total cost of ERP implementation and optimize measurable business benefits. On average,Panorama clients implement their ERP packages in 10% less time and at 50% less cost than they wouldwithout our guidance. For more information about our proprietary tools, industry expertise and ongoinganalyses, please visit our web site at www.panorama-consulting.com.Copyright 2010 Panorama Consulting Group2 0 1 0 E R P R e p o r t - E R P Ve n d o r A n a l y s i sP a g e 11
About Panorama Consulting GroupFounded in 2005, Panorama Consulting Group is a niche consulting firm specializing in the enterpriseresource planning (ERP) market for mid-sized companies across the globe. Independent of affiliation,Panorama helps firms evaluate and select ERP software, manages the implementation of the software, andfacilitates all related organizational changes to assure that each of its clients realizes the full business benefitsof its ERP implementation.Panorama’s expertise focuses on three service offerings: ERP software selection ERP implementation ERP organizational change managementMore information can be found on its web site, www.panorama-consulting.com. Contact Panorama at303-256-6253 or info@panorama-consulting.com.Copyright 2010 Panorama Consulting Group2 0 1 0 E R P R e p o r t - E R P Ve n d o r A n a l y s i sP a g e 12
Tier I ERP Packages Have the Lengthiest Implementation Durations According to the 2010 ERP Report published by Panorama Consulting Group in February (available online at www.panorama-consulting.com), many companies have unrealistic expectations about the duration time of their ERP implementations. The implementation process involves numerous steps, including process design,