Transcription
Integration of IT-DB Monitoringtools into IT GeneralNotification InfrastructureAugust 2014Author:Binathi BingiSupervisor:David Collados PoliduraCERN openlab Summer Student Report 20141
Project SpecificationThe goal of this openlab summer student project was to standardize the servicenotification and alarming system in the IT Database group. For this we need to integratethe IT General Notification Infrastructure (GNI) into some of our database services, likefor instance, RACMon, Enterprise Manager, Syscontrol, RMAN, Database on Demand,and Storage Administrators' tools. The objective was to make the GNI service our onlymechanism to generate notifications and alarms (SMS, email, SNOW tickets) and asunique interface to visualize notifications.AbstractThe IT Database group has independent monitoring tools/data and is immersed in aprocess of consolidating its monitoring infrastructure. The aim of this document is toprovide insight into the way we achieved integration of GNI into our databaseservices.2
Table of ContentsProject Specification . .2Abstract . .21Introduction . . . . 41.1 Database Monitoring tools . .41.2 GNI and SNOW .41.3 Kibana . 42Consolidation of IT-DB monitoring . . . . . .52.1 Input . . 52.2 DB notifier Producer . .62.3 Messaging Broker . . . 102.4 Output . 113Visualizations . . 114Conclusion . 145Future Proposals . . .156Bibliography . . 153
1 IntroductionThe IT Monitoring team is working to provide monitoring solutions in different areas.Notifications: To get notified about problems affecting our services or nodes.Archive: To archive data for offline batch analysis or historical reference.Dashboards: To visualize monitoring data based on real time analysis.To deliver successful monitoring solutions it is important to continuously monitor the status of allresources (network equipment, physical machines, virtual machines, operating systems,application services, etc.), to efficiently process all collected data, to promptly deliver monitoringresults (notifications, alarms, reports, etc.) to the appropriate target, and to have the capability ofexecuting complex queries across distinct monitoring data sets.The IT-Database (IT-DB) group is in a process of consolidating the entire monitoringinfrastructure. As a part of it we created a single mechanism (DB notifier Producer) to generatenotifications and alarms. We adopted a single interface Kibana, to visualize the monitoring data.Our goal was to stop sending notifications in the form of emails as much as possible andautomate the opening of SNOW (Service Now) tickets for certain critical events.1.1 Database monitoring toolsIn IT-DB there are independent monitoring tools like Oracle Enterprise Manager (OEM),Syscontrol, RACMon, Lightweight monitoring tools, monitoring data/scripts for middlewaretools like Syscontrol, or for other services like Storage, Backups, Recoveries, etc. These multiplemonitoring applications are deployed for monitoring the status of specific resources. These wereindependent tools based on different tool chains. Despite their heterogeneity, they all shared asimilar architecture and faced the same limitations, leading to unnecessary duplication of effortand increased difficulties in sharing monitoring data.1.2 GNI and SNOWGNI is a notification layer composed of several components responsible for dispatching alarmstriggered in each data centre node to multiple operations tools. Different from other tools, GNIrelies on dedicated transport layer, based on messaging brokers. Different producers publishnotifications to the messaging infrastructure, which are taken by two consumers: one which createstickets (SNOW tickets) in the CERN central ticketing system [1], while the second consumerpopulates a web application (Kibana) [2] showing current notifications.1.3 KibanaKibana is a browser based analytics and search interface for Elasticsearch that was developedprimarily to view Logstash event data. It is used by IT monitoring to visualize monitoringdata in real time. Kibana is user friendly dashboard and can be configured to display data asper the user requirements. It facilitates query on the monitoring data and also to save thedashboards.4
2. Consolidation of IT-DB monitoringDB-notifier ProducerIn the process of consolidation of monitoring tools, we created a DB-notifier producer whichwould take messages in a specific format as input from the monitoring tools to generatenotifications. These notifications are sent to the messaging broker in the cloud. Further, thenotifications are forwarded to the consumers like GNI and SNOW depending on the type ofnotification.2.1 InputDB notifier Producer takes two arguments as input.Messages: In the form of key value pair.Configuration file: configuration files of monitoring tools generating the message.Messages from Syscontrol monitoring tool are in the form of key value pair as shown below:Feb1216:15:37itrac1111SYSCONTROL LOGGER[23286]: V:002 BEGIN REMOTE:17837630655748 USER LOCAL:sysctl CMD:ssh USER REMOTE:sysctl HOST:dbsrvg3301 SCRIPT:/etc/init.d/syscontrol SINGLE:single SUSPEND: RUN AS RE5
MOTE: IGNORE ACTIVE: TAG:tagenable printers DELAY: DELAY VAL: SILENT:very silent HOST:dbsrvg3301 ENTITY:enable printers OPS:start ARGS: APPLY PROFILE: DB notifier Producer facilitates an option to provide either individual message or a log file ofmessages as input. Monitoring tools like OEM, RACMon generate messages in text format. Wewrote a shell script that would consume these text messages and generate the message in requiredkey value pair format. Whenever there is an event triggered in the monitoring tool, it would makea call to the shell script. The script would consume the text message, generate output in properformat and pass it as input to the DB notifier producer.The second argument passed to DB notifier is the configuration file of the monitoring tool. Wehad written configuration files for each monitoring tool in IT-DB, these are passed as argument tothe DB notifier producer.Example: Configuration file of the Syscontrol monitoring tool[configuration]destination dir tmp/teststomp[header]VersionTypedesenvhost groupproducersnow notifier devphysicsdb/pdbbackupdbnotifier syscontrol12.2 DB notifier ProducerDB notifier producer is a python script that takes the configuration file of the monitoring tool andoutput of the shell script as input to generate a JSON(JavaScript Object Notation) file of thenotifications. The notification specification [3] given by IT Monitoring must be followed in orderfor the GNI to accept the notification.Message structure:{"header":{ . },"body":"{"payload": { . },"metadata": { . }}"}6
Notification specification mandates the inclusion of certain fields in the header and body ofthe messages as specified below. Current version of notification specification is v2.0Header tags:TAGm versionm typeMANDATORY TYPEDESCRIPTIONyesstring version of message specificationyesstring type of messageidentifier of the application producingm produceryesstring messagesm submitter environment yesstring environment of the submitter hostm submitter hostgroup yesstring cluster of the submitter hostm submitter hostyesstring submitter hostm toplevel hostgroupnostring top level hostgroup of the source hostm snownostring enable or disable snow ticketsdestinationnostring destination of the message (necessaryfor the stompclt)Body/Metadata tags:TAGMANDATORY TYPEtimestampyesintuuidmetric idmetric upenvironmentnonostringstringis essentialasset idnonostringstringdescriptionnostringnotification typenostring7DESCRIPTIONtime when the event occurred (secondssince epoch)unique message identifiermetric idmetric namesource hosthostgroup of the source host (snowdefaults to NO HOSTGROUP)environment of the source hostis essential flag of the source host (snowdefaults to "0")identifier of the source machinedetailed description of the notification,used in the SNOW title of the INC(defaults to "no description provided" insnow)type of the notification (os, app, hw, nc)
statenovaliditynoegroup namenofe namenotroubleshootingnosnow assignment level nostring local state of the notification: open,close, *notification validity in hours (defaultint24h)string egroup responsible for entitystring name of functional element to send snowticketurl or comment for troubleshootingstring informationassigment level to created Snow ticket,intdefaults to 2boolean to request or not grouping ofticket in snow based on hostgroup andstring metric name over a 1hour period,defaults to "1"snow groupingnosnow instancenosnow display valuenostring the CERN snow instance: cern, cerndev,cerntest, cernsandoxthe incident number of the record instring snowsnow idnostring sys id of already created snow ticket(event record)Body/Payload tags:TAG*MANDATORYTYPEno*DESCRIPTION*General format for a custom notification producer:#/usr/bin/pythonfrom monitoringdatamodel.gni import Notificationfrom monitoringdatamodel import utilsfrom messaging.message import Messagefrom messaging.queue.dqs import DQSimport timeimport socketif name " main ":# Local path to send message so stomp client can consume it8
mq DQS(path "/tmp/test")# You can see the complete specification of a notification in:my notification header {'m type': 'notification','m version': '2.0','m producer': 'mycustomscript','m submitter environment': 'qa','m submitter hostgroup': 'aimon/my/host/group','m submitter host': socket.gethostname(),'destination': '/topic/monitoring.notification.generic'}my payload {"MyValues": [1, 2, 3],"custom": "field"}my notification body {'payload': my payload,'metadata': {'metric id': 123456,'metric name': 'my big problem alarm','entity': 'my little machine','timestamp': int(time.time()),'destination': '/topic/monitoring.lemon.notification','uuid': utils.generate uuid(),}}notif Notification({'header': my notification header,'body': my notification body})# We send the message to the queue directorymq.add message(notif.to message())9
The above producer has certain dependencies:Monitoring-data-model: to build valid notifications[4].python-messaging: for writing in the notifications queue of the broker[5].stompclt: necessary dependency to send message to the messaging broker[6].These dependencies are Red Hat Linux6 dependent rpms and can be installed using yum.yes yum install stompclt monitoring-data-model python-messagingNow, we have a single notification producer for all the monitoring tools/data in IT-DB. Theoutput of the notifier is sent to the messaging brokers using client that uses STOMP protocol.2.3 Messaging Brokerstompclt is a versatile tool to interact with messaging brokers speaking STOMP and/or messagequeues on disk. It receives messages from an incoming module, optionally massaging them (i.e.filtering and/or modifying), and sends them to an outgoing module. Depending on whichmodules are used, the tool can perform different operations.Here are the supported incoming modules: broker: connect to a messaging broker using STOMP, subscribe to one or moredestinations and receive the messages sent by the broker queue: read messages from a message queue on diskHere are the supported outgoing modules: broker: connect to a messaging broker using STOMP and send the messages queue: store the messages in a message queue on disk In our case, stompclt is the messaging broker that forwards the JSON files from the DB notifierProducer to the GNI. stompclt must be configured to the incoming queue path and is done in thestompclt-notifications.conf file.Certain credentials are needed to access stompclt. They are configured in the stompclt-auth.conffile.2.4 OutputJSON format files are forwarded from the messaging brokers to the GNI Dashboards by a client.10
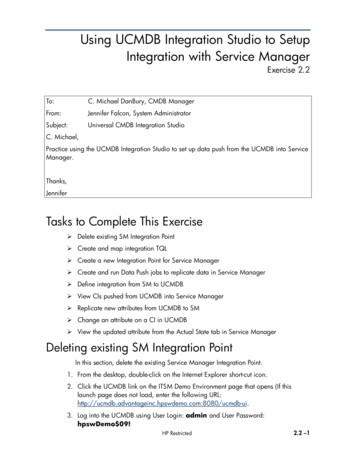
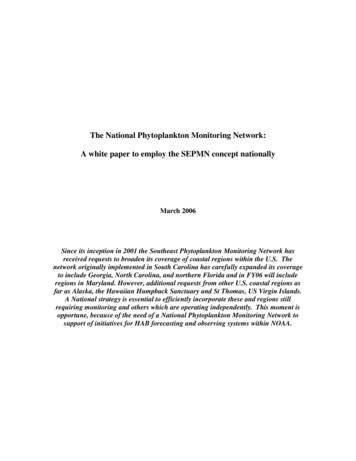
Now, we can visualize the notification data in real time and perform query on it. In addition,generation of automatic SNOW tickets is facilitated for critical events.3. VisualizationsKibana interface is used for visualization of data. We can login into dashboard to see, create andquery on the monitoring data generated by IT-DB production monitoring tools.The previous notification system was in the form of emails. In November 2013, we receivedalmost 6638 emails, approximately 221 emails per day. It was very difficult to share or query themonitoring data using the previous notification system.DB notifier Producer has facilitated us to make use of the dashboards to visualize notificationsrather than receiving them in form of emails.11
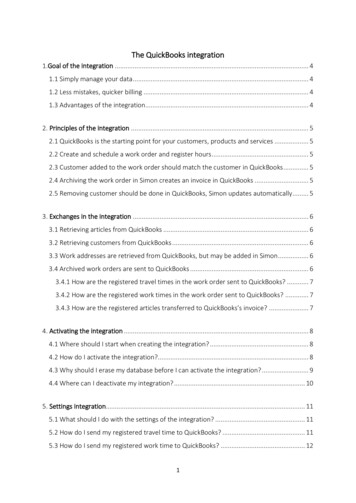
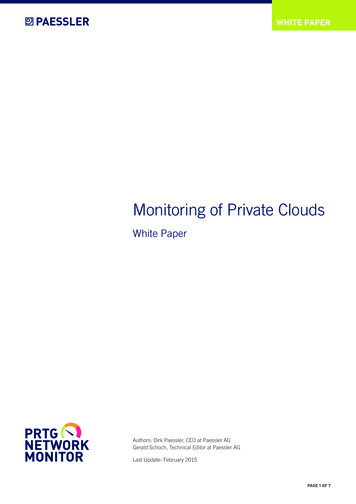
Kibana interfaceMany dashboards are available on Kibana. GNI dashboard can be loaded onto the Kibana.GNI Dashboard12
Dashboards also display various fields regarding each event. It is possible to choose the fields tobe displayed for each event and query using the value of the fields.We can also query for top host groups or producers, etc. as per the requirement and configurehow the result of our query would be displayed (either in the form of tables, or graphs likehistograms, pie charts, etc.).13
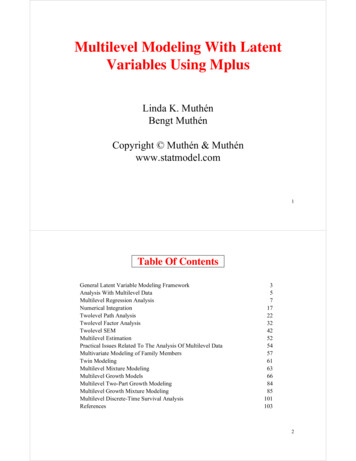
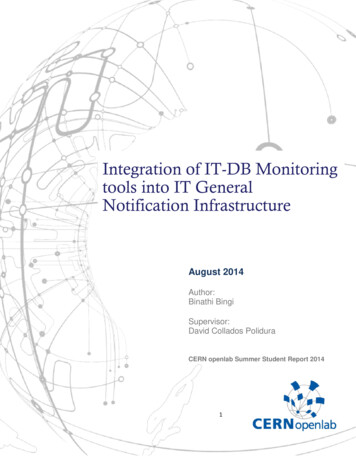
For example if we run a query for top producers on GNI dashboard and configure to displayresult in the form of a pie chart. Clicking on any of the sectors of the pie chart would display theconcerned notification data.4. ConclusionThrough this project we achievedSingle IT-DB producer: DB notifier Producer that we developed is the single notificationproducer for all the IT monitoring tools in IT-Databases. It is easy to maintain and run samenotifier in all the production monitoring machines.Visualize and query monitoring data: Display of data on Kibana interface facilitatesvisualization of data in the form of graphs and tables. It is easy to query or filter the monitoringdata using the tools available on Kibana.Configure and display monitoring data: Dashboards can be configured to display themonitoring data that interests the user. These dashboards can be saved and then shared, importedor exported.Email notifications: We could stop global email notifications to a considerable level by puttingDB notifier Producer into production. Events, alerts, etc. are displayed on the dashboards ratherthan sending them in the form of emails to the group users.SNOW tickets: Automatic Service NOW tickets can be opened for events or alerts that arecritical enough.14
5. Future ProposalsAt present, production monitoring machines (db-manager, oem.cern.ch, etc.) run on RedHatLinux5. DB notifier Producer that we developed has RedHat Linux6 dependencies. Servers needto be migrated to RedHat Liux6 in order to bring DB notifier Producer into production. We alsoneed to identify the messages that should generate SNOW tickets and put it into production.Currently we integrated Syscontrol, OEM into GNI and are working on RACMon. We canfurther add more IT-DB monitoring tools into GNI.6. -portal/2.https://dashboards.cern.ch/public/ 6. http://mig.web.cern.ch/mig/doc/stompclt.html15
query on the monitoring data generated by IT-DB production monitoring tools. The previous notification system was in the form of emails. In November 2013, we received almost 6638 emails, approximately 221 emails per day. It was very difficult to share or query the monitoring data using the previous notification system.