Transcription
Inclusionary Housingin the United StatesPrevalence, Practices, and Production in Local Jurisdictions as of 2019Ruoniu Wang, Ph.D.Grounded Solutions NetworkSowmya BalachandranUniversity of Illinois at Urbana ChampaignContact Grounded Solutions Networkwith questions or requests forpermission to reprint this paperat info@GroundedSolutions.org
Table of ContentsAbout the Authors. 3About Grounded Solutions Network. 3Acknowledgements. 4Executive Summary. 5Introduction and Background. 8Data and Methodology.10IH Definition and Scope.10Questionnaire Design and Variations.12Administration of Data Collection.12Data Limitations.14Findings.15Distribution and Growth.15Program Count by State.15Program Count by Government Type.17Program Count by Area Coverage.18Program Adoption by Decade.19Program Amendment.20Practices.21Traditional IH Programs.23Linkage/Impact Fee Programs.38Outcomes.44Units.44Fee Revenue.47Discussion.48Comparison With the 2016 Survey.48Discussion of Key Findings and Recommendations.49Conclusion.51References.52 2021 Grounded Solutions Network Inclusionary Housing in the United StatesPage 2
About the AuthorsRuoniu (Vince) Wang, Ph.D., is the research managerat Grounded Solutions Network, where he leads theeffort of tracking the scope, trends, and impacts ofinclusionary housing and shared equity homeownershipprograms. Previously, Vince worked at the ShimbergCenter for Housing Studies at the University of Florida,where he received a master’s and doctorate in urbanand regional planning.Sowmya Balachandran is a Ph.D. candidate in theDepartment of Urban and Regional Planning at theUniversity of Illinois at Urbana Champaign. Her researchlies at the intersection of housing policy, communitydevelopment, and social justice in planning.About Grounded Solutions NetworkGrounded Solutions Network supports strong communitiesfrom the ground up. We are a national nonprofitmembership organization consisting of community landtrusts, inclusionary housing programs, and nonprofits thatsupport affordable housing that lasts. We provide ourmembers and cities with training, technical assistance,program design and management resources, research,and advocacy. Grounded Solutions Network championsevidence-based policies and strategies that work. Wepromote housing solutions that will stay affordable forgenerations, so communities can stabilize and strengthentheir foundation, for good. We help our members, partners,and elected officials use them to establish inclusivecommunities that have diverse housing options for avariety of incomes, offering choice and opportunity for allresidents — both today and for future generations. 2021 Grounded Solutions Network Inclusionary Housing in the United StatesPage 3
AcknowledgementsWe are extremely grateful to government staff whogenerously contributed their time and knowledge incompleting the survey.We owe a huge debt of gratitude to the research teamfrom partnering organizations who did tremendouswork and successfully collected data for this projectin their respective states, including Katharine (Katy)Lacy, Calandra (Callie) Clark, Phillip (Phil) Crean, andLayheab Ly from the Massachusetts Housing Partnership(MHP); Pedro Galvao and Anna Blumstein from theNon-Profit Housing Association of Northern California;Rob Wiener and Luisa Café Figueiredo Facanha fromthe California Coalition for Rural Housing; and MosesGates and Arvind Sindhwani from the Regional PlanAssociation.We greatly appreciate all state and regional inclusionaryhousing experts who have shared their experience andknowledge with us in respective areas, especially AdamGordon at Fair Share Housing Center in New Jersey, AshonNesbitt at Florida Housing Coalition, and Mike Stanger atA Regional Coalition for Housing (ARCH) in Washington.We gratefully acknowledge the support of our currentand former colleagues at Grounded Solutions Network,particularly Adam Abraham, Amanda Bennett, BrandonFrazier, Emily Thaden, Hong Ly, Larry Rose, Matt Weber,Namon Freeman, Rachel Silver, Sasha Hauswald, andStephanie Reyes. We are also extremely thankful tocurrent and former colleagues at Fannie Mae who havesupported this study, including Angela Kelcher, BobSimpson, Crystal Bergemann, Kim Betancourt, Mark Palim,Nathan Shultz, Rita Ballesteros, and Tatyana Zahalak.This work1 was made possible through a servicesagreement with Fannie Mae in furtherance of FannieMae’s Duty to Serve initiative. For more information ofFannie Mae’s Duty to Serve initiative see fanniemae.com“Duty to Serve: Housing affordability is at the core of ourmission” pages here2.About Fannie Mae: Fannie Mae serves the peoplewho house America. Fannie Mae is a leading sourceof capital for mortgage lenders, providing liquidity,stability, and affordability to the single-family andmultifamily markets in a disciplined fashion whilemaintaining our credit standards and minimizing losses.This financing makes sustainable homeownershipand affordable rental housing a reality for millions ofAmericans. In the Multifamily business segment, FannieMae provides financing for multifamily developmentsthat include local programs to preserve affordablehousing and stimulate new affordable rental supply.Multifamily developments that include local programsare required to undergo additional due diligence toensure certain requirements are met, including thata sufficient share of the rental homes financed meetaffordability requirements and that third-party deedrestrictions guaranteeing affordability are in place.In the Single-Family business segment, Fannie Maeprovides a range of mortgage programs to makehomeownership affordable and accessible to low- andmoderate-income households, including financing forthe purchase of shared equity homeownership units thatresult from inclusionary housing programs1The views expressed in this paper are those of the authors only and not those of the contributors listed above or their respective -we-do/homeownership/duty-serve 2021 Grounded Solutions Network Inclusionary Housing in the United StatesPage 4
Executive SummaryInclusionary housing (IH) ties the creation of affordable, below-market-rate units with new development, and it is a meansfor creating affordable housing and inclusive communities. Yet, limited research circumscribes our understanding about thesimilarities and variations of inclusionary housing programs across the nation. To this end, Grounded Solutions Network embarkedon a large-scale data collection effort between 2018 and 2019 to study inclusionary housing programs in local jurisdictions. Thisreport summarizes patterns and trends in inclusionary programs, which not only shed light on previously un-examined programfeatures and administrative aspects, but also reinforce existing knowledge with a much greater number of programs. The term“inclusionary housing program” (as opposed to “inclusionary zoning policy”) is used to include a comprehensive coverage ofmarket-based affordable housing solutions that go beyond legislative provisions. Highlights of this study include:Count of the nation’s localinclusionary housing programsPrograms aregrowing and evolvingThis study identifies a total of 1,019 inclusionary housingprograms in 734 jurisdictions at the end of 2019. Theseprograms are in 31 states and the District of Columbia.Nearly three-quarters of programs are in New Jersey (28%),Massachusetts (23%), and California (22%), all of whichhave statewide mandates. These new counts are based on acomprehensive data collection strategy, including a thoroughmunicipality by municipality identification of inclusionaryhousing programs in New Jersey and Massachusetts.Inclusionary housing programs are growing substantiallywith an annual average growth rate of 19 programsbetween 2011 and 2019. This growth trend followeda spike of program expansions with an average of 33programs per year between 2003 and 2010. Meanwhile,the study finds that two out of five policies haveundergone significant legislative updates in the pastthree years, and one in five was under review when thesurvey was conducted in 2019.Renewed understandingof program outcomesPrograms hold their promise inaddressing local affordable housingneeds for low-income householdsA subset of 258 programs provided detailed informationabout outcomes. These programs report creating a totalof about 110,000 affordable units, including 70,000affordable rental units, 31,000 for-sale units, and 9,000units with tenure unknown. For the 221 programs thatreport at least one affordable unit and with knownprogram age, a program produced 27 affordable unitsper year on average. In addition, 123 of the programssurveyed tracked and reported fees collected throughtheir inclusionary housing programs (including linkage/impact fee programs). In total, this subset of inclusionaryprograms has collected at least 1.76 billion in fees.The average set-aside for affordable units is 16% and29% of IH programs require 20% or more of housingunits to be set aside at affordable prices on-site. Theseaffordable units predominantly serve low-incomehouseholds with annual incomes between 50% and80% of area median income (AMI). Rental inclusionaryhousing programs generally serve lower income levelsthan homeownership programs. Many programs providedeeper affordability by requiring affordable unitscreated to be allocated across multiple income tiers,and/or offering developers different options to servelower-income residents. 2021 Grounded Solutions Network Inclusionary Housing in the United StatesPage 5
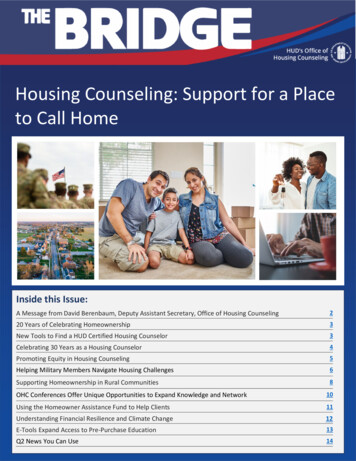
Most units created throughinclusionary housing programshave long-term affordabilityThe survey found that 93% of programs haveaffordability requirements that last for 30 yearsor longer. It is a common practice for programs torestart the affordability term upon resale, whichprovides another layer of affordability insurance.Most homeownership programs are using sharedequity homeownership models, whereby resalerestrictions apply to subsequent homeowners inorder to keep property permanently affordable.Tracking of Affordable UnitsRemains InconsistentThere remains a big gap in the literature in unveiling theadministrative practices of IH programs. While aboutone-third of local governments reported partneringwith external agencies to manage IH programs, wefind that many programs report either not having atracking system in place or not knowing if such a systemexists. In addition, except for a rather limited numberof programs, we do not know in which neighborhoodsthe affordable units are located, the socio-demographiccharacteristics of participating households, ortransaction/lease details for units.Considerable variations in termsof program design and outcomesexist across statesStates that mandate inclusionary housing showprogrammatic similarity within those states,but not necessarily across states. Programs inCalifornia, Massachusetts, and New Jersey revealdistinct patterns within each state, especially interms of program type (mandatory or voluntary),income targeting requirement,and affordability term.While state mandatescertainly are helpful forwidespread adoption oflocal inclusionary housingprograms, programs aremore productive if theyare designed in ways toaddress local affordablehousing needs. 2021 Grounded Solutions Network Inclusionary Housing in the United StatesPage 6
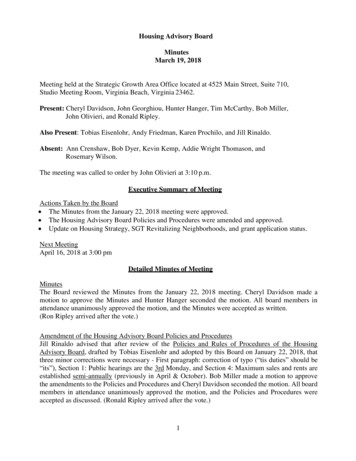
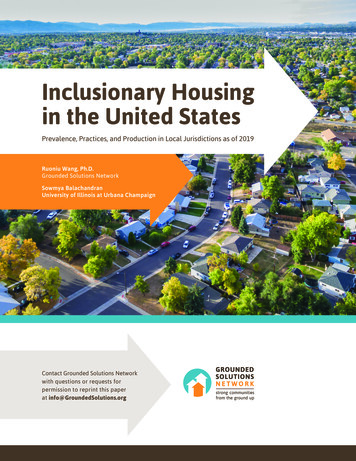
inclusionaryhousing.org/mapIn conjunction with this working paper, Grounded SolutionsNetwork created a webpage (inclusionaryhousing.org/map)which provides program level information based on surveyresponses. This webpage also enables users to visualizethe distribution of IH programs across the country, andit allows people to download the database used in thisstudy. The webpage also provides a channel for programadministrators to report new and/or amended IH programs,as well as to populate missing and incorrect information.Location of inclusionary housing programs in United States 2021 Grounded Solutions Network Inclusionary Housing in the United StatesPage 7
Inclusionary Housing in the United States:Prevalence, Practices, and Production in Local Jurisdictions as of 2019Introduction and BackgroundAcross the United States, conscious efforts to segregatecommunities by race and income have resulted in harmfulconsequences for individuals and families by subjectingthem to unhealthy housing and neighborhoods, reducingaccess to education and employment opportunities, andlimiting social relationships (Rothstein, 2017). Duringan era of inadequate federal resources for affordablehousing, inclusionary housing (IH) policies have begun toplay an increasingly strategic role in increased affordablehousing production. When designed appropriately, IHalso has the potential to promote residential integrationby tying affordable housing to market-rate housingdevelopment. In their simplest form, IH policies requiremarket-rate developers to sell or rent a portion of theirnew units at below-market rates to income-qualifiedhouseholds. Among other purposes, IH policies are oftenadopted in municipalities as a reaction to exclusionaryzoning, which Merriam-Webster defines as “a residentialzoning plan whose requirements (as minimum lot sizeand house size) have the effect of excluding low-incomeresidents.” Exclusionary zoning is considered a racist andclassist practice that keeps away people and developmentdeemed undesirable in higher-income neighborhoods(Jacobus, 2015; Whitehead and Williams-Derry, 2014).As a local housing policy, great variation exists in termsof IH policy structure and program administration. Yetthe scarce empirical studies on the effectiveness of IHpolicy design and implementation have consistentlyfocused on the same few programs. What is missing tosupport further understanding and investigation is anationwide database that documents the prevalence,practices, and impact in the field.3In 2016, Grounded Solutions Network, in partnershipwith Lincoln Institute of Land Policy, conducted a nationalsurvey of IH programs located in 25 states and the Districtof Columbia. This survey resulted in a 2017 working paperon IH programs (Thaden and Wang 2017). It was themost comprehensive study up until our recent efforts.Subsequently, as part of services provided to Fannie Mae,Grounded Solutions Network created the first nationwideinclusionary housing map,3 a web-based interactive toolfeaturing programmatic details of the entire IH dataset,as well as displaying a state-by-state legal framework forlocal IH programs. The database behind the map may bedownloaded to generate further research.The 2016 survey, while pioneering in understandingthe impact of the nation’s IH policies and programs,had certain limitations. Specifically, survey responsescame from only a small portion of programs. We werenot able to identify all inclusionary programs in alljurisdictions with IH programs, because the overallsurvey response rate was low. This limitation preventedus from collecting comprehensive data on impact andprogram characteristics for the majority of programs. Inparticular, the study estimated that a substantial numberof IH policies and programs were missed in states such asNew Hampshire, Connecticut, and New York. In addition,the research barely collected any local programmaticinformation in Massachusetts and New Jersey, whichtogether accounted for over half of all programs in thenation. Instead, estimates for jurisdictions with IH policiesand programs and their impact in these two states werederived from data provided by state agencies. This dataThe inclusionary housing map is updated with data from this study. 2021 Grounded Solutions Network Inclusionary Housing in the United StatesPage 8
included policies and programs that fell outside of theIH definition used in the 2016 study, resulting in anoverestimation of the number of IH policies and programsas well as the units/fees generated.Since the publication of the 2017 working paper, many newIH programs have emerged, including those in the majorcities of Atlanta, Georgia; Portland, Oregon; Minneapolis,Minnesota; and Detroit, Michigan. In addition, some stateshave enacted new policies that either support or impedethe adoption of local IH programs. Notably, in California,the passage of Assembly Bill 1505 in 2017 (also known as“Palmer Fix” bill) returns power to counties and cities toimplement IH on rental projects.Increasing demand for better data by practitioners andnational partners, coupled with emerging trends in the IHlandscape, propelled us to plan for a new round of datacollection. Under a services agreement with Fannie Mae toinitiate and conduct this research, the project commencedin 2018. The goal of this study is to build a national IHdatabase to better understand the geographies, types,characteristics, outcomes, and trends of IH programs.This study employs a refined data collection strategycompared to Grounded Solutions Network’s 2016 effort,and the new strategy results in a substantially improveddataset. We partnered with four state and regionalaffordable housing organizations to collect data in fivestates with large concentrations of IH programs. Ourresearch partners helped create different versions ofsurvey questionnaires that were tailored to regionalconditions, conducted extensive ordinance reviews, andadministered surveys. We used a dual data collectionapproach — ordinance review and survey administration— for all jurisdictions identified with an IH program,followed by thorough data validation and cleaning, tocollect as much information as possible and to minimizebiases that may occur during the data collection process.The result of this extensive effort is a new IH datasetthat comprehensively tracks policy details for all 1,019programs identified in the study.The terms “inclusionary housing programs” and“inclusionary housing/zoning policies” are often usedinterchangeably in the literature. In this study, we preferthe former term over the latter for two reasons. First,although in most cases inclusionary housing is part of azoning ordinance or bylaw, based on our data collectionapproach we find that, occasionally, it may not bearticulated in legislation. For example, the inclusionarydevelopment policy in Boston, Massachusetts, was createdthrough an executive order of the mayor. The term“program” intends to broadly capture local governmentinterventions that are beyond legislative provisions.Second, we intend to use the term “program” to capturesome aspects of policy implementation and administration— such as compliance, monitoring, and outcome tracking— that is often not written in the ordinance.This report proceeds as follows. The next section includesthe data collection method and process. In the sectionthat follows, we present findings which include programdistribution, growth, practices, and outcomes. The reportconcludes with a comparison of key findings between theprevious study and the current study. 2021 Grounded Solutions Network Inclusionary Housing in the United StatesPage 9
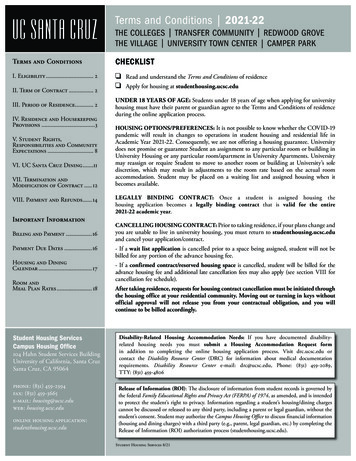
Data and MethodologyIH Definition and ScopeInclusionary housing (IH) programs vary widely informs and applications. Consequently, definitions ofinclusionary housing are equally diverse in scholarship.In this study, we use a relatively broad definition tocapture various forms of IH. Specifically, an “inclusionaryhousing program” is referred to as “a set of local rulesor a local government initiative that encourages orrequires the creation of affordable housing units, orthe payment of fees for affordable housing investmentswhen new development occurs.”We use this definition to capture IH policies or programsin local jurisdictions that are either mandatory orvoluntary in yielding affordable units on-site withinmarket-rate buildings, affordable housing units offsite in a different location, or payments in-lieu ofdevelopment (collectively referred to in this studyas “traditional IH programs”). This definition alsocaptures policies or programs that generate fees for thedevelopment of affordable housing from commercialdevelopment, residential development, or both (thesetypes of programs are called “linkage/impact feeprograms” in this study).In essence, we broaden the IH definition by capturingthe intent of the policy or program in one or more of thefollowing ways: 1) the policy or program was createdto increase affordable housing supply; 2) the policy orprogram was created to promote social and economicintegration; and/or 3) the policy or program was createdto incentivize any type of development as long as theunderlying policy or program ensures or includes anincrease in the local affordable housing stock.We also draw clear boundaries for policies and programsthat should not be included in this study. Policies orprograms which do not establish a maximum householdincome level (either or through connected policy orstate mandate) are excluded. Policies or programs whichdo not specify the affordability term of the affordablehousing units to be created are also excluded.In addition, we exclude policies or programs if theinclusion of affordable housing or the payment of a feefor affordable housing is a result of project-by-project,ad-hoc negotiations with developers. We also excludesite-specific inclusionary zoning policies in New Jerseythat require specific sites in the municipality to be zonedfor housing development with an affordable percentage,either because of a Mount Laurel/Fair Housing Actcompliance plan or otherwise. Furthermore, most statelevel policies that require or enable inclusionary housingare excluded from this study, including the density bonusprogram4 and inclusionary provisions of California SenateBill 355 in California, Chapter 40B6 in Massachusetts, andstate-mandated development fees on non-residentialdevelopment7 in New Jersey. One exception is New YorkState’s 421-a Tax Exemption program.8 Although this is astate-level policy, it only applies to New York City. Hence,we included it in the database.4The California State Density Bonus Law, under Section 65915 of the California Government Code, offers incentives including up to a 35% increasein densities that are intended to encourage the development of affordable housing. While California’s State Bonus density law has generallybeen excluded from this study, locally adopted programs based on the law with more stringent requirements have been included.5California Senate Bill 35 (SB 35) is a statute streamlining housing construction in California counties and cities that fail to build enough housingto meet state-mandated housing construction requirements.6Chapter 40B is a state statute of Massachusetts, which enables local Zoning Boards of Appeals to approve affordable housing developmentsunder flexible rules if at least 20 – 25% of the units have long-term affordability restrictions.7Pursuant to the Statewide Non-Residential Development Fee Act of New Jersey, municipalities are required to impose a non-residentialdevelopment fee of 2.5% of the equalized assessed value to address the state’s affordable housing needs. While New Jersey’s Statewide NonResidential Development Fee Act has generally been excluded from this study, locally adopted programs based on the act with more stringentrequirements have been included.8The 421-a tax exemption is a property tax exemption in the U.S. state of New York that is given to real estate developers for building newmultifamily residential housing buildings in New York City. The 421-a program began in 1971, and the state government later added provisions tomandate the creation of affordable housing units in order for developers to qualify for the program. 2021 Grounded Solutions Network Inclusionary Housing in the United StatesPage 10
Most state-level policies are excluded for three mainreasons. First, inclusionary housing programs are knownto be local responses,9 therefore state-level policies falloutside of the traditional scope of inclusionary housing.In addition, it is not feasible to accurately count localpolicies or programs that directly result from these statelevel policies, because local jurisdictions vary widely inwhether and how they incorporate such state law intolocal ordinances, despite all non-exempt developmentsin the state being technically subject to these state-levelpolicies (Goetz and Sakai, 2020). Lastly, there is no wayto comprehensively track unit/fee production resultingfrom these state-level policies. In California, there isno state-level tracking system for the state’s DensityBonus Law, and many local jurisdictions don’t track unitsproduced under such law. In Massachusetts and NewJersey, even though there are state-level tracking systemsfor affordable units (e.g. the Subsidized Housing Inventoryand Local Initiative Program in Massachusetts, and theHousing Trust Fund in New Jersey), units/fees created byIH programs that meet the definition of this study cannotbe identified in those databases.Although most state-level policies are excluded from thestudy, we include local IH programs adopted as a resultof Chapter 40R10 in Massachusetts, as well as municipalwide inclusionary zoning programs and residentialdevelopment fee programs adopted as part of the Councilon Affordable Housing (COAH) process in New Jersey.This is due to the fact that these programs are generallyuniform in how they are written into local ordinancesand are easier to identify. Lastly, local programs adoptedas the result of actual state level policies with morestringent requirements than the actual state level policiesare included in the dataset because they are easier toidentify in local ordinance (see Table 1).Table 1. Summary of Project ScopeIncludedOverallExcluded Traditional IH programs and linkage/impact fee programs. Policy/program that does not establish a maximum householdincome level. Mandatory and voluntaryprograms. Policy/program that does not specify the affordability term of theinclusionary units. Policy/program with inclusionary units resulting from ad-hocnegotiations with developers.California Locally adopted density bonus programsthat have more stringent requirementsthan the state mandate. The state’s density bonus program.Massachusetts Chapter 40R. Chapter 40B.New Jersey Municipal-wide inclusionary zoningprograms. State-mandated development fees on non-residential development. Residential development fee programs. Inclusionary provisions of California Senate Bill 35. Locally adopted density bonus programs that have the samerequirements as the state mandate. Site-specific inclusionary zoning policies as a result of MountLaurel/Fair Housing Act. Locally adopted development feeprograms on non-residential developmentthat have more stringent requirementsthan the state mandate.New York 421-a Tax Exemption program.9See here: ng-explained/what-is-inclusionary-housing/.10The California State Density Bonus Law, under Section 65915 of the California Government Code, offers incentives including up to a 35% increasein densities that are intended to encourage the development of affordable housing. While California’s State Bonus density law has generallybeen excluded from this study, locally adopted programs based on the law with more stringent requirements have been included. 2021 Grounded Solutions Network Inclusionary Housing in the United StatesPage 11
Questionnaire Design and VariationsThe IH survey questionnaire included two main parts.The first part collected jurisdictional information suchas government name, level, and address; the surveyrespondent’s contact information; and the number of IHprograms in the jurisdiction. The second part focused oninformation related to each IH program identified by theresearch team or survey respondents. If there were multipleprograms in an underlying jurisdiction, the survey respondentrepeated the second part multiple times in order to provideinformation about each program’s characteristics. Amongother things, information included year of adoption, yearof most recent amendment, and program geographiccoverage. For traditional IH programs, we further recordedprogram features, including program type (mandatory and/o
University of Illinois at Urbana Champaign. Inclusionary Housing. in the United States . Prevalence, Practices, and Production in Local Jurisdictions as of 2019. Contact Grounded Solutions Network with questions or requests for . permission to reprint this paper at . info@GroundedSolutions.org