Transcription
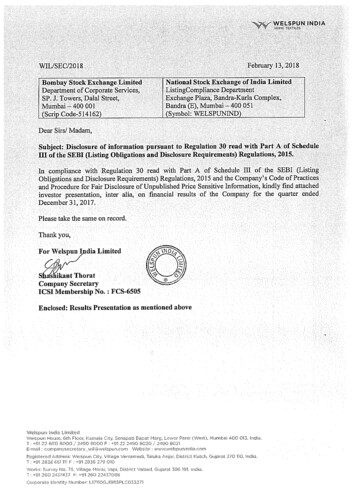
.,February13,201‘2‘‘Bombay Stock Exchange LimitedNational Stock Exchange of India Department of Corporate Services,SP. J.Towers, Dalal Street,Mumbai—-400 001Subject:ListingCompliance DepartmentExchange Plaza, Bandra—Kurla Complex,Bandra (E), Mumbai 400 051(Symbol: WELSPUNIND)—(Scrip Code—514162)Dear Sirs/LimitedMadam,pursuant to Regulation 30 read with Part A of Schedule(Listing Obligations and Disclosure Requirements) Regulations, 2015.Disclosure of informationHI of the SEBIcompliance with Regulation 30 read with Part A of Schedule III of the SEBI (ListingObligations and Disclosure Requirements) Regulations, 2015 and the Company’s Code of Practicesand Procedure for Fair Disclosure of Unpublished Price Sensitive Information, kindly find attachedinvestor presentation, inter alia, on financial results of the Company for the quarter endedInDecember31, 2017.Please take thesame onrecord.Thank you,ForWelspunsI dia Limitedikant ThoratCompany SecretaryMembership No.ICSIFCS-6505:Enclosed: Results PresentationWelspun indiaasmentioned aboveLimitedWelspim House, 6th Floor. liamaia City, Senapati Banal Marg, Lower Parei (West), Mumbai 400 013, india.T119122 6613 6000E-mail:/2490 8000 F: 9l 22 2490 8020companysecretaryiwii giwelspunromWebsiteRegistered Address: Welspun City. Village Versamedi,:/ 2490 BOZlwwwwelspunmdia‘comTalukaAniar, District Kutch. Gujai’a1370 HO, india.71 912836 661111 Fri-912836 279 010Works: Survey No. 76, Village- Morai, Vapi, District Vnisad, Gujarat', ‘90 260 21137437 F1 91260 22437088TCorporate Identity Number: L171106J1985PLC033271.396191, India.
INVESTOR PRESENTATIONFebruary 2018Owned BrandsInnovationsLicenses1
DISCLAIMERThe information contained in this presentation is provided by Welspun India Limited (the “Company”), although care has been taken to ensure that the information in thispresentation is accurate, and that the opinions expressed are fair and reasonable, the information is subject to change without notice, its accuracy, fairness or completeness is notguaranteed and has not been independently verified and no express or implied warranty is made thereto. You must make your own assessment of the relevance, accuracy andadequacy of the information contained in this presentation and must make such independent investigation as you may consider necessary or appropriate for such purpose. Neitherthe Company nor any of its directors assume any responsibility or liability for, the accuracy or completeness of, or any errors or omissions in, any information or opinions containedherein. Neither the Company nor any of its directors, officers, employees or affiliates nor any other person accepts any liability (in negligence, or otherwise) whatsoever for any losshowsoever arising from any use of this presentation or its contents or otherwise arising in connection therewith.The statements contained in this document speak only as at the date as of which they are made, and the Company expressly disclaims any obligation or undertaking tosupplement, amend or disseminate any updates or revisions to any statements contained herein to reflect any change in events, conditions or circumstances on which any suchstatements are based. By preparing this presentation, none of the Company, its management, and their respective advisers undertakes any obligation to provide the recipient withaccess to any additional information or to update this presentation or any additional information or to correct any inaccuracies in any such information which may become apparent.This document is for informational purposes and does not constitute or form part of a prospectus, a statement in lieu of a prospectus, an offering circular, offering memorandum, anadvertisement, and should not be construed as an offer to sell or issue or the solicitation of an offer or an offer document to buy or acquire or sell securities of the Company or anyof its subsidiaries or affiliates under the Companies Act, 2013, the Securities and Exchange Board of India (Issue of Capital and Disclosure Requirements) Regulations, 2009, bothas amended, or any applicable law in India or as an inducement to enter into investment activity. No part of this document should be considered as a recommendation that anyinvestor should subscribe to or purchase securities of the Company or any of its subsidiaries or affiliates and should not form the basis of, or be relied on in connection with, anycontract or commitment or investment decision whatsoever. This document is not financial, legal, tax, investment or other product advice.This presentation contains statements of future expectations and other forward-looking statements which involve risks and uncertainties. These statements include descriptionsregarding the intent, belief or current expectations of the Company or its officers with respect to the consolidated results of operations and financial condition, and future events andplans of the Company. These statements can be recognized by the use of words such as “expects,” “plans,” “will,” “estimates,” or words of similar meaning. Such forward-lookingstatements are not guarantees of future performance and actual results, performances or events may differ from those in the forward-looking statements as a result of variousfactors and assumptions. You are cautioned not to place undue reliance on these forward looking statements, which are based on the current view of the management of theCompany on future events. No assurance can be given that future events will occur, or that assumptions are correct. The Company does not assume any responsibility to amend,modify or revise any forward-looking statements, on the basis of any subsequent developments, information or events, or otherwise.Any reference herein to "the Company" shall mean Welspun India Limited, together with its consolidated subsidiaries.2
INTRODUCTION TO WELSPUN GROUPGlobal Leader inHome TextilesGlobal Leader inLarge Diameter PipesInfrastructureInvestments in Oil & GasGroup RevenueUS 2.3 BillionMarket CapUS 2.2 BillionEmployees25,000 3
1. Welspun India: An Introduction2. Industry OverviewAGENDA3. Welspun India: Key Differentiators4. Key Strategic Initiatives5. Welspun 2.0 & Way Forward4
WELSPUN INDIA:AGENDAAN INTRODUCTION5
WELSPUN INDIA: OVERVIEWLargestHome Textiles Company Globally(1)With presence inBed, Bath & FlooringPresence inRanked #1among Home Textile Suppliersto USAby Home & Textiles Today magazine for5th Year in a Row50 CountriesTrusted and Preferred Suppliers to17 of Top 30Every 5th TowelEvery 10th Sheetin the US is made by Welspun(2)Global Retail Giants27 Patents36% Sales: Innovative Products(3)16% Sales: Branded Products(3)3E’s of CorporateSocial ValueEducation, Environment & Health,EmpowermentNote: (1) Based on consolidated revenues from Home Textiles segment. (2) Based on OTEXA CY2017 data. (3) FY17 Figures6
KEY MILESTONES666053Revenues (Rs. Bn)CAGR 25%44(2005-17)3226160.8FY 198519931.319954.52005720062008Entry into RugsBegan thejourney inTextilesSet up Vapi, Gujaratfacility for TowelsSet up Anjar, GujaratfacilityEntry into bedsheetsAcquired Christy – mostprestigious brand oftowels in the UK20102012201420152016Ranked No.1 Home Embarked uponTextile exporter toCapacitythe USExpansion &VerticalIntegration2017Foray into:- Flooring Solutions- Smart TextilesIncreasing footprint inMiddle East, Japan,Australia, EULaunched: shopwelspun.com & .in Brand, SPUN globally ‘Hygro’ branding campaign in the USCommissioned India’s largest spinningfacility under one roof7
SHAREHOLDING AND TRADING SNAPSHOTShareholding PatternMarch 31, 2017Dec 31, %Mutual FundsBanks and Insurance CosPublic73.5%73.5%Market StatisticsAs on Dec 31, 2017INRUSDPrice per share71.151.11No of Shares outstanding (Mn)1,0051,005Market Capitalization (Mn)71,5061,120Daily Average Trading Volumes (Q3FY18) No of shares in Mn2.222.22Daily Average Trading Value (Q3FY18) (Mn)1552.44Source: BSE & NSE8
INDUSTRYAGENDA OVERVIEW9
ASIAN DOMINANCE IN HOME TEXTILESTextiles &ApparelTextilesIndia 5%US 744 bnChina 38%US 290 bnIndia 6%China 37%Home TextilesUS 45 bnIndia 11%China 35%Source: WTO - 2015 data, Texprocil, OTEXA10
GLOBAL MARKET OPPORTUNITYGlobal Home Textile MarketMarket Composition(USD Bn)203US 33%67136Wholesale Level45Retail LevelRow 33%Europe 33%20152020EUS Home Textile Market (2016)US Home Textile Marketvalued at c. 15 bn(USD Bn)COTTONPILLOWCASES, 0.4COTTON SHEETS, 1.5OTHER NONCOTTONPRODUCTS, 5.0 Indian Players have concentrated in US because:COTTON TOWELS, 1.6COTTONBEDSPREADS , 0.9OTHER COTTONPRODUCTS, 3.0Strong Presence of IndiaSource: OTEXA, Industry Reports US and Europe are the major end marketscomprising a third each of the home textile marketMMF FLOORCOVERINGS, 3.0 US is a large and homogenous market making ita more attractive market to target first While US is a level playing field, Europe providespreferential tariff rates to some competingcountriesNext Opportunity for India11
INDIA- LARGEST PLAYER IN US MARKETMarket Share in US Towel Market9 percentage 2015ChinaPakistanIndia24%23% 22%22%15%39%16%CY2016CY2017ROW23 percentage ptsMarket Share in US Sheet rce: OTEXA, Dec 2017 Update50%49%48%45%27%21%15%India continuesto dominate theUS TowelMarket21%13%CY2015China Pakistan15% 14%CY201620%15% 14%Half of the USSheet Market isServed by IndiaCY2017ROW12
FACTORS CONTRIBUTING INDIA’S COMPETITIVE ADVANTAGELargestProducer ofCotton4Strong PoliticalLeadershipwith Strong facturingScale13
WELSPUN INDIA:AGENDAKEYDIFFERENTIATORS14
WELSPUN INDIA: BELLWETHER IN HOME TEXTILES81Leading Market Playerwith a Wide ProductRangeConsistent FinancialPerformance Record72Experienced Board andManagement with ProvenTrack RecordVertically IntegratedPresence with SignificantCapabilities63Global DistributionNetwork with MarqueeClientsSustainability at the Coreof the Business54Track Record ofInnovationDiversified BrandPortfolio15
1 LEADING MARKET PLAYER WITH A WIDE PRODUCT RANGEWidest product range in the Home Textiles segmentTowels, BathRobeSheets, TOB, Basic& Fashion BeddingCarpets,RugsA differentiated End-to-end Solutions Provider in Home TextilesUniquely positioned for cross-selling due to Customer reach, Competitivemanufacturing, Global delivery modelHigher wallet share due to multi-product portfolioStrong track record of customer satisfaction and repeat business from them;80% revenue from replenishment16
1 LEADING MARKET PLAYERRanked No.1 supplier to the US for 2016 by Home & Textiles Today magazine; 5th year in a rowEvery 5th towel sold in US is made by WelspunEvery 10th sheet sold in US is made by Welspun10%19%15%CY137%CY17Welspun’s Market Share in US Towels MarketCY13CY17Welspun’s Market Share in US Sheets Market50%21%41%16%CY13CY17Welspun’s Share in India’s exports to US - TowelsSource: OTEXACY13CY17Welspun’s Share in India’s exports to US - Sheets17
2 VERTICALLY INTEGRATED PRESENCE WITH SIGNIFICANT CAPABILITIESIndia SupplyAdvantageVertically Integrated Facilities Across Manufacturing ChainCottonSpinningWeavingProcessingCutting & SewingLogisticsCaptive Power Current integration of about 70% in Spinning and Weaving Captive power generation (through thermal power plant) Welspun India’s backward integration have helped improve margins, better quality control and timely delivery FY17 Effective Utilisation:Growing CapabilitiesTowels : 97%Towels (‘000 MT)Bed Linens (‘Mn mtrs)728060459050Rugs & Carpets (‘Mn sq. mtrs)90Rugs7255Sheets : 86%106081086: 85% Investment of aroundRs. 4.5 bn planned in FY18 Expansion of Towelcapacity & new flooringFY14 FY15 FY16 FY17 FY18EFY14 FY15 FY16 FY17 FY18EFY14 FY15 FY16 FY17 FY18Esolutions to be focus18
3 GLOBAL DISTRIBUTION NETWORK WITH MARQUEE CLIENTSWarehousesManufacturing FacilityCorp HQ/Marketing OfficesCountry ServedDelivery and Reach in Over 50 Countries19
4 DIVERSIFIED BRAND PORTFOLIOSpectrum of Welspun Brands: Continue to EvolvePremium &LuxuryInnovationSustainability &EmpowermentTechnologyCoveted LicensesBranded Products Contribution to Sales at 16% in FY17, up from 13% in FY1620
5 TRACK RECORD OF INNOVATIONIncreasing Share of Revenue 36% of Sales from Innovative Products 27 unique inventions filed globallyInnovative Products36%34%30% Crossed 200 Mn Sales in FY17 Good traction in hospitality & domestic marketFY15FY16FY17The two segments (innovative & branded) together account forc. 40% of revenueHYGRO Cotton Received Asthma and Allergy Free Certificationfor bedding products in US post stringent testingTop UniversitiesGlobalCollaborationon Innovationbefore washingafter 3 washingsRegulates temperature for individual comfortTechnology PartnersIndustry Associations21
6 SUSTAINABILITY: FOCUS ON THE 3Es Quality Education Project Adult Literacy Education for womenEducation3Es ofCorporateSocialValueEnvironment &HealthEmpowerment Vocation Centers: 10 centers including SPUN 351 women trained and 239 women employed inWelspun during the quarter Walmart’s SWASTI foundation for WomenEmpowerment and Training: Successfullytrained 2,335 women in foundation-level and 519women in advanced level courseEducationEmpowerment Welspun Vidya Mandir at Anjar: qualityeducation to 1,600 students with 75 Teachers Quality Education Project at 41 governmentschools in Anjar reaches out to over 10,000students. 45 para teachers deployed in 33 schools SMART class installed in 10 schools.Environment & Health Mobile Health Vans (MHV): Moving dispensarymanned by a qualified doctor, pharmacist and asocial worker. MHVs reach out to 19 villages with40,000 villagers benefitted. Health Camps 320K trees planted 1,500 toilets have been constructed in 18 villages Rain water harvesting Blindness Control Program for elderly people 4,000 saplings planted during the quarter Sustainability Focus Health Camps & MobileMedical Vans Vocational Training forwomen and youth Natural/recycled products Employability22
6 INCLUSIVE GROWTH: IMPLEMENTING SMART VILLAGESE-Connectivity EssentialInfrastructure EnvironmentWi-fi enabled villages with CCTV coverageComplete E-governancePA system with speakersComprehensive CMS for Panchayat OfficeWell-constructed roads withkerbstonesDrainage and sewagedisposal systemsMobile libraryEducation Smart centresCCTV enabled premisesVocation training in secondary schoolsBio gas for cooking midday meals in school kitchen Green cover in all public landSegregation and organized disposal of garbage100% LED / solar street lightingSwachh Bharat Abhiyan awarenessWelspunSmartVillageEmpowerment Upgraded CSR and skill development centresE-enabled milk banksVocational training in skills like IT and sering100% enrolment of adults under Government schemes23
6 SUSTAINABILITY IN EVERYTHING THAT WE DOSTP Installed with a Capacity to Process 30 MN Liters Per Day; currently saving6,500 million Liters of Water annually85% Water Recovered From STP Used at Plant10,000 Youth Trained in FY17 via Welspun’s Skill Development Program1,200 Women Engaged Across 10 Vocational CentersSaved 3 mn kWh of Energy in FY17SA 8000 Certified Operations for Socially Responsible Practices24
7EXPERIENCED BOARD & MANAGEMENT WITH PROVEN TRACK RECORDBoard of DirectorsManagement TeamB.K.Goenka, ChairmanRajesh Mandawewala, Managing Director Amongst India’s most dynamic businessmen Ranked amongst India’s Most Powerful CEO by Economic Times Emerging Company of the Year Award in 2008 In-charge of textile business; instrumental in growing reach over 50 countries 25 years of experience in industries varying from Textiles to SAW pipes. He is a Qualified chartered accountantArun Todarwal, Independent Director, Audit Committee ChairmanDipali Goenka, CEO & Joint Managing Director 20 years of experience in Finance, Audit, Taxation and QualityManagement. Member of ICAI, practicing since 1981 Driving force behind textile business, successfully led development of twobrands – SPACES and Welhome Graduate in Psychology and completed Management Programme fromHarvardRam Gopal Sharma, Independent Director 40 years experience in the field of life insurance, mutual funds, finance,training and development.Pradeep Poddar, Independent Director Technocrat & Corporate Leader with 30 years of experience in consumerproducts industry and vast experience in brand buildingArvind Singhal, Independent Director MBA from University of California, founded Technopak, India’s leadingmanagement & operations consulting firm with focus on Textiles, Retail,Healthcare etcAltaf Jiwani, CFO (Welspun India) 25 years experience in corporate finance roles across diverse industries. Previously worked with the RPG Group for 19 years His last role was as the CFO of Phillips Carbon BlackJulie McKenzie, CEO (Welspun USA) 35 years of domestic and international experience in sales,merchandising, sourcing and licencing in the retail industry . Has been previously associated with Nickelodeon, Wal-Mart among othersPadma Betai, Nominee DirectorLeigh Taylor, CEO & President (Welspun UK) CFO of IDBI Bank with nearly 20 years covering areas like Treasury, RetailBanking, Corporate Advisory Services & Domestic Resources 30 years of international experience across consumer products industry. Turnaround specialist with expertise in innovation and new productdevelopment25
7AWARDS & ACCOLADES – TESTIMONY TO EXCELLENCEDipali GoenkaFeatured at #16 inAsia’s Top 50 PowerBusinesswomen (2016)Asia’s 50PowerBusinesswomanWinnerin Textiles Sector(2016)CorporateAwards 2016BestQuality Supplier(2016)Best Performing Brand“Spaces”Best QualitySupplierBest PerformingBrandConferred withSustainability 4.0Certificate of MeritWinner of12 Gold TrophiesSustainabilityQuality(Home Category)and many more .26
8 CONSISTENT FINANCIAL PERFORMANCE RECORDEBITDATotal IncomeCAGR 16%80,00067,21154,92436,965Rs. miilionRs. 4FY15FY16FY179MFY18FY13Net ProfitFY14FY15FY16FY179MFY18Cash ProfitCAGR 33%CAGR 0005,0004,1954,0002,9832,248Rs. million5,3986,000Rs. ,00070,00040,000CAGR 4FY15FY16FY179MFY18Net Profit & Cash Profit FY17 figure is excluding one time impact of Exceptional item of Rs. 5,005 MnCAGR is based on FY13-FY1727
8 CONSISTENT FINANCIAL PERFORMANCE RECORDNet Debt / Equity2.4xNet Debt / FY16FY17FY149MFY18FY15ROCE % .4%FY14FY15FY16FY179MFY18ROE %40.0%21.9%FY169MFY18FY14FY15FY16FY17ROCE and ROE FY17 figures are excluding one time impact of Exceptional item of Rs. 5,005 Mn ; 9M FY18 is annualised9MFY1828
CONTINUED FOCUS ON FREE CASH FLOW3,7704,0002,4052,000239Rs. in Millions8859 785795 ividend(8,000)FCF positive for three consecutive years29
KEY STRATEGICAGENDAINITIATIVES30
WELSPUN’S PATENTED GLOBAL COTTON INTEGRITY PROCESSWelspun’s patented Wel-Trak process,supplemented by scientific traceability from Oritain ,is now the most comprehensive end-to-end fiber tracking process.- Verifies fiber from the origin and at every stage of production- Ensures rigorous process control of fiber’s physical parameters- Authenticates cotton from dedicated sources- Assures independent third party testing- Allows consumers to track fiber in product back to the farm where it was produced31
SMARTSOURCING: ASSET LIGHT FUTURE GROWTHSYNERGISTIC BENEFITSAssuredSupplyCollaboration withSuppliers for Lead TimeReduction via ExclusiveSet-up of WelspunAncillary UnitsLowertransportationcostsLower inventoryLower InterestcostRecycling ofpackaging Already Established Ancillaries Spinning Trims Packaging materials32
Omni-Channel Supportto Top Global Retailersvia ProductDevelopment,Warehousing, Pick andPack, Drop-Ship andAnalyticsSCM Analytics for OurCustomers33
WELSPUN 2.0AGENDA& WAY FORWARD34
WELSPUN INDIA: VISION 2022 1Innovation &Patents 2 3 45BrandsNew MarketsNew ChannelsNew ProductsRevenueNet DebtInnovative / BrandedRevenue ShareWomenEmployeesShare of DomesticRevenue 2bnNIL50%20%20%35
1INNOVATION & PATENTSTECHNOLOGYTranscends toHOME TEXTILESwith Creating interactive experiences through seamless integration of smarttechnology with home textiles Patented augmented reality home décorLaunched in the US for Holiday 2016. Presented at CES2017 at Las Vegas to Extensive Media Coverage36
2BRANDSGlobal Expansion of Owned BrandsA 150-Year OldLegacy. Reinvented Reinvigorated the Christy Brand, which has dominant presence in UK Introduced the brand in US, China and Middle East; witnessed healthy growth Long Standing Associations like Wimbledon, Rugby World Cup and Royal AscotDomestic Expansion India – one of the fastest growing economies in the world with hugepotential for increasing organized market ‘Spaces’ was recently recognized as a best performing brand inhome category in Shoppers Stop Presence in 200 shop-in-shops Licenses for Domestic Market:The NextGrowth Engine37
3NEW MARKETSComposition of Sales (FY17) Indian Urban Home Textile marketis expected to grow from INR257bn in 2016 to INR 438bn by2021 (i.e. CAGR of 11.25%) Government’s Policy on ‘Housingfor all by 2022’ to boost domesticconsumptionPresence in Japan, the MiddleEast, Australia, Russia andSouth AfricaIndia:6-7%RoW:9-10%Future Strategy Welspun India to focus on increasingpresence in subscale / new markets Non-US business is likely to accountfor larger share of incrementalrevenue going forward Implementation of GST toaccelerate move towardsorganised sectorEurope:17-18%Presence in Europe is limited because: Pakistan, Turkey, Egypt andBangladesh have preferential tariffrates from EU, exempting them fromimport duties Welspun’s focus on EU has beenmore recent, mainly through itsinnovative productsUnited States:66-68%Continue to gain market share in the USHome Textile market and grow its USbusiness in the medium – long term38
4NEW CHANNELSHospitality and Healthcare The US hospitality and healthcare market is c. 1.5bn (i.e. for towels and sheets); Welspun currentlyearns c. 50mn from these categories indicating huge growth potential Focus on domestic as well as international markets Tied up with leading hotel chains and wellness centersE-Commerce Created Drop-Ship facility in US, UK & India Leveraging distribution infrastructure to serve customers of: Online channel of Brick & Mortar retailers Online marketplaces Own e-commerce portal (shopwelspun.in for India and shopwelspun.com for the US)39
51NEW PRODUCTSFlooring Solutions to Drive Growth Offerings: Existing – bath rugs, floor rugs and decorative carpetsPotential – tile carpets segment, wall-to-wall carpets Market Size: Domestic market is c. US 125mn with potential to increase toUS 500mn in the next 5 years Capex: Planned capex of INR 6bn ((likely to be installed and functional byH2 FY19)2Untapped Opportunity in Bedding Large untapped opportunity in basic bedding, comforters and quilts Currently, China dominates the market; India is gradually making inroads Contributed 2% of sales in FY173Technical / Advanced Textiles Products for specialized use in healthcare, fire departments, aerospace, defense, automobile, railways and otherutilities. These products include specialized features such as fire retardants, stain resistant, anti-bacterial, PET resistant,and soil resistance, among others. Contributed 2% of sales in FY174Smart Textiles Creating interactive experiences through seamless integration of smart technology with home textiles40
RAISING THE BARDifferentiationStrategy :Innovation,Branding &SustainabilityIndustry DefiningTraceabilitySolutionFocus onDomestic MarketNew ProductLinesNew channelsMOVING TOWARDS VISION 2022Volatile rawmaterial costsRising energy costsAppreciating Rupee41
THANK YOUFor further details, please contact:Altaf JiwaniDirector (Finance) & CFO - Welspun India LimitedEmail: altaf jiwani@welspun.comHarish VenkateswaranAVP - Group Finance and StrategyEmail: harish venkateswaran@welspun.com42
APPENDIXAGENDA43
KEY HIGHLIGHTS- Q3 FY18‘Christy’ presenceexpanded to 36 storesin ChinaNew ‘Spaces’campaign createsstrong recall value inthe domestic marketPartnership withOritainTM under Wel-TrakTMGlobal Cotton IntegrityProcessNew state-of-the artwarehousing facility inUS East Coast forfuture-ready supplychainOnly Indian companyranked among Top-3 inProduct-WiseSustainability scoresby ‘Walmart’Gold trophy fromTexprocil for HighestExports for the 5thyear in a rowEBITDA Margin at 19.0%Net Debt/Equity at 1.12xNet Debt/EBITDA at 2.38x44
FINANCIAL PERFORMANCE – Q3 FY18(Rs. 19.0%24.1%345DepreciationPBTParticularsTotal incomeEBITDAEBITDA Margin16,299ChangeQoQ-13.2%3,063-12.3%-513 bps18.8%21 ,888-43.3%1,451-26.3%Q3FY18Finance CostQ3FY17Q2FY18Exceptional Gain-PAT (Before Minority Interest)7951,502-47.1%1,003-20.7%PAT (After Minority Interest)7741,494-48.2%966-19.9%PAT Margin5.5%9.8%-434 bps5.9%-45 bpsCash Profit2,2702,563-11.4%2,393-5.1%EPS* (Rs.)0.771.49-48.2%0.96-19.9%239-* EPS not annualisedNote: Cash Profit PBDT before exceptionals less Current Tax45
FINANCIAL PERFORMANCE – 9M FY18(Rs. %EBITDA Margin19.8%25.6%-573 bpsFinance ,3567,813-44.2%-(4,656)PAT (Before Minority Interest)3,0832,07948.3%PAT (After Minority Interest)2,9832,03746.4%PAT Margin6.5%4.1%237 bpsCash Profit7,08810,623-33.3%EPS* (Rs.)2.972.0346.4%ParticularsTotal incomeEBITDAExceptional (Loss)9MFY189MFY17* EPS not annualisedNote: Cash Profit PBDT before exceptionals less Current Tax46
FINANCIAL PERFORMANCE TREND(Rs. Million)ParticularsFY15Total 3,69116,83116,6399,124EBITDA 0543,741Finance 4,648)-Growth %EBITDAExceptional (Loss)-FY16FY17-9MFY18PAT (Before Minority Interest)5,4437,4913,6243,083PAT (After Minority Interest)5,3987,3653,5762,983Cash Profit9,09512,07413,7797,0885.47.33.63.0EPS* (Rs.) #* 9MFY18 EPS not annualisedNote: Cash Profit PBDT before exceptionals less Current Tax#Adjusted for stock split47
BALANCE SHEET TREND(Rs. Million)Particulars31-Mar-15 31-Mar-16Net rt Term Loans13,93613,53311,72113,594Long Term 8534,3211,3882,7255,950Net Debt30,47931,09030,38928,903Average Capital Employed#47,61953,33158,18963,150Net Fixed Assets (incl CWIP)26,04933,50835,71334,242Net Current Assets*17,63016,84520,11421,797Total Assets58,96065,49173,28373,683Gross DebtCash & Cash Equiv.# Capital Employed Net worth Gross Debt Other Long Term Liabilities* Net Current Assets does not include Cash & Cash Equivalents48
FINANCIAL RATIO TRENDOperational ratiosSolvencyratiosFY15FY179MFY18Net debt/Equity2.071.581.271.12Net 325.24Current Ratio1.121.151.411.47Fixed Asset turnover2.041.771.861.77Total Asset turnover0.900.900.910.82Inventory days76687068Debtor days40525346Payable days3041413286798282ROE41.8%42.8%29.6%16.0%ROCE (pre-tax)21.8%24.6%19.3%11.4%Cash conversion cycleReturnratiosFY16Continuous Improvement in Net Debt/Equity1. ROCE EBIT / Average Capital Employed; ROE Net Profit / Average Net worth2. Total asset turnover Sales/ (Fixed assets Gross current assets)3. FY17 Return Ratios figures are excluding one time impact of Exceptional item of Rs. 5,005 Mn49
DIVIDEND POLICY Clear, defined Dividend Distribution policy 25% of standalone PAT to be the total payout (incl. dividend tax) Consistent track record of dividend 93.05DPS1.051.300.65Dividend taxper share0.210.260.13PayoutPercentage25%26%26%50
WWELSPUN INDIA HQME TEXTILES WIL/SEC/2018 ' L '-. _,February13,201'2' Bombay Stock Exchange Limited National Stock Exchange ofIndia Limited Department ofCorporate Services, _ ListingCompliance Department SP. J. Towers, Dalal Street,-Exchange Plaza, Bandra—Kurla Complex, Mumbai — 400001 Bandra (E), Mumbai — 051 (Scrip Code—514162) (Symbol: WELSPUNIND) Dear Sirs/ Madam, Subject .
