Transcription
Root Cause Analysis:School Level TeamsAssessment, Accountability, Research,and School Improvement Division
School Improvement855‐7783AARSI TEAM:Lisa BiesingerBrett CampbellSue DaellenbachKrista DonnellyS e EgloffSueRamona EsparzaJeff HalsellLLauraLoveLGreg ManziKim MaukBecca MeyerStacie NelsonDeb RobersonRobe oWayne RobersonNathan TrenholmL k i h YLakeishaYounggTim Zeidler
Talk a Mile a Minute Find a partner One person is designated the“Talker” and the other the“Receiver”Receiver The “Talker” will give clues toeach of the words on the listwithout saying the word The “Receiver” tries to guesstheh wordsd on theh listli byb thehclues
Things associated with theGrowth ModelStudent Growth PercentileCatch upAcademic Peer GroupMove UpM di GrowthMedianGth PercentilePtilN‐ countKeep UpMGPSGP
Things associated with theh l PerformancefkSchoolFrameworkAcademic GrowthMedian Growth PercentileAcademic Achievement (Status)Median Adequate GrowthPercentileAcademic Growth GapsDisaggregated Groups
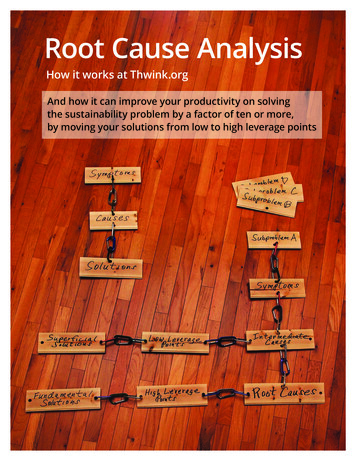
PurposeThe most powerfuluse off root causeanalysis in schoolsoccurs within Preuss, 2003)ImplementEvaluateSchoolImprovementProcessPlan
pg 3Session Outcomes – pg. Complete the 7 steps of Root Cause Analysis: ReviewidentifiedconcernsR iid tifi d performancefWrite ALL possible explanationsCategorize and sort explanations based on 4 levels of RCADecide if it is really a causeNarrow the focusComplete Why/BecauseValidate root causes Time to complete Inquiry Process and Plan Next Steps
Norms for Today Be present,participate, and engage fully.present participatefully Listen to learn, limit sidebars. Monitor personal technology. Pay attention to hand signals.g Lot.” Provide feedback in the “Parking Response Cards at your table.p an openp mind. Keep
Crucial ConversationsAt your table, share:g crucialYour current level of comfort in facilitatingconversations at the school level (select one): A discussion with a colleague about his/her individualclassroom data results within a grade level meetingmeeting. Data walls are displayed in the hallway by grade level. Howdoes a site create a culture for focusing on student learningversus staffff placingl i blameblupon othershffor llackk off progress? A discussion with site administration about a lack of schoolprocess or structure ((e.g.pg criteria for students to be pplacedinto Tier II interventions).
Materials
AgendaIdentify and Focus on concerns from TrendsConsiderCid ExternalE tl DataD t andd factorsf tthat cause performance challengesBrainstorm possible causes for theconcernGroup like causes togetherNarrow explanations“Why .Because” ProcessValidate Root Cause with other Data Sources
Review Homeworkp Completedthe Performance Data Inventoryy(pg. 6‐7). Utilized additional performance data that was usedto finalize your trend analysis. Completed performance trend analysis (Section IIIof SIP Inquiry Process). Finalized prioritization of concerns (chose 2‐4 areason which to focus improvement efforts).)
(pg 5)Data Trends Review (pg. Review written trends: Content area from School Performance Framework (SPF)and data support from Green & Whites,Whites 3 Year TrendReport, or site‐based data Identify measures/metrics Which students (grade and disaggregated group) Direction of trend (increasing, decreasing, or stable) Amount off increase,idecrease,detc. Time period (at least 3 years) Performance indicator: Academic Growth & AcademicAchievement
Data Trends ChecklistCompleted Use QQualityy Criteria (pg(pg.8))to evaluate PerformanceTrends. Indicate that your team isready for a facilitator toprovideid feedbackf db k aboutbyour positive and negativeperformance trendstatements.In Progressy Finalize Data Analysis. Use Performance DataInventory (pg.g 6‐7) towrite positive/negativetrend statements. Identify 2‐4 priorityconcerns.
Priority Concerns ReviewPriority Concerns ARE Specific statements about performance Strategic focus for the improvement efforts About the studentsPriority Concerns are NOT What caused or whyy we have the pperformance challengeg Action steps that need to be takeng , staffing,g, curriculum,, or instruction Concerns about budget, About the adults
Apply Quality Criteria: PerformanceTrends and Priority ConcernsDiscussion Use the Quality Criteria for PerformanceTrends and Priority Concerns (pg. 8‐9). Consider: How are the trends and priority concerns/ differentffffrom that reflectedfsimilar and/orin quality criteria? How could these sections be improved upon?
AgendagIdentify and Focus on concerns from TrendsConsiderCid ExternalE tl DataD t andd factorsf tthat cause performance challengesBrainstorm possible causes for theconcernGroup like causes togetherNarrow explanations“Why .Because” ProcessValidate Root Cause with other Data Sources
Why Root Cause Analysis? Eliminates unfounded opinion, prejudice, andorganizational myth Reduces false starts,starts patching of symptomssymptoms,and waste of scarce resources ConvertsCon erts data to informationinformation, knoknowledge,ledgeunderstanding, and wisdom Improves data‐based decision making(Preuss, 2003)
Root Causes Professional Read (pg.10‐13)(pg 1013) andhighlight central ideas ReviewR i root cause analysisl i terminologyi l(pg. 22‐24))(pg “I got it” ? Could use further clarification * New term or new definition for a familiar term
Reading Key Ideas Identify deepest and most basicconcern & barriers to increasingstudent performance Determine if they are within theschool’ss control and evidence basedschool Treat the cause, not the symptom Focus on the adult actions of theleaders and teachers Consider climate/culture,organization, structures, processes,curriculum & instruction
pg 15Utica HS – RCA Process – pg. In 1996, UticaUtica’ss Proctor High School was underNew York State’s list of “Schools Under Regentse e due to tthee highg ddropoutopout rateate ‐ in 1993993Review”(14.7%) and in 1994 (14.6%). These rates were thed highestg e in thee state.a e Thee schoolc oo wouldou dthirdneed to reduce dropout rates or face statesanctions or closure.
Utica HS – RCA ProcessRed FlagsRed Flags Failure to dropout record Ninth graders werekeeping.added with no advancedplanning. Students feared for theirsafety. Fights were commonoccurrences on campus. School climate/culturewas lacking. Discipline wasiinconsistenti t t across DiscordDid betweenbschoolh lclassrooms.and BOE, and parents.
Utica HS – RCA ProcessRoot Cause Findingsg Low attendance was a concern. Students who were fallingbehind in theirffreshman year had difficulty catching‐up tograduate.d Some students opted to work instead ofcompleting high school career.g familyy Some students had extenuatingsituations that prompted them to drop out.
Utica HS – RCA ProcessSolutions/Strategic Improvement Strategies Night School implemented to accommodate workschedules/family situations Partnershipp with Communityy Collegeg for dual creditsincentive program Academic Plans were created prior to ninth grade Mentoring Program and caring culture established forstudents to feel safe and successful Alternative Route for non‐proficient studentsimplemented for GED/technical vocational programs
Utica HS – RCA Process In 1996,1996 Utica’s Proctor High Schoolhad decreased the drop out rates to((8.1%),) in 1997 to ((4.2%),) and in 1998to (4.3%).()
Sorting Levels of RCA Incident or Procedural Programmatic Systemic External
pg 26Multiple Measures – pg. Demographics School Processes Perceptions Student Learning
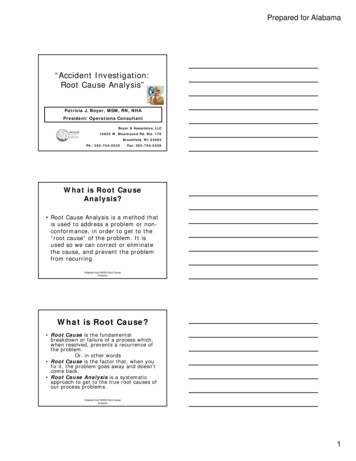
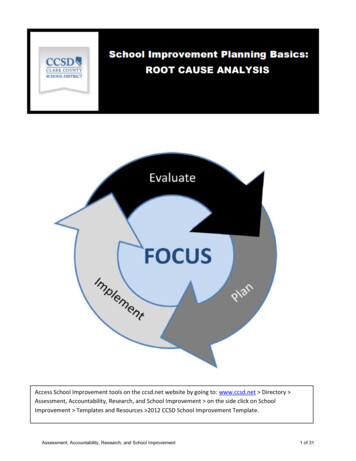
Demographic EvidenceEthnicityAmerican Indian1%Asian1% Pacific Islander1%Black1%Multi‐Race2%SubgroupsIEP11 2%11.2%LEP832.8%FRL67.2%6Hispanic50%White45%
Qualitative School ProcessQEvidenceEvidence: Lesson Plans Meeting Minutes Team Dept.Dept FOSL Data
School Process Evidence – 2 yrs.y
School Process/PerceptionEvidence:Eid Block Schedule Plan Teacher Survey Survey Results Block Schedule Staff DevelopmentActivities
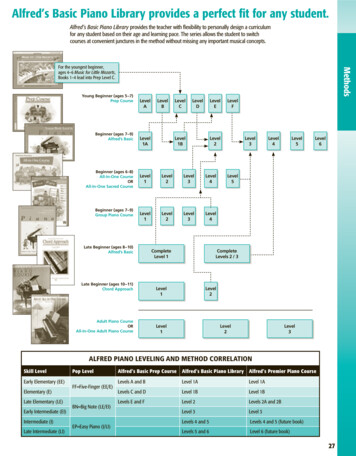
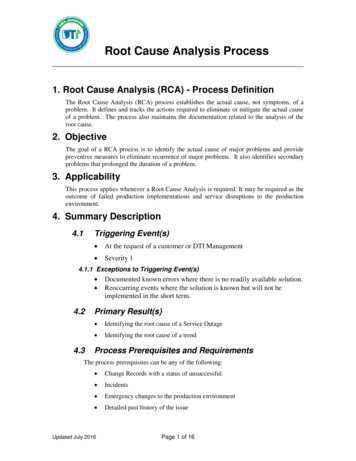
Perception EvidenceTeacher Perception of BlockSchedule EffectivenessEffective Not EffectiveJune 2011Survey97%3%December2011Survey772% 28%
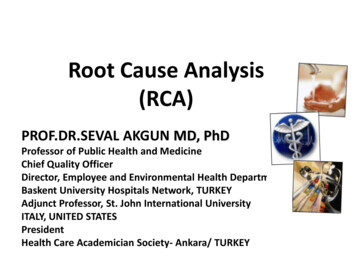
School Process ObservationEvidence
School Process Evidence
School Process Evidence
Reflective Activity Discuss what other measures ofdata you should collect in the2012 13 school2012-13h l year.
RCA ProcessIdentify and Focus on concerns from TrendsConsiderCid ExternalE tl DataD t andd factorsf tthat cause performance challengesHow doweidentifyrootcauses?Brainstorm possible causes for theconcernGroup like causes togetherNarrow explanations“Why .Because” ProcessValidate Root Cause with other Data Sources
Step 3: Identify Root Cause Activity Draw a circle map andwrite yyour mainperformance challenge. Use sticky notes towrite down ALLpossible explanationsrelated to studentlearning demographicslearning,demographics,school processes, andperceptions.PossibleP Explanation
RCA ProcessIdentify and Focus on concerns from TrendsConsiderCid ExternalE tl DataD t andd factorsf tthat cause performance challengesHow doweidentifyrootcauses?Brainstorm possible causes for theconcernGroup like causes togetherNarrow explanations“Why .Because” ProcessValidate Root Cause with other Data Sources
Step 4: When is a Cause a RootCause?1. Would the problem have occurred if the cause had notbeenpresent?bIf no then root causeIf yes then contributing cause2. Will the problem reoccur as the result of the samecause if theh cause iis correctedd or didissolved?l d3. Will correction or dissolution of the cause lead toOth iindicators:di td d end,deadd allll agree,similari il events?t ? Othercontrolled, dissolved, logical and makes sense.
Step 4: When Do We Stop Seeking aCause? A professional judgmentj dgment call is made.made Sufficient data is available. A solid effort has been made to arrive ata reasonable root cause.cause
Step 4: Sort & CategorizeExplanations Sort and groupgro psimilarexplanationsinto the 4 levelsof RCA – seepg. nPossibleExplanation
AgendagIdentify and Focus on concerns from TrendsConsiderCid ExternalE tl DataD t andd factorsf tthat cause performance challengesBrainstorm possible causes for theconcernGroup like causes togetherNarrow explanations“Why .Because” ProcessValidate Root Cause with other Data Sources
Step 5: Narrow Focus ActivityUse RCA pg. 17 to narrow root cause focus 1. Eliminate explanations that are not withinour control. 2. Evaluate the quality of your explanations(reach consensus on which ones to keep). 3. Clarify the language used in yourexplanations.explanations
StepActivity‐pg. 19p 6: Why Becauseyy pg9
AgendagIdentify and Focus on concerns from TrendsConsiderCid ExternalE tl DataD t andd factorsf tthat cause performance challengesBrainstorm possible causes for theconcernGroup like causes togetherNarrow explanations“Why .Because” ProcessValidate Root Cause with other Data Sources
pg 20Step 7 : Validating Root Cause – pg.1.What is the proof that this cause exists?2.What is the proof that this cause could lead to the statedeffect?ff t?3.What proof is there that this cause actually contributed to theproblem?4.Is anything else needed, along with this cause, for the statedeffect to occur? EX: Are the specialpeducation studentschedules the only factor that prevents them from grade levelcurriculum exposure, or is there another key factor?5.Can anything else, besides this cause, lead to the statedeffect?
Step 7 : Validating Root CauseActivity Use Validating Root CauseCa se to determinethat this is the root cause (pg. 21).
Inquiry Process in SIP Template Time to work with yyour site team tocomplete the inquiry process, Section IIIof SIP template Facilitators will assist with clarification ofquestionsCollaborateabo ate witht feedereede schoolssc oo s Co Title I Overview Meeting (if applicable)
Root Cause Analysis Homework What data sourcesso rces are still neededfor Root Cause Analysis validation? What school processes/structuresneed to be analyzed further?
Taking it back to the schoolNext steps: Complete the Inquiry Process Finalize Data Trends‐Positive/Negative Determine Key Strengths & PriorityConcerns Identify Root Cause(s)
Step 7 : Validating Root Cause -pg. 20 1.What is the proof that this cause exists? 2.What is the proof that this cause could lead to the stated eff t?ffect? 3.What proof is there that this cause actually contributed to the problem? 4.Is anything else needed, along with this cause, for the stated