Transcription
A review of the ENTSO-ETransparency PlatformOutput 1 of the “Study on the quality of electricitymarket data” commissioned by the EuropeanCommissionVVA, Copenhagen Economics, Neon, Deloitte12 – 2017InternalEnergyMarket
Table of Contents1.Objective . 42.About the ENTSO-E Transparency Platform . 42.1.Content and size . 42.1.1.Datasets and data items . 42.1.2.Geographic concepts . 62.1.3.Size . 72.2.Data download . 72.3.Data upload . 82.4.Governance . 82.5.Future plans and further development of the Platform. 93.Methodology .103.1.Evaluation criteria . 103.1.1.Completeness . 103.1.2.Accuracy . 103.1.3.Timeliness . 113.1.4.User friendliness . 113.2.Review of other quality assessments . 113.2.1.Internal ENTSO-E assessments . 113.2.2.ETUG process . 123.2.3.ACER opinions . 123.3.Statistical data analysis. 123.4.Online user survey . 133.5.Expert interviews . 143.6.Limitations . 164.Findings .164.1.Completeness . 164.1.1.Missing data (data gaps) . 174.1.2.Reporting data gaps and public documentation of issues . 314.1.3.Broadening the scope . 314.2.Accuracy . 324.2.1.Comparison with other sources . 344.2.2.Other accuracy issues . 434.2.3.Reporting inaccuracies and public documentation of issues . 444.2.4.Inaccuracy in data definitions . 444.3.Timeliness . 454.3.1.Outage data and UMMs . 464.3.2.Overwriting forecasts . 482
4.3.3.4.4.Delays in data availability . 48User friendliness . 484.4.1.Website and GUI . 494.4.2.Automatic download . 514.4.3.Issues with data files . 524.4.4.Displaying data availability and “master data” . 534.4.5.Data documentation . 534.4.6.User support and contacts. 545.Suggestions and conclusions .555.1.Priorities . 555.1.1.Light users . 555.1.2.Frequent users . 555.2.Suggestions for improvements . 555.2.1.Improve information and navigation . 555.2.2.A crowd-sourced public data quality log . 565.2.3.Automatic quality reporting . 575.2.4.Machine-readable metadata . 575.2.5.Governance, ownership and incentives . 573
1. OBJECTIVEThe objective of this work package is to evaluate the quality of data published throughthe ENTSO-E Transparency Platform (TP) as well as the user friendliness of the platformitself. It is our aim to be constructive and solution-oriented so that this work can contribute to improving the TP going forward. This section of the study was carried out by Neon.2. ABOUT THE ENTSO-E TRANSPARENCY PLATFORMThe ENTSO-E Transparency Platform (TP) is an online data platform for European electricitysystem data. It was established through the Regulation (EU) No. 543/20131, sometimescalled the Transparency Regulation, which also prescribes which data must be published.It is our understanding that the purpose of the TP is to serve market participants, such asgenerators, retailers and traders. Transparency is meant to reduce insider trading and levelthe playing field between small and large actors. The TP currently has 8800 registeredusers, a number that indicates interest not only from market participants but also fromresearchers and other parties. Sometimes the TP is referred to as EMFIP, which was thename of the project initiated to deliver the TP. The TP is developed, maintained and operated by the European Network of Transmission System Operators for Electricity 2 (ENTSOE), an industry body.There is an overlap between some of the data provided on the TP with other data platformsthat are in place for market participants to disclose inside information according to Article4 of Regulation (EU) No. 1227/2011 (REMIT) 3, including e.g. EEX Transparency4. This affects so-called “Urgent Market Messages” (UMMs), which on the TP are published in theOutages data domain. While the Transparency Regulation requires that the specified databe published on the TP, REMIT leaves the choice of platform open to market participants.Several so-called “Inside Information Platforms”5 have emerged to allow market participants to fulfil their REMIT obligations. The TP, which entered into force after REMIT,publishes some data that are published on Inside Information Platforms as well, but is notan Inside Information Platform itself.2.1. Content and sizeThe Regulation 543/2013 stipulates in detail which data items must be published for whichgeographic entity (see Section 2.1.2). The TP includes no other data than those mentionedin the Regulation, but it sometimes includes data for geographic entities for which publication is not obligatory.2.1.1. Datasets and data itemsThe Regulation, in Articles 6–17, specifies a total of 49 data items to be published on theTP, each of which carries an alphanumerical identifier based on the respective article (Table1). On the TP website, the data items are organized somewhat differently; they aregrouped into six categories (“data domains”): Load, Generation, Transmission, Balancing,Outages and Congestion Management. They include 55 sub-categories in total. The difference from the number of Regulation articles comes about as the website combines someof the data items into the same sub-category and splits up others over multiple sub-categories. Table 1 maps out the data items based on their category on the TP website -inside-platforms4
corresponding article in Regulation 543/2013; these data item names and article numberswill be used throughout the report.Table 1. Overview of data items available on the ENTSO-E TP.Category on TPwebsiteLoadGenerationArticle in Regulation543/20136.1.ADay-ahead Total Load Forecast6.1.CWeek-ahead Total Load Forecast6.1.DMonth-ahead Total Load Forecast6.1.EYear-ahead Total Load Forecast8.1Year-ahead Forecast Margin14.1.AInstalled Generation Capacity Aggregated14.1.BInstalled generation capacity per unit14.1.CDay-ahead Aggregated Generation14.1.DDay-ahead Generation Forecasts for Wind and Solar16.1.AActual Generation per Generation Unit16.1.BAggregated Generation per Type16.1.CAggregated Generation per TypeAggregate Filling Rate of Water Reservoirs and Hydro Storage Plants9.1Expansion And Dismantling Projects11.1.AForecasted Day-ahead Transfer Capacities11.1.BDay Ahead Flow Based Allocations11.3Cross-border Capacity for DC LinksYearly Report About Critical Network Elements Limiting Offered Capacities11.4BalancingOutagesActual Total Load6.1.B16.1.DTransmissionData item (49 in total)12.1.AExplicit Allocations - Use of the Transfer Capacity12.1.BTotal Nominated Capacity12.1.CTotal Capacity Already Allocated12.1.DDay-ahead Prices12.1.EImplicit Allocations - Net Positions12.1.FScheduled Commercial Exchanges12.1.GPhysical Flows12.1.HTransfer Capacities Allocated with Third Countries17.1.ARules on Balancing17.1.BAmount of Balancing Reserves Under Contract17.1.CPrice of Reserved Balancing Reserves17.1.DAccepted Aggregated Offers17.1.EActivated Balancing Energy17.1.FPrices of Activated Balancing Energy17.1.GImbalance Prices17.1.HTotal Imbalance Volumes17.1.IFinancial Expenses and Income for Balancing17.1.JVolumes of Exchanged Bids and Offers7.1.APlanned Unavailability of Consumption Units7.1.BChanges in Actual Availability of Consumption Units5
Category on TPwebsiteArticle in Regulation543/201310.1.A10.1.BPlanned Unavailability in the Transmission GridChanges in Actual Availability in the Transmission GridChanges in Actual Availability of Off-shore Grid Infrastructure10.1.CCongestionmanagementData item (49 in total)15.1.APlanned Unavailability of Generation Units15.1.BChanges in Actual Availability of Generation Units15.1.CPlanned Unavailability of Production Units15.1.DChanges in Actual Availability of Production Costs of Congestion Management2.1.2. Geographic conceptsSome data items in the Generation and Outages data domains are reported by individualgeneration and consumption units. The majority of all other data items are aggregatesfor geographical areas or borders between them. Four main different geographical concepts are used: countries,bidding zones BZ (areas in which there is a uniform spot price),control areas CA (areas in which the grid is operated by a single system operator)andmarket balance areas MBA (areas in which there is a uniform balancing energyprice).Altogether, they account for 206 differently named areas, of which 143 are located insidethe EU. However, most countries are congruent with exactly one of each of the other concepts, reducing the number of unique geographical entities to 91 (of which 67 are in theEU). Unique areas are identified by the same Energy Identification Code6 (EIC), a codingscheme developed by ENTSO-E. These geographical concepts are summarized in Table 2.In a few countries, different concepts do not align, including the Scandinavian countries(2–5 bidding zones each), Italy (18 bidding zones) and Germany (4 control areas). Marketbalancing areas mostly coincide with bidding zones, except for Austria, Germany, Luxembourg and Italy.Table 2. Summary of geographical concepts along which data are published.AreasOf which EUBordersOf which EUCountries42283434Bidding zones6548166152Control areas4632148146Market balance areas523417172051433483329066255241TotalUnique entitiesNotes: “Unique entities” counts congruent entities only once / all EICs 6 non-EU countries without EICs. Thelist of country borders listed in CSV files retrieved via FTP is incomplete. For example, “Scheduled t.aspx6
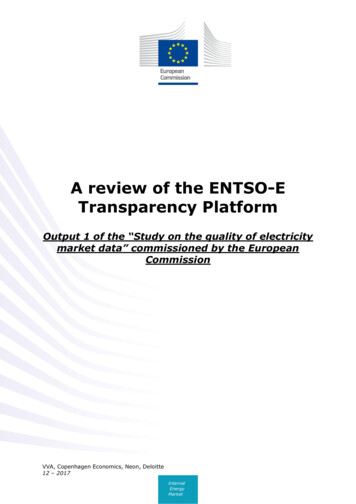
Exchanges” (12.1.F) are reported between the Czech Republic and Germany, but not between the Czech Republicand Austria. For an overview on geographical concepts, see https://neon-energie.de/transparency-platform.For each data item, the Regulation specifies the concept to be used for reporting, in mostcases control areas. However, to accommodate user interests, many data items areavailable for some of the other concepts, mostly bidding zones and countries, resulting indouble or triple publishing of the same reported values. For example, “Actual Total Load”(6.1.A) is available for all three concepts.Borders can exist between all geographic concepts: borders between bidding zones, borders between countries and so on. For example, “Cross Border Physical Flows” (12.1.G)are reported for each border between neighbouring bidding zones as required by the Regulation and for borders between control areas (but not for intra-German control-areaborders).2.1.3. SizeIn April 2017, The CSV files available on the FTP server contained about 35 GB of datacovering 2.5 years. Generation, including generation data by unit, is the largest data domain (see Figure 1).Figure 1. Size of CSV files by data domain on FTP server.Key point: The TP is large.Notes: Outage data are not fully available through FTP.Source: All figures are own work based on the online survey conducted for this project or our own analysis ofTP data, unless specified otherwise.Most TP data are organized in time series. We do not know the total number of time series,but gauge that it could be several thousand or tens of thousands. 42 countries times 49data items make over 2000 combinations in total. The number of time series published onthe TP is much higher, however, because many data items are reported for several geographic concepts. For example, “Actual Total Load” (6.1.A) is available by country as wellas by control area and by bidding zone. In addition, many data items include a large number of individual time series, most notably “Actual Generation per Generation Unit”(16.1.A), which are reported for about 2000 individual units. Event-driven data, such asoutages, add to the complexity and size.2.2. Data downloadAs a result of requests by users who want to integrate the data into their IT workflows, anumber of download options have been developed over time. There are currently six waysto access and download data, as summarized in Table 3. It is our understanding that the7
last three options listed are still supported despite being legacy options superseded by theRestful API and FTP (currently in a test phase and scheduled to be promoted for public usein the first quarter of 2018).Table 3. Data access and download options.NameDescriptionFile size / scopeFile types UpdatesWebsite GUIManual download viagraphical user interfaceXML,Daily or yearly files for sinCSV,gle areas/unitsXLSXClose to realtimeRestful APISend specific downloadrequest via scripting languagesUp to yearly files for singleareas/units. For outageXMLdata: up to 200 reportsClose to realtimeFTP serverBulk access to all countrydata for any data itemusing the File TransferProtocolMonthly files for all areas/unitsCSVOnce dailyData repository(short term) solutionTo be replaced by FTPserver50 MBXMLClose to realtimeWeb servicequeriesTo be replaced by RestfulAPI?XMLClose to realtimeSubscriptionsPush files to users assoon as they are available?XMLClose to realtime2.3. Data uploadENTSO-E has developed and maintains the technical platform and database but does notprovide the data. Many institutions submit data to comply with publication requirementsspecified in Regulation 543/2013. These institutions are called “Data Providers”. There areabout 50 Data Providers, including all European TSOs. Data can stem from Data Providersthemselves and/or from third parties; the original sources of the data are called “PrimaryData Owners”. Exact numbers are not available, but we gauge that there are several thousand Primary Data Owners, possibly including all European TSOs, DSOs, power exchanges,larger generation companies and merchant link operators.Generators, who must submit generation by unit data as well as outage data, do not submitdata directly to the TP. Rather, data are channelled through intermediaries who serve asData Providers; for example, the European Energy Exchange (EEX) is such an intermediaryfor German generators and the respective TSOs for Nordic generators. The intermediariesare often also Primary Data Owners. To add to the complexity, some of them (includingEEX and Nordpool) operate their own “transparency” data platforms, often to fulfil REMITrequirements.2.4. GovernanceRegulation (EU) No. 543/20137 forms the legal basis for the TP, specifying data items anddeadlines. Technical procedures and definitions are in a handbook called the “Manual ofProcedures”8(MoP). Revising the MoP is a formalized process that can take more than /Manual-of-Procedures/Pages/default.aspx8
year. An annex to the MoP is the “Detailed Data Descriptions”9, which specifies data itemsin more detail than the Regulation.In March 2015, the ENTSO-E Transparency User Group10 (ETUG) was established as theprimary forum for stakeholders to discuss issues, definitions and upcoming changes. ETUGhas 32 core and around 40 remote members, most of whom are market participants. Themeetings are closed to the public but the minutes of all ETUG meetings are published onthe ENTSO-E website.2.5. Future plans and further development of the PlatformAs of September 2017, ENTSO-E is in the process of developing the TP to reflect stakeholders’ requests for improvements. Such improvements are anticipated to be available in2018. The MoP also is in the process of being revised. Updates regarding this process canbe found on the TP website11. This report reflects the state of the TP and its componentsas of mid-2017 (data was retrieved April–September 2017). Planned changes and futureimprovements were not reviewed or assessed in this report.https://www.entsoe.eu/fileadmin/user upload/ orm/Manual-of-Procedures/Pages/default.aspx99
3. METHODOLOGYThis report evaluates the quality of the data published through the TP along three criteria: completeness, accuracy and timeliness. The user friendliness of the platform itself isassessed as well.To deliver a thorough, comprehensive and fair assessment, we applied four complementaryapproaches: a review of other (previous) TP evaluations, new statistical data analysis, anonline user survey and expert interviews. In general, there is a good match among thesesources of information: often issues that we encountered in our analysis also were mentioned by users and surfaced in previous evaluations. We are confident that taken together,these four sources provide a comprehensive view of the quality and usability of the TP. Asmentioned earlier, the analysis reflects the data as of mid-2017. This section first describesthe four evaluation criteria and then proceeds by outlining the four methods we employed.3.1. Evaluation criteriaFour criteria were applied to assess the quality of the TP: completeness, accuracy, timeliness and user friendliness. These criteria are mentioned in Regulation 543/2013 andspecified in the Terms of Reference issued by the European Commission tendering thestudy contract.3.1.1. CompletenessRegulation 543/2013 prescribes in detail which data items shall be published in the TP;hence, assessing completeness is verifying whether this is the case. We therefore aim toanswer the following questions: Are data provided for all geographic entities that apply (bidding zones, borders,market balancing areas)?Are any values missing within the time series?Are users informed about missing data and can users report missing data?What types of data would users like to find on the TP, going beyond the Regulation?We gauge that there might be tens of thousands of time series published on the TP, plusevent-driven data (recall Section 2.1.3). Displaying completeness information for each ofthese time series is beyond the scope of this report. We therefore focus on a subset of dataitems we deem particularly important and/or where users have indicated completenessconcerns during the interviews and the online survey we conducted.3.1.2. AccuracyThe accuracy analysis shall identify whether data are “correct”. This includes the questions: Are data different from other sources or can they otherwise be identified as incorrect?Are data definitions applied consistently within the TP?Are users informed about inaccuracy and can users report inaccuracies?Are data definitions accurate?We rely on user feedback through the online survey and expert interviews as well as ENTSO-E’s quality assessment to identify problematic areas. In addition, the accuracy of somedata is assessed by comparing the TP to other data sources such as ENTSO-E’s PowerStatistics, the websites of individual TSOs, Eurostat and national statistical sources. Theselection of the data items tested is driven by the availability of data to which TP data can10
be compared reasonably. Such a comparison can indicate inconsistencies but never, byitself, identify “wrong” data. This is due to two reasons: first, data sources do not shareidentical data definitions, hence differing values may arise as a result of differing datadefinitions rather than inaccuracies. Second, we are not claiming that the other datasources are “correct”. Inconsistencies can also arise, of course, if TP data are more accurate than those of the other source.3.1.3. TimelinessEvaluating timeliness means determining whether data have been published on time. Publication deadlines are specified by data item in Regulation 543/2013. Data entries in theTP are marked with a timestamp that could be checked against the respective benchmark.However, Data Providers can update data by overwriting previous submissions. In thiscase, the information of when data were published first is no longer available. A statisticalex-post assessment of the timeliness of data publication 2015–2016 is thus not possible.We therefore rely on user input for the timeliness assessment, in particular from marketparticipants, that we have collected through the online survey and interviews. The resultsshould be read as reflecting user experiences and expectations. While this has caveats, wedeem it the best approach feasible within the scope of this report. The timeliness analysisaddressed questions including: Are outage data and UMMs reported accurately and in a useful way?Are forecasts overwritten?Are there delays in data availability?3.1.4. User friendlinessUser friendliness—which we interpret as usability—does not concern the content (data) ofthe TP but rather the structure of the platform itself. It includes topics such as navigatingthe website, data documentation and the availability of download options. We assessuser friendliness by reporting on our own experience of working with the TP, but moreimportantly based on the online survey and the expert interviews conducted. In particular, we ask questions such as: Can users find the data they need?Are data logically presented?Is it clear to users which data are available?Is the reason for data unavailability clear to users?Is data documentation clear, sufficient and easy to find?Can users easily select and access the data they wish to download?Do data files contain data in a form that is easy to process?Are the download options properly documented so that users are informed aboutthe possible download options and how to use them?Do the download options allow for easy, fast and reliable access to the data?Are service requests handled efficiently and satisfactorily?3.2. Review of other quality assessmentsThis report is not the first to assess the quality of the TP. ENTSO-E has done variousinternal quality assessments, ETUG is a channel through which users have reported issuesand ACER has published opinions on the matter. These assessments informed our statistical analysis.3.2.1. Internal ENTSO-E assessmentsENTSO-E has internal reporting tools in place to monitor completeness and timeliness ofdata submission by the Data Providers. Aggregates of the data completeness measure11
have been reported to ETUG and to ACER occasionally (e.g. ETUG meeting 20.10.201512:“provision of data is estimated to [be] more than 85%”), but have not been made publicin a systematic manner. Several of our interview partners reported that this is due toreservations by the Data Providers, which want to avoid being called out for not complyingwith publication obligations.Users can report individual data quality issues by emailing the TP service desk13. Duringthe early phase of the TP, in Q1/2015, the service desk received around 260 support requests; in Q1–Q2 2017, it received a similar number of requests.3.2.2. ETUG processETUG meets a few times each year and serves as a representative of users’ views duringprocesses to improve the TP. The meetings are closed to the public but the minutes arepublished on the ENTSO-E website14. We received a provisional membership to ETUG forthis project and thus could review ETUG documents assessing the TP beyond those thatare publicly available. Documents we used for the analysis include slide decks regardingrevising the MoP and issues with the TP reported by users, including via an April 2015online survey15 answered by 65 users focusing on user-friendliness issues.3.2.3. ACER opinionsACER is legally obliged to provide opinions on the TP and revisions to it. Furthermore, ACERstaff are themselves users of the TP, so they have experience working with it and familiaritywith its strengths and shortcomings. ACER has released opinions regarding the TP that wefound helpful for our analysis, including opinions on the launch of the TP and on updatesto the MoP, in particular the December 2013 opinion “On the Manual of Procedures for theENTSO-E Central Information Transparency Platform”16 and the February 2017 opinion “Onthe First Update of the Manual of Procedures for the ENTSO-E Central Information Transparency Platform”17.3.3. Statistical data analysisThe goal of the statistical data analysis is to have an overview of the data quality by studying data for all EU Member States for the period 2015–16. This requires three steps: (i)extract the data from the TP database, (ii) process and condense them into a workableformat and (iii) produce statistics and graphical representations that allow for an assessment along the evaluation criteria.We chose the FTP as our download option because it provides data for all geographicalentities in one place. It should be noted that the FTP server is operating in a test phase.On the FTP server, data are bundled in monthly CSV files grouped in 88 folders that canbe mapped to the 49 data items specified in the Regulation and listed in Table 1. One fileusually contains the reported values for one data item for all areas for the given month asa vertical list. Often the same values are contained two- or threefold due to the overlappinggeographical concepts.https://www
corresponding article in Regulation 543/2013; these data item names and article numbers will be used throughout the report. Table 1. Overview of data items available on the ENTSO-E TP. Category on TP website Article in Regulation 543/2013 Data item (49 in total) Load 6.1.A Actual Total Load 6.1.B Day-ahead Total Load Forecast