Transcription
ENTERPRISE MINER:4 – CREDIT SCORECARD DEVELOPMENTDR IAIN BROWN, ANALYTICS & INNOVATION PRACTICE, SAS UK15 NOVEMBER, 2016C op yr i g h t 2 0 1 2 , S A S I n s t i t u t e I n c . A l l r i g h t s r es er v e d .
CREDIT SCORECARDAGENDADEVELOPMENTSAS – 15th November 2016 at 10:00am Enterprise Miner: Credit Scorecard Development The session looks at:- Variable Classing and Selection- Scorecard Modelling- Reject Inference- Scorecard Assessment C op yr i g h t 2 0 1 2 , S A S I n s t i t u t e I n c . A l l r i g h t s r es er v e d .
ROLE OF SAS ENTERPRISE MINERC op yr i g h t 2 0 1 2 , S A S I n s t i t u t e I n c . A l l r i g h t s r es er v e d .
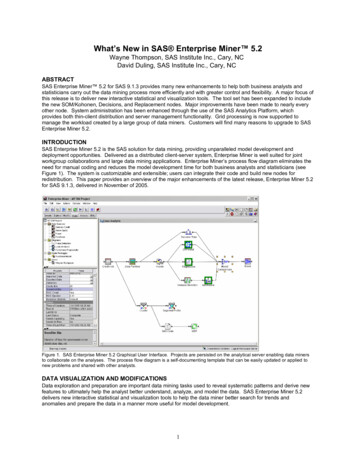
THE ANALYTICSPREDICTIVE ANALYTICS AND DATA MININGLIFECYCLEBUSINESSMANAGERDomain ExpertMakes DecisionsEvaluates Processes and ROIEVALUATE /MONITORRESULTSIDENTIFY /FORMULATEPROBLEMDATAPREPARATIONDEPLOYMODELIT SYSTEMS /MANAGEMENTModel ValidationModel DeploymentModel MonitoringData PreparationC op yr i g h t 2 0 1 2 , S A S I n s t i t u t e I n c . A l l r i g h t s r es er v e d .BUSINESSANALYSTData ExplorationData VisualizationReport CreationDATAEXPLORATIONDATA MINER /STATISTICIANVALIDATEMODELTRANSFORM& SELECTBUILDMODELExploratory AnalysisDescriptive SegmentationPredictive Modeling
THE ANALYTICSANALYTICAL MODEL DEVELOPMENTLIFECYCLEBUSINESSMANAGERDomain ExpertMakes DecisionsEvaluates Processes and ROIEVALUATE /MONITORRESULTSIDENTIFY /FORMULATEPROBLEMDATAPREPARATIONDEPLOYMODELIT SYSTEMS /MANAGEMENTModel ValidationModel DeploymentModel MonitoringData PreparationC op yr i g h t 2 0 1 2 , S A S I n s t i t u t e I n c . A l l r i g h t s r es er v e d .BUSINESSANALYSTData ExplorationData VisualizationReport CreationDATAEXPLORATIONDATA MINER /STATISTICIANVALIDATEMODELTRANSFORM& SELECTBUILDMODELExploratory AnalysisDescriptive SegmentationPredictive Modeling
SAS ENTERPRISE SAS ENTERPRISE MINER MINER SEMMA IN ACTION – REPEATABLE PROCESSC op yr i g h t 2 0 1 2 , S A S I n s t i t u t e I n c . A l l r i g h t s r es er v e d .
SAS ENTERPRISEADD-IN: SAS CREDIT SCORING FOR ENTERPRISE MINER MINER Build Scorecards to assign risk scores to customers: Application Scoring Behavior Scoring Probability of Default Scoring (rating) Collection scoringLot’s of control over the scorecard construction. Not a black box.Broad set of tools to support the complete data mining processEasy-to-use GUI to develop more –and better – scorecardsEasy to distribute and scalable systemAn open, extensible design for ultimate flexibility GUI SAS Code Node Extension Nodes Batch processing Extensive model scoring alternatives SAS, Java, PMML, Scoring Accelerator for TeradataC op yr i g h t 2 0 1 2 , S A S I n s t i t u t e I n c . A l l r i g h t s r es er v e d .
CREDIT SCORINGC op yr i g h t 2 0 1 2 , S A S I n s t i t u t e I n c . A l l r i g h t s r es er v e d .
CREDIT SCORING OVERVIEW Application scoring: Likelihood that an applicant will not repay a loan and willtherefore fall into default Applicant characteristics (for example, age, income, employment status, time ataddress, ) Credit bureau information Application information of other applicants Repayment behaviour of other applicants Develop models (scorecards) estimating the probability of default of acustomer Typically, assign points to each piece of information, add all points, andcompare with a threshold (cutoff)C op yr i g h t 2 0 1 2 , S A S I n s t i t u t e I n c . A l l r i g h t s r es er v e d .
CREDIT SCORING OVERVIEW Behavioural scoring: Through the cycle risk of default based on an existingcustomer’s behaviour Update risk assessment taking into account recent behaviour Example of behaviour:Average/Max/Min/trend in checking account balance, bureau score, Delinquency history (payment arrears, ) Job changes, home address changes, DynamicC op yr i g h t 2 0 1 2 , S A S I n s t i t u t e I n c . A l l r i g h t s r es er v e d .
CREDIT SCORING CREDIT SCORECARD DEVELOPMENT PROCESS1. Variable Classing and Selection Calculation of Weight of Evidence statistics Calculation of Information Value or Gini statistics Automatic and Interactive Enhances productivityIncorporate business knowledge2. Scorecard construction Fitting a logistic regression model Scaling and calculating score points3. Assessing Scorecard quality KS, GINI, ROC and Trade-off charts4. Reject Inference Model for scoring through-the-door populationC op yr i g h t 2 0 1 2 , S A S I n s t i t u t e I n c . A l l r i g h t s r es er v e d .
CREDIT SCORING SPECIFIC CREDIT SCORECARD CAPABILITIESEM Credit Scoring nodes: Automatic and interactive variable grouping Computes Weights of Evidence GINI and Information Values for variable selection Scorecard construction Logistic regression based using WOE or dummy variables as inputs Parameterized score points scaling Assessment statistics and charts Reject inference Through the door impact analysisC op yr i g h t 2 0 1 2 , S A S I n s t i t u t e I n c . A l l r i g h t s r es er v e d .
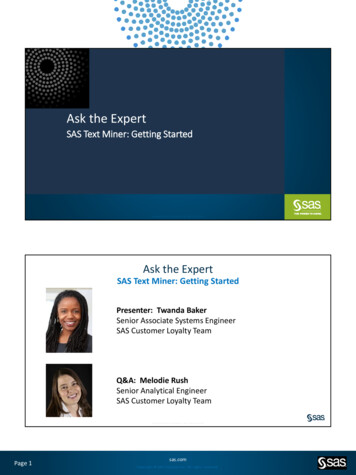
CREDIT SCORING EXAMPLE CREDIT SCORECARDLet cutoff 500 pointsACCEPT FOR CREDITC op yr i g h t 2 0 1 2 , S A S I n s t i t u t e I n c . A l l r i g h t s r es er v e d .
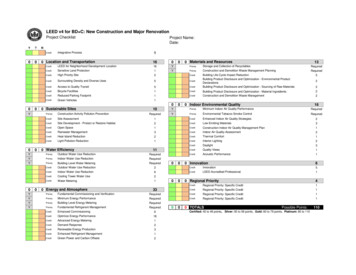
CREDIT SCORING IMPROVEMENTSAt constant approval rate:Reduce bad ratefrom 2.5% to 1.9%At constant bad rate:Increase approval ratefrom 70% to 87%C op yr i g h t 2 0 1 2 , S A S I n s t i t u t e I n c . A l l r i g h t s r es er v e d .
CREDIT SCORING INTERACTIVE GROUPING NODE EXAMPLE RESULTS Automatic and interactive variable grouping Computes Weights of EvidenceAuto-updating IV and GiniC op yr i g h t 2 0 1 2 , S A S I n s t i t u t e I n c . A l l r i g h t s r es er v e d .Fine/Coarse Detail
CREDIT SCORING INTERACTIVE GROUPINGMetrics for Characteristic Analysis Measures commonly used in a characteristic analysisWeights of Evidence (WOE) – measures the strength of the attribute of acharacteristic in separating good and bad accounts Information Value (IV) – measures the overall predictive power of the characteristic;that is, its ability to separate good and bad loans. (weighted sum of WOEs) Gini Statistic – alternative approach to IV to assess the overall predictive power of acharacteristic. C op yr i g h t 2 0 1 2 , S A S I n s t i t u t e I n c . A l l r i g h t s r es er v e d .
CREDIT SCORING INTERACTIVE GROUPINGGrouping options The Interval and Ordinal Grouping Method fieldsdetermine how the grouping algorithm groups the prebinned interval and ordinal variables:Optimal Criterion – groups the variables based on thecriterion property Quantile – enables the algorithm to generate groups withapproximately the same frequency in each group. Monotonic Event Rate – generates groups that result in amonotonic distribution of event rates across all levels Constrained optimal – generates groups based on predefined constraints C op yr i g h t 2 0 1 2 , S A S I n s t i t u t e I n c . A l l r i g h t s r es er v e d .
CREDIT SCORING SCORECARD LOGISTIC REGRESSION SCALING In order to determine the relative contribution of each characteristic logisticregression is used. One regression co-efficient per characteristic is produced if Weight OfEvidence coding is used Dummy variable (1-of-n coding) would instead lead to one co-efficient perattribute.C op yr i g h t 2 0 1 2 , S A S I n s t i t u t e I n c . A l l r i g h t s r es er v e d .
CREDIT SCORING SCORE POINTS An attribute’s points reflect: Risk of an attribute relative to other attributes of the same characteristic; determinedby an attributes WOE, Weight of Evidence, value Relative contribution of each characteristic to the overall score; determined by acharacteristic’s co-efficient in a logistic regression modelC op yr i g h t 2 0 1 2 , S A S I n s t i t u t e I n c . A l l r i g h t s r es er v e d .
CREDIT SCORING SCALINGIn order to obtain more ‘friendly’ scores, the points per attribute are linearlyscaled with a factor and an offset. The score is proportional to the good/bad odds and not the bad/good oddsthat are modeled in the logistic regression, thus a negative sign is introduced. Smaller scores thus correspond to higher risk. C op yr i g h t 2 0 1 2 , S A S I n s t i t u t e I n c . A l l r i g h t s r es er v e d .
CREDIT SCORING SCORECARD NODE SAMPLE RESULTSC op yr i g h t 2 0 1 2 , S A S I n s t i t u t e I n c . A l l r i g h t s r es er v e d .
CREDIT SCORING REJECT INFERENCE Good / bad Information is only available for past accepts, but not for pastrejects. In order to arrive at models for the through-the-door population, it is commonpractice to perform ‘Reject Inference’: apply the scorecard to the rejects andclassify rejects as inferred good / inferred bad. An ‘augmented’ input data set then is created by adding the inferred good /bad to the actual good / bad. The scorecard is re-adjusted using this data set.C op yr i g h t 2 0 1 2 , S A S I n s t i t u t e I n c . A l l r i g h t s r es er v e d .
CREDIT SCORING REJECT INFERENCE – TECHNIQUES The reject inference node enables three types of augmentation technique tobe applied: Hard Cutoff Parcelling FuzzyC op yr i g h t 2 0 1 2 , S A S I n s t i t u t e I n c . A l l r i g h t s r es er v e d .
CREDIT SCORING REJECT INFERENCE – TECHNIQUESHard Cutoff Augmentation1. Build a scorecard model using the known good/bad population (that is,accepted applicants).2. Score the rejected applicants with this model to obtain each rejectedapplicant’s probability of default and their score on the scorecard model.3. Create weighted cases for the rejected applicants.4. Set a cutoff score level above which an applicant is deemed good. Allapplicants below this level are deemed bad.5. Add the inferred goods and bads back in with the KGB’s and rebuild thescorecard.C op yr i g h t 2 0 1 2 , S A S I n s t i t u t e I n c . A l l r i g h t s r es er v e d .
CREDIT SCORING REJECT INFERENCE – TECHNIQUESParcelling Augmentation1.Build a scorecard model using the known good/bad population.2.Score the rejected applicants with this model to obtain each rejected applicant’s probability ofdefault.3.Create weighted cases for the rejected applicants.4.The inferred good/bad status of the rejected applicants will be assigned randomly and proportionalto the number of goods and bads in the accepted population within each score range.5.If desired, apply the event rate increase factor to P(bad) to increase the proportion of bads amongthe rejects (rule of thumb 2-8 times that of the accepted applicants)6.Add the inferred goods back in with the known goods and bads and rebuild the scorecard.C op yr i g h t 2 0 1 2 , S A S I n s t i t u t e I n c . A l l r i g h t s r es er v e d .
CREDIT SCORING REJECT INFERENCE – TECHNIQUESFuzzy Augmentation1. Build a scorecard model using the known good/bad population and score the rejectedapplicants with this model to obtain the probability of the rejected applicant being agood (P(good)) and the probability of being a bad (P(bad)).2. Do not assign a reject to a good/bad class. Instead, create two weighted cases foreach rejected applicant using P(good) and P(bad).3. Multiply P(good) and P(bad) by the user-specified rejection rate to form frequencyvariables.4. Results are in two observations for the rejected applicants. One observation has afrequency variables (rejection weight *P(good)) and a target variable value of 0. Theother observation has a frequency variable (rejection weight*P(bad)) and a targetvariable value of 1.C op yr i g h t 2 0 1 2 , S A S I n s t i t u t e I n c . A l l r i g h t s r es er v e d .
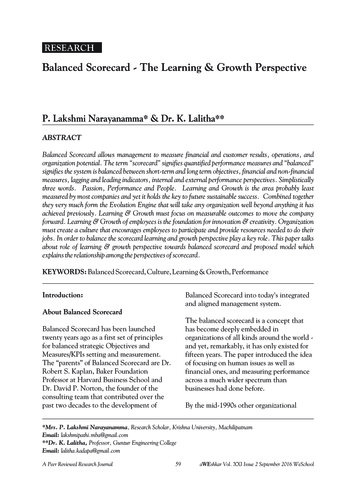
CREDIT SCORING EM – APPLICATION SCORECARD DEVELOPMENTInput Data Source:Contains informationon historic KnownGood BadsData Partition: Divisionof raw data intotraining and validationVariable Clustering:Select best subset ofindependent variablesInteractive Grouping:Optimal coarse andfine categorisation ofinputsScorecard: LogisticRegression model topredict a customer’sprobability of defaultC op yr i g h t 2 0 1 2 , S A S I n s t i t u t e I n c . A l l r i g h t s r es er v e d .
CREDIT SCORING EM – APPLICATION SCORECARD DEVELOPMENTReject Inference:Inferred rejectedpopulation outcomeC op yr i g h t 2 0 1 2 , S A S I n s t i t u t e I n c . A l l r i g h t s r es er v e d .Data Partition: Divisionof augmented sampleinto training andvalidationFinal augmented GoodBad model
CREDIT SCORING SCORECARD DEPLOYMENT Model Deployment Application of model in business processes for delivery of extracted knowledge in theright time to the right people Realises model value by providing decision support Integration requires scoring code in appropriate language Score code includes all data transformation of the scorecard process produced in SAS, C, Java and in-database (Teradata) Enables batch and real-time scoring in SAS, databases and on the web Metadata Integration into SAS Business Analytics FrameworkC op yr i g h t 2 0 1 2 , S A S I n s t i t u t e I n c . A l l r i g h t s r es er v e d .
CREDIT SCORING DEMONSTRATION EM – Application ScorecardC op yr i g h t 2 0 1 2 , S A S I n s t i t u t e I n c . A l l r i g h t s r es er v e d .
MODEL VALIDATION AND REPORTINGC op yr i g h t 2 0 1 2 , S A S I n s t i t u t e I n c . A l l r i g h t s r es er v e d .
MODEL VALIDATIONMODEL MONITORINGAND REPORTING Three types of model quality criteria are monitored Model stabilityModel performanceModel calibrationMultiple statistical indicators suggested under Basel Committee WorkingPaperAdditionally indicators for monitoring LGD and CCF modelsC op yr i g h t 2 0 1 2 , S A S I n s t i t u t e I n c . A l l r i g h t s r es er v e d .
MODEL VALIDATIONMODEL STABILITYAND REPORTING Important for detecting population shifts, for example for pre-deploymentsanity check Is the distribution of scores still similar to when you developed the model? Have you now more high (low) scoring customers then previously?C op yr i g h t 2 0 1 2 , S A S I n s t i t u t e I n c . A l l r i g h t s r es er v e d .
MODEL VALIDATIONSTABILITY – SYSTEM STABILITY INDEXAND REPORTING A measure used to monitor the score distribution:C op yr i g h t 2 0 1 2 , S A S I n s t i t u t e I n c . A l l r i g h t s r es er v e d .
MODEL VALIDATIONMODEL PERFORMANCEAND REPORTING Important for ensuring high quality pooling andapproval decisions Do the bad customers have low scores?Do the good customers have high scores?To what degree do the score distributions of goodand bad customers overlap?How well does the model separate the good from thebad customers?How many of all bad customers can you find withinthe low scoring customers?C op yr i g h t 2 0 1 2 , S A S I n s t i t u t e I n c . A l l r i g h t s r es er v e d .
MODEL VALIDATIONMODEL CALIBRATIONAND REPORTING Validation of the calibration is more complex than the validation of thediscriminatory power of internal rating systems To transform a PD from a score, direct or indirect methods can be used Important for ensuring correct risk assessment, for example Risk WeightedAssets calculation How similar are predicted default rates to actual default rates? Are the differences significant?C op yr i g h t 2 0 1 2 , S A S I n s t i t u t e I n c . A l l r i g h t s r es er v e d .
MODEL VALIDATIONCALIBRATION – OBSERVED VS. ESTIMATED INDEXAND REPORTING Measures the “closeness” of observed vs. estimated default ratesC op yr i g h t 2 0 1 2 , S A S I n s t i t u t e I n c . A l l r i g h t s r es er v e d .
SAS MODELREGULATORY BASEL 2 REPORTINGMANAGERREPORTING FOR FS REGULATORS BASED ONBASEL 2 REQUIREMENTS Probability –of-Default (PD) and Loss-GivenDefault (LGD) model performance monitoringCalculation of 30 model performance statistics Model StabilityModel PerformanceModel Calibration Customizable traffic lighting Trend time series chartsC op yr i g h t 2 0 1 2 , S A S I n s t i t u t e I n c . A l l r i g h t s r es er v e d .MonitorModelPerformance
SUMMARYC op yr i g h t 2 0 1 2 , S A S I n s t i t u t e I n c . A l l r i g h t s r es er v e d .
SUMMARY HOW TO LEVERAGE SAS ENTERPRISE MINER FOR CREDITRISK MODELLINGMake accurate and timely risk calculations to improve Approval processes Risk management Basel compliancy Collection management Provides In–house model development A-IRB models Flexible model deployment Out-of-the-box reportingC op yr i g h t 2 0 1 2 , S A S I n s t i t u t e I n c . A l l r i g h t s r es er v e d .
QUESTIONS AND ANSWERSIAIN.BROWN@SAS.COMC op yr i g h t 2 0 1 2 , S A S I n s t i t u t e I n c . A l l r i g h t s r es er v e d .www.SAS.com
practice to perform 'Reject Inference': apply the scorecard to the rejects and classify rejects as inferred good / inferred bad. An 'augmented' input data set then is created by adding the inferred good / bad to the actual good / bad. The scorecard is re-adjusted using this data set.