Transcription
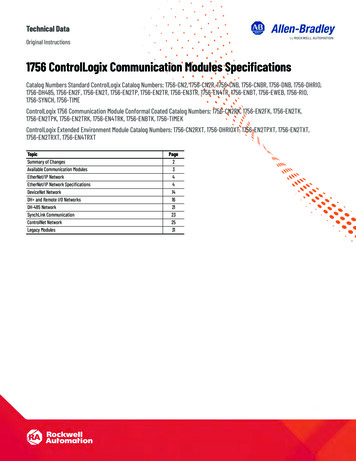
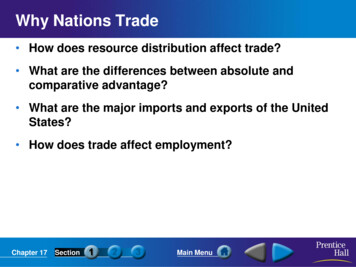
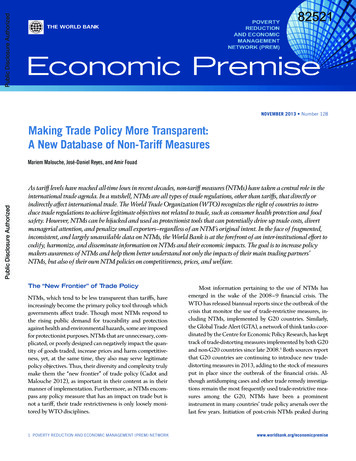
Public Disclosure AuthorizedPublic Disclosure AuthorizedPublic Disclosure Authorized82521NOVEMBER 2013 Number 128Making Trade Policy More Transparent:A New Database of Non-Tariff MeasuresMariem Malouche, José-Daniel Reyes, and Amir FouadAs tariff levels have reached all-time lows in recent decades, non-tariff measures (NTMs) have taken a central role in theinternational trade agenda. In a nutshell, NTMs are all types of trade regulations, other than tariffs, that directly orindirectly affect international trade. The World Trade Organization (WTO) recognizes the right of countries to introduce trade regulations to achieve legitimate objectives not related to trade, such as consumer health protection and foodsafety. However, NTMs can be hijacked and used as protectionist tools that can potentially drive up trade costs, divertmanagerial attention, and penalize small exporters—regardless of an NTM’s original intent. In the face of fragmented,inconsistent, and largely unavailable data on NTMs, the World Bank is at the forefront of an inter-institutional effort tocodify, harmonize, and disseminate information on NTMs and their economic impacts. The goal is to increase policymakers awareness of NTMs and help them better understand not only the impacts of their main trading partners’NTMs, but also of their own NTM policies on competitiveness, prices, and welfare.Public Disclosure AuthorizedThe “New Frontier” of Trade PolicyNTMs, which tend to be less transparent than tariffs, haveincreasingly become the primary policy tool through whichgovernments affect trade. Though most NTMs respond tothe rising public demand for traceability and protectionagainst health and environmental hazards, some are imposedfor protectionist purposes. NTMs that are unnecessary, complicated, or poorly designed can negatively impact the quantity of goods traded, increase prices and harm competitiveness, yet, at the same time, they also may serve legitimatepolicy objectives. Thus, their diversity and complexity trulymake them the “new frontier” of trade policy (Cadot andMalouche 2012), as important in their content as in theirmanner of implementation. Furthermore, as NTMs encompass any policy measure that has an impact on trade but isnot a tariff, their trade restrictiveness is only loosely monitored by WTO disciplines.Most information pertaining to the use of NTMs hasemerged in the wake of the 2008–9 financial crisis. TheWTO has released biannual reports since the outbreak of thecrisis that monitor the use of trade-restrictive measures, including NTMs, implemented by G20 countries. Similarly,the Global Trade Alert (GTA), a network of think tanks coordinated by the Centre for Economic Policy Research, has kepttrack of trade-distorting measures implemented by both G20and non-G20 countries since late 2008.1 Both sources reportthat G20 countries are continuing to introduce new tradedistorting measures in 2013, adding to the stock of measuresput in place since the outbreak of the financial crisis. Although antidumping cases and other trade remedy investigations remain the most frequently used trade-restrictive measures among the G20, NTMs have been a prominentinstrument in many countries’ trade policy arsenals over thelast few years. Initiation of post-crisis NTMs peaked during1 POVERTY REDUCTION AND ECONOMIC MANAGEMENT (PREM) NETWORKwww.worldbank.org/economicpremise
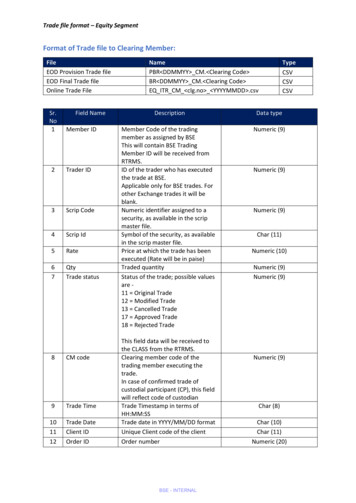
mid-2010 to mid-2012, when they accounted for over onethird of newly introduced trade-distorting measures (figure1). According to the GTA, “governments have become verycreative in evading WTO disciplines” (Evenett 2013).The latest WTO monitoring report indicates that importrequirements and restrictions persist as the most commonlyintroduced NTMs, at just over 25 percent of all such measures implemented by G20 countries since the crisis began,and nearly 30 percent of such measures since October 2011(figure 2). Furthermore, only 15.4 percent of G20-imposedNTMs have been removed to date, or are scheduled to be removed (WTO 2013). Argentina’s 20 NTMs since October2011—mostly in the form of new import and export requirements—make it the most prolific introducer of new NTMsover the last two years, while its total stock of post-crisisNTMs is surpassed only by India, and trailed closely by Indonesia and China (WTO 2013).In addition to technical import requirements that act astrade barriers, legislation related to national preference is alsoon the rise in emerging-market G20 countries, with Braziland India accounting for nearly half of such measures. Theselaws include “buy national” provisions, tax exemptions andprice preferences for products with locally produced inputs,as well as discriminatory public procurement policies. In January 2013, for example, Brazil stipulated preference in government procurement for locally produced vehicles, and didthe same for information technology products four monthslater (although the latter NTM is explicitly time bound). Onone hand, policies like these can be interpreted as protectionist attempts to nurture domestic industry; on the other hand,they are sometimes couched in explicit language to the contrary, as in the case of India’s prioritization of locally producedelectronic products “due to security considerations.”As has been true since the beginning of the financial crisis, NTMs on exports continue to account for nearly onethird of G20-imposed NTMs. About half of export-relatedNTMs come in the form of technical requirements or restrictions (primarily on agricultural products), and the vastmajority of all post-crisis export NTMs have been imple-mented by Argentina, China, and India. In Argentina’s case,the restrictions are mainly detailed, technical lists of “criterion” and “reference” values for myriad agricultural and mineral products. Conversely, the latter two countries are morefrequent users of export quotas (for example, rare-earthminerals in China) and bans (for example, on wheat, rice,onions, and edible oils in India). Tax rebates and other export incentives account for approximately 6 percent ofNTMs implemented since late 2011, most recently by Brazilfor its production of motor vehicles.The Need for Data TransparencyMost countries do not have a unique repository for NTM databecause laws and regulations affecting trade are often promulgated by different government agencies and regulatory bodies.Traders struggle to keep tabs on the latest measures affectingthe goods they import and export, while policy makers find itdifficult to identify areas for reform in their efforts to improvethe domestic business environment for traders. Furthermore,NTMs are often conflated with more explicit “non-tariff barriers,”2 leading to calls for their complete removal. But given thelegality or potential legitimacy of NTMs, the onus for policymakers should be not on suppression, but instead on lesseningthe trade restrictiveness of NTMs in general, and on reducingtheir administrative burden on users. Unfortunately, NTMdata are typically fragmented and incomplete, plagued by alack of a shared terminology, insufficient country coverage,and inconsistent collection procedures (WTO 2012). Thelongtime lack of a standard definition and absence of a globaldatabase have proven to be continuing impediments to effectively addressing the negative impacts of NTMs.Figure 2. New G20 NTMs, October 2011 – May 2013export bans, 3%export quotas, 6%June 2009– June 2010– June 2011– June 2012–May 2010 May 2011 May 2012 May 2013Source: Authors’ calculations using data from WTO (2013).importquotas, 6%other,c 10%4035302520151050nationalpreference,17%% of total# of NTMsNTM share of total trade-restrictive measuresNTMsimportlicensing, 6%importrestrictions,a29%Figure 1. Number of NTMs Implemented by the G20 sinceJune 200980706050403020100exportincentives,d 6%exportrestrictions,b16%Source: Authors’ calculations using data from WTO (2013).a. Includes new import requirements, registration, “criterion” and “reference”values, and new administrative procedures.b. Includes new export requirements, registration, “criterion” and “reference”values, and new administrative procedures.c. Includes inspections, tariff rate quotas, and licensing and other requirementsapplied to both imports and exports.d. Includes tax refunds, tax breaks, and export financing.2 POVERTY REDUCTION AND ECONOMIC MANAGEMENT (PREM) NETWORKwww.worldbank.org/economicpremise
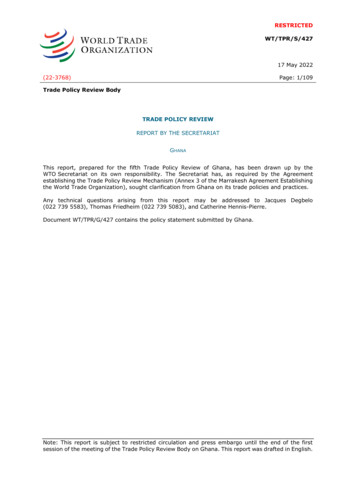
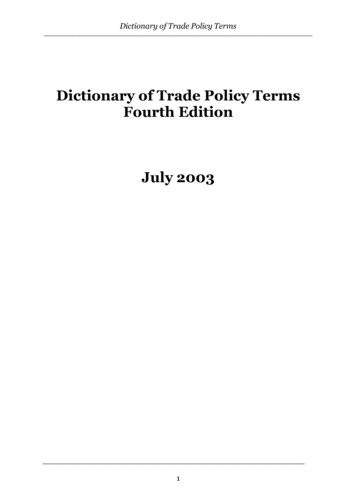
In addition to its post-crisis monitoring of G20 countries, the WTO has a trade policy notification system, thoughnot one intended to compile a comprehensive database of anykind. Rather, WTO notifications act as a forum for partnercountries to see drafts of regulations when amendments arestill possible. Consequently, the WTO’s more than 200 different notification requirements—which regrettably excludeNTMs such as finance measures, distribution restrictions, orrestrictions on post-sale services—are noncompulsory to beginwith and include no penalty for noncompliance (Bacchetta,Richtering, and Santana 2012).3 Meanwhile, the aforementioned GTA maintains a list of every state initiative that haspotential implications for foreign commercial interests, fromthose “as broad in scope as a state budget or as narrow as atariff increase on a single product” (Evenett 2009). While theGTA initiative provides greater transparency and monitoringof trade policy instruments, including NTMs, its extensivescope and lack of a codified classification system do little to fillthe void of a comprehensive, NTM-specific data source basedon a unified definition.In 2006, the United Nations Conference on Trade andDevelopment (UNCTAD) initiated a more ambitious andpromising initiative on NTM data collection. It commissioned the Multi-Agency Support Team (MAST)4 to discussthe definition, classification, collection, and quantification ofNTMs. A multiagency effort known as Transparency in Trade(TNT) was subsequently launched to improve the collection,uniformity and availability of NTM data, as well as to minimize inconsistencies within existing data. Since 2009, localconsultants have been tasked with drawing up NTM inventories in collaboration with ministries and agencies in 48 countries (figure 3). Under the stewardship of UNCTAD, the dataare scrutinized for possible duplications, omissions or anyother problems to minimize inaccuracies, and then undergoverification and formatting.The data collection is a work in progress. As more researchers work with the data, the cleaning process has beenimproving, but some deficiencies remain as a result of theheterogeneity in terms of the way the data are collected. Inaddition, researchers should be aware that many trade-related policies appearing in inventories are not binding, andthus have no observable effect on trade (for example, lowering the quantities traded or raising import prices), but asnon-tariff trade policies they have been included in the database as NTMs. Nevertheless, although not yet perfect, thedata collected by the TNT initiative constitute the bestavailable information on NTM coverage levels across 46 developing countries, plus the European Union and Japan.5Due to their uniform classification system, the data allowfor cross-country comparisons as well as long-term capacitybuilding. Data for 33 of the countries have been made publicly available in the World Integrated Trade Solution(WITS) database, a free Web-based database hosted by theWorld Bank.6Figure 3. Countries with NTM Data CollectedSource: Authors’ illustration.Note: Color coded by World Bank Region.3 POVERTY REDUCTION AND ECONOMIC MANAGEMENT (PREM) NETWORKwww.worldbank.org/economicpremise
Quantifying NTMsInternational harmonization of NTM nomenclature has beena central pillar of the overall effort to increase NTM transparency. Harmonization is critical for governments, analysts, andtraders to compare NTMs across countries, as well as providethem with a snapshot of: NTM prevalence by sector, differenttypes of NTMs, the number of NTMs by product, and thenumber of government bodies issuing NTMs. The MAST,commissioned by UNCTAD, developed a tree-like nomenclature for NTMs categorized into 16 “branches” (chapters),which are further disaggregated into “sub-branches” (onedigit), “twigs” (two digits), and “leaves” (three digits) for aneven more precise classification of NTMs (UNCTAD 2012).7The classification system is intended neither to expose hidden protectionist agendas nor pass judgment on the economicimpact of NTMs perceived or otherwise, rather it is envisioned solely as an objective categorization tool.For imported products, NTMs are broadly split into twocategories: (i) technical measures (chapters A through C) thatessentially pertain to the characteristics of products or theproduction process behind them; and (ii) nontechnical measures (chapters D through O) that represent standard commercial policy tools. A food-related technical measure, forexample, might be the prohibition of poultry imports fromareas affected with avian flu (chapter A1), or a testing requirement on fruit imports to check against the maximum residuelevel of pesticide (chapter A8). On the nontechnical side, acountry might only grant licenses to import gasoline if domestic supply is insufficient (chapter E), or impose a levy if thegovernment’s target price for an import exceeds the worldprice (chapter F). Meanwhile, all export-related incentives,quotas, bans, and other restrictions are lumped together inchapter P. Table 1 presents the NTM nomenclature at thehighest level of aggregation. To date, systematic data have onlybeen collected on chapters A through I (as well as some datafor chapter P), demonstrating the relative infancy of thesetransparency efforts.Data Transparency BenefitsImportsNTM data transparency efforts underscore the need to knowmore about the occurrence of NTMs at the country and regional level. In other words, one of the most obvious and important benefits of increased access to NTM data is the abilityto compute the incidence of NTMs around the world, whichcan be done using two indicators: the frequency ratio, whichmeasures the proportion of products8 covered by one or moreNTMs, and the coverage ratio, which measures the proportionof import value covered by one or more NTMs.9These two measures provide helpful snapshots of howpopular NTM use is within and across countries. The SouthAsia region, for example, is the most prevalent user of NTMs,with average frequency and coverage ratios of 80 and 84 percent, respectively, compared to 44.2 and 56.4 percent, respectively, in Sub-Saharan Africa (figure 4). Furthermore, frequency and coverage ratios can provide stark illustrations ofthe heterogeneity of NTM use within regions. In South Asia,for example, Pakistan, Nepal, Sri Lanka, and India all apply atleast one NTM to every product that is imported, while Bangladesh and Afghanistan apply at least one NTMTable 1. NTM Classificationto only 48.6 and 31.5 percent of imported prodA. Sanitary and Phytosanitary Measuresucts, respectively (figure 5). This large variation inTechnicalthe trade incidence of NTMs reveals how even reB. Technical Barriers to Trademeasuresgional neighbors can differ considerably with reC. Pre-Shipment Inspection and Other Formalitiesgard to their governmental priorities and apD. Contingent Trade-Protective Measuresproaches toward trade regulation, the compositionE. Non-Automatic Licensing, Quotas, Prohibition and Quantityof their import baskets, and the roles of importControl Measures Other Than for SPS or TBT Reasonscompeting sectors lobbying for domestic protecF. Price-Control Measures, including Additional Taxes and Chargestion.G. Financial MeasuresFrequency and coverage ratios analyzed by inH. Measures Affecting Competitiondividual NTM code can help deduce the relativeNon-technicalI. Trade-Related Investment Measuresimportance of given NTMs by country. In Kenya,measuresfor instance, registration requirements for importJ. Distribution Restrictionsers due to SPS reasons apply to 26.7 percent ofK. Restrictions on Post-Sales Servicesimports. This is not to say that 26.7 is a particuL. Subsidies (excluding Export Subsidies under P7)larly high or low coverage ratio in absolute terms,M. Government Procurement Restrictionsbut rather that registration requirements play aN. Intellectual Propertyleading role in the country’s NTM landscape—O. Rules of Originthat is, they happen to be among the top 15 mostfrequently observed NTMs. Kenya ranks firstExportsP. Export-Related Measureswhen comparing its use of these types of meaSource: UNCTAD 2012, 122 en.pdf.sures with other countries for which data are4 POVERTY REDUCTION AND ECONOMIC MANAGEMENT (PREM) NETWORKwww.worldbank.org/economicpremise
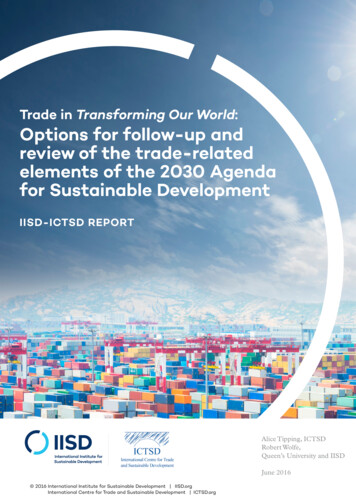
Using NTM Data to Inform PolicyFigure 4. World Frequency and Coverage Ratios by RegionSAR 80.0LAC84.4Observing frequency and coverage ratios ishelpful in understanding the prevalence ofEAP54.654.6NTMs, but does little to elucidate their ecoMNA49.359.0nomic consequences, such as their impact onECA44.956.6private sector competitiveness or consumerSSA44.256.4welfare. This remains a major challenge for pol10050050100icy analysis, and one that the TNT initiativecoverage ratiofrequency ratioaims to address, particularly because NTMsSource: Authors’ illustration.have evolved over time as tools to achieve domestic policy goals. The economic impact ofFigure 5. South Asia Frequency and Coverage Ratios by CountryNTMs can be captured, for instance, by usingNTM data to examine the effect of NTMs onPakistan 99.9899.97domestic prices. Since NTMs increase the costsNepal 99.98100.00of trading products across borders, firms enSri Lanka 99.9899.99gaged in international trade may transfer part ofIndia 100.00100.00this extra cost to the final price of the productBangladeshsold in the market. Preliminary tests of this ef48.5944.99fect using the newly available data suggest thatAfghanistan31.5461.21NTMs increase domestic prices by an average of150100500501001508.7 percent worldwide (Kelleher and Reyescoverage ratiofrequency ratioforthcoming).Source: Authors’ illustration.The price-raising effect of NTMs may especiallyhurtconsumerwelfare and increase poverty if the affectavailable (figure 6). Putting a country’s NTM use into thisedproductsareimportantto a consumer’s expenditure basket.kind of comparative perspective can spark interesting debateTounderstandtheimpactofNTMs on the poorest consumers,at the policy level. Further investigation as to whether therepolicy analysts should combine NTM data with household suris a legitimate reason behind the large coverage ratio of thisveys. A simulation removing government-imposed importNTM or if there is a political economy story lurking behindbans in Nigeria showed that such a removal would drasticallyKenya’s heavy use of registration requirements may provereduce the domestic price of 27 staple consumer products. Inuseful in suggesting policies to streamline their use.addition, real incomes would increase by an average of 9.4 perThe ability to parse out NTM implementation at thecent and lift 3.3 million Nigerians out of poverty (Treichel etproduct and economic sector level has major implications foral. 2012).regional integration efforts, as the data can clearly indicateThe price-raising effect of NTMs may also hurt the comwhether a country’s composition of NTMs is directed towardpetitiveness of the private sector if the affected products area particular trading partner (or region). By comparing the covimportant imported inputs. Import and export data at theerage ratio computed using total imports to the54.1Figure 6. Registration Requirements for Importers Due to SPS Reasons (A150),Coverage Ratios30 10.1KenyaauritGu iusatemalHon adurasLaoEl PDSa RlvadoNricEuarroagpeuaanUnionInCo diastaRicaNamibiaTunisiU agandSoauthAfrica05.0Mcoverage ratio computed using regional imports, itis possible to gain insight into whether or not anNTM disproportionately affects regional trade(the same could be done to single out an individual trading partner rather than a whole region). Figure 7 shows how TBT measures in Central America, for example, are relatively balanced acrosstrading partners, while SPS measures (located primarily above the 45 degree line) fall heavily on imports from regional neighbors. In other words, thenewly available NTM data provide a useful tool fordiscussions on regional integration and regionaltrade, particularly when the data corroborate existing feelings within the private sector that NTMsare affecting regional integration.1060.0Source: Authors’ illustration.5 POVERTY REDUCTION AND ECONOMIC MANAGEMENT (PREM) NETWORKwww.worldbank.org/economicpremise
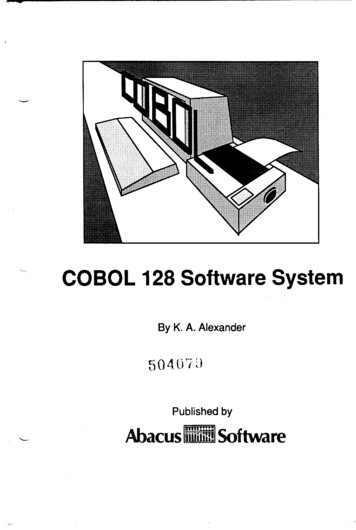
Figure 7. Incidence of NTMs in Central American IntraregionalTrade (Coverage Ratio)publication, Streamlining Non-Tariff Measures: A Toolkit forPolicy Makers (Cadot, Malouche, and Sáez 2012), providesguidelines on conducting such an NTM review, including relevant questionnaires and examples of analytical tools such ascost-benefit analysis and the standard cost model.125040Acknowledgment30The authors are grateful to Michael Ferrantino for his valuable input on earlier drafts of this note.20About the Authors10001020SPS304050TBTSource: Authors’ illustration.Note: The scatter plot compares total coverage ratios, computed using total imports(x-axis), versus regional coverage ratios, computed using regional imports (y-axis),for SPS and TBT measures. Each dot represents an NTM code at the highest levelof disaggregation. Data are plotted for Guatemala, Honduras, El Salvador, CostaRica, and Nicaragua.firm level, combined with NTM data, can show how NTMson imported inputs affect the behavior and performance ofexporters in terms of export volumes, diversification, andquality. Similarly, the adoption of a new NTM, such as a newEU-imposed standard, could be analyzed in terms of the export dynamism, quality, and trade creation and diversion itcreates. In Morocco, for example, a forthcoming study linksNTMs adopted to harmonize to international standards from2002–10 with firm-level export data over the same period.The study finds that the introduction of these harmonizedNTMs not only favors exports from existing firms over the entry of new firms into the market, but it also has a positive effect on new product creation by those firms (Augier, Dovis,and Jaud forthcoming).NTM data allow for a deep and thorough analysis ofspecific NTMs, such as those that repeatedly surface inNTM prevalence studies or are identified in interviews withthe private sector and other stakeholders. Policy leaders cancommit to reducing these burdensome NTMs (and to conducting a broader NTM review), but doing so requires thecoordination and cooperation of several ministries and government agencies. When several NTMs affect a single product and are issued by various ministries, the likelihood ofburdensome administrative procedures and duplication ishigh.11The new transparent NTM data inventory can pinpointkey information (for example, the number of NTMs affectingeach product and the ministries and government agencies responsible for individual NTMs) to assist governments in establishing a work program for NTM review. The World BankMariem Malouche is a Senior Economist in the Middle East andNorth Africa Region; José-Daniel Reyes is an Economist in the International Trade Unit (PRMTR) of the Poverty Reduction andEconomic Management Network (PREM); and Amir Fouad is aCommunications and Research Analyst also in PRMTR, PREM.Notes1. The GTA’s coverage of policies includes any measure thatcould conceivably impact foreign commercial interests, andthus extends beyond the WTO metric to include measuressuch as migration and investment restrictions, state aids andbailouts, and trade finance measures.2. NTMs are considered non-tariff barriers when they haveclear protectionist intent or they affect trade more than necessary to address a domestic policy objective. However, NTMsoften have legitimate non-trade-related policy objectives suchas consumer health or food safety.3. Governments may simply choose not to adhere to notification requirements, either due to logistical difficulties (Bacchetta, Richtering, and Santana 2012) or concern that notifications will expose their NTMs to scrutiny or objection.Furthermore, the quality of notifications varies widely, withprecise information on certain NTM dimensions often missing, such as product coverage or the time period during whichthe measure remains in place.4. The MAST comprises representatives from the Food andAgriculture Organization of the United Nations, the International Monetary Fund, the International Trade Centre, theOrganisation for Economic Co-operation and Development,the United Nations Industrial Development Organization,the World Bank, and the WTO.5. The data collection effort should ideally become government driven, as in Indonesia (LATRAS database) and the LaoPeople’s Democratic Republic (trade portal). It could also beregionally driven, such as the ALADI database for NTMs inLatin America and the Caribbean, or the Association ofSoutheastern Asian Nations project to collect data and adopta roadmap to streamline NTMs.6. The data for Bangladesh, Cambodia, El Salvador, Honduras, Indonesia, Kenya, Malawi, Nicaragua, the Philippines, the6 POVERTY REDUCTION AND ECONOMIC MANAGEMENT (PREM) NETWORKwww.worldbank.org/economicpremise
Russian Federation, Rwanda, South Africa, the Syrian ArabRepublic, Turkey, and Uganda are still under verification byUNCTAD’s statistical division.7. 122en.pdf .8. Classified at the Harmonized System’s six-digit level ofdetail.9. Neither indicator is perfect. While the frequency ratiotends to overemphasize smaller products, the coverage ratio isdominated by the role of products with large import value,thus tending to underestimate the overall restrictiveness ofNTMs. Both indicators are, however, highly correlated.10. This was found to be the case in a recent report that theInternational Trade Unit produced for the Central Americanregion.11. In most countries, at least five ministries are responsiblefor most NTMs, and other than the ministry of trade, mosthave policy mandates unrelated to trade competitivenessand diversification. Such ministries do not always considerthe least trade-restrictive measure or consult with government partners and the private sector about the differentpolicy instruments that would help achieve the policy objective without hurting firm competitiveness and consumerwelfare.12. The ASEAN Secretariat (ASEC) NTM review programwas based on the classification of NTMs according to WTOprinciples: measures are transparent; measures do not discriminate; SPS measures have a scientific basis; and there is nobetter, least trade-restrictive alternative. ASEC specifically accounted for nontrade regulatory objectives such as revenuegeneration and protection of health and safety of consumers,and introduced the concept of Trade Impact Criterion to estimate the relative effects of a given NTM on welfare.ReferencesAugier, P., M. Dovis, and M. Jaud. Forthcoming. “Impact of NonTariffs Measures on Firms’ Export Dynamics in Morocco.”World Bank, Washington, DC.Bacchetta, M., J. Richtering, and R. Santana. 2012. “How MuchLight Do WTO Notifications Shed on NTMs?” In Non-TariffMeasures: A Fresh Look at Trade Policy’s New Frontier, ed. O.Cadot and M. Malouche. Washington, DC: World Bank/Centrefor Economic Policy Research.Cadot, O., and M. Malouche. 2012. Non-Tariff Measures: A FreshLook at Trade Policy’s New Frontier. Washington, DC: WorldBank/Centre for Economic Policy Research.Cadot, O., M. Malouche, and S. Sáez. 2012. Streamlining Non-TariffMeasures: A Toolkit for Policy Makers. Washington, DC: WorldBank.Evenett, S. J. 2009. “Global Trade Alert: Motivation and Launch.”Global Trade Alert, University of St. Gallen/Centre for Economic Policy Research.———. 2013. “Protectionism’s Quiet Return: GTA’s Pre-G8 Summit Report.” Global Trade Alert, Centre for Economic PolicyResearch.Kelleher, S., and J.-D. Reyes. Forthcoming. “Non-Tariff Measuresin Central America: Incidence, Price Effects, and Consumers’Welfare.” World Bank, Washington, DC.Treichel, V., M. Hoppe, O. Cadot, and J. Gourdon. 2012. “ImportBans in Nigeria Increase Poverty.” Africa Trade Policy Note No.28, World Bank, Washington, DC.UNCTAD (United Nations Conference on Trade and Development). 2012. Classification of Non-Tariff Measures. Geneva.WTO (World Trade Organization). 2012. World Trade Report 2012:Trade and Public Policies: A Closer Look at Non-Tariff Measures inthe 21st Century. Geneva.———. 2013. Report on G20 Trade and Investment Measures. Geneva.The Economic Premise note series is intended to summarize good practices and key policy findings on topics related to economic policy. They are produced by the PovertyReduction and Economic Management (PREM) Network Vice-Presidency of the World Bank. The views expressed here are those of the authors and do not necessarily reflectthose of the World Bank. The notes are available at: www.worldbank.org/economicpremise.7 POVERTY REDUCTION AND ECONOMIC MANAGEMENT (PREM) NETWORKwww.worldbank.org/economicpremise
A New Database of Non-Tariff Measures As tariff levels have reached all-time lows in recent decades, non-tariff measures (NTMs) have taken a central role in the international trade agenda. In a nutshell, NTMs are all types of trade regulations, other than tariffs, that directly or indirectly affect international trade.