Transcription
Investor PresentationFebruary 2022Proprietary InformationProprietary Information1
DisclaimerThis presentation contains forward-looking statements. All statements other than statements of historical facts contained in this presentation, including statements regarding possible or assumedfuture results of operations, business strategies, development plans, regulatory activities, competitive position, potential growth opportunities, & the effects of competition are forward-lookingstatements. These statements involve known & unknown risks, uncertainties & other important factors that may cause actual results, performance or achievements of EverQuote, Inc. (“theCompany”) to be materially different from any future results, performance or achievements expressed or implied by the forward-looking statements. In some cases, you can identifyforward-looking statements by terms such as “may,” “should,” “expect,” “plan,” “project,” “estimate,” “guidance,” or “potential” or the negative of these terms or other similar expressions. Theforward-looking statements in this presentation are only predictions. The Company has based these forward-looking statements largely on its current expectations & projections about futureevents & financial trends that it believes may affect the Company’s business, financial condition & results of operations. These forward-looking statements speak only as of the date of thispresentation & are subject to a number of risks, uncertainties & assumptions, some of which cannot be predicted or quantified & some of which are beyond the Company’s control. The events &circumstances reflected in the Company’s forward-looking statements may not be achieved or occur, & actual results could differ materially from those projected in the forward-lookingstatements, including as a result of: (1) the Company’s ability to attract and retain consumers and insurance providers using the Company’s marketplace; (2) the Company’s ability to maintain orincrease the amount providers spend per quote request; (3) the impact on the Company and the insurance industry of the COVID-19 pandemic; (4) the effectiveness of the Company’s growthstrategies and its ability to effectively manage growth; (5) the Company’s ability to maintain and build its brand; (6) the Company’s reliance on its third-party service providers; (7) the Company’sability to develop new and enhanced products and services to attract and retain consumers and insurance providers, and the Company’s ability to successfully monetize them; (8) the impact ofcompetition in the Company’s industry and innovation by the Company’s competitors; (9) the expected recovery of the auto insurance industry; (10) developments regarding the insurance industryand the transition to online marketing; (11) the Company’s ability to successfully operate PolicyFuel; (12) the Company’s ability to successfully remediate the material weaknesses identified in theCompany’s internal controls over financial reporting; and (13) as a result of the risks described in the “Risk Factors” section of the Company’s most recent Annual Report on Form 10-K, QuarterlyReport on Form 10-Q & the other filings that the Company makes with the Securities & Exchange Commission from time to time. Moreover, new risk factors & uncertainties may emerge from timeto time, & it is not possible for management to predict all risk factors & uncertainties that the Company may face. Except as required by applicable law, the Company does not plan to publiclyupdate or revise any forward-looking statements contained herein, whether as a result of any new information, future events, changed circumstances or otherwise.The Company’s presentation also contains estimates, projections, & other information concerning the Company’s industry, the Company’s business & the markets for certain of the Company’sproducts & services, including data regarding the estimated size of those markets. Information that is based on estimates, forecasts, projections, market research, or similar methodologies isinherently subject to uncertainties & actual events or circumstances may differ materially from events & circumstances reflected in this information. Unless otherwise expressly stated, theCompany obtained this industry, business, market & other data from reports, research surveys, studies & similar data prepared by market research firms & other third parties, from industry, generalpublications, & from government data & similar sources.The Company presents Adjusted EBITDA as a non-GAAP measure, which is not a substitute for or superior to, other measures of financial performance prepared in accordance with U.S. GAAP. Areconciliation of Adjusted EBITDA to the most directly comparable GAAP measure is included in the Appendix to these slides.Proprietary Information2
Our visionBecome the largest online source of insurance policiesby using data and technology to make insurance simpler, moreaffordable and personalized, ultimately reducing cost and risk.Proprietary Information3
Key Investment HighlightsInsurance Marketplace LeaderLeading multi-vertical online insurance marketplace providingcompelling benefits for consumers and insurance providersMassive Market Opportunity 154b in annual insurance distribution and advertising spend inthe early phases of shifting online provides multi-year tailwindProprietary Tech and DataProprietary platforms built on highly integrated machinelearning assets support rapid growth and drive network effectsExtensive DistributionExtensive distribution channels with third-party marketplace(carriers and local agents) and first-party DTCA offeringsDiversified Business ModelMulti-vertical insurance market with diversified distributionchannels creates resilience in business modelCompelling Financial ModelTargeting 20 % average annual revenue growth over thelong-term with expanding Adjusted EBITDA margin21. “DTCA” refers to Direct-to-Consumer Agency2. Based on the compound annual growth rate (CAGR) from 2016 – 2021 of Revenue and Adjusted EBITDA of 28% and 37%, respectively. Company anticipates industry headwinds will result incurrent year growth below long-term targets.Proprietary Information4
Company Snapshot One of the insurance industry’s largest online customeracquisition and distribution platforms 3rd party Marketplace with 100 carriers and 8,500 localagents; 1st party DTCA platform with 200 agents Diversified model serving consumers and providers in the auto,home & renters, life and health insurance markets Highly scalable, proprietary platform powered by deeplyintegrated machine learning and data assets Founded by MIT alumni in 2011 with headquarters inCambridge, MA; IPO in summer 20181.2.3.4.28%31%26%95%RevenueCAGR (5yr)1VMM2CAGR (5yr)1Non-Auto3CAGR (5yr)13.8x4.4x3.4xYoY DTCA4revenue growthYoY DTCA4policy growthYoY DTCA4agent growthInsurance verticalsAutoHome & RentersLifeHealthBased on the compound annual growth rate (CAGR) from 2016 – 2021;“VMM” refers to Variable Marketing Margin“Non-auto” refers to non-auto insurance verticalsYear-over-year increase based on 2021 over 2020 for combined DTCA operations; policy growth based on policies submitted and agent growth based on average within the period.Proprietary Information5
Large & Expanding TAMU.S. Insurance Market:Distribution & Ad Spend1Projected AnnualGrowth to 20241 154b5%Total MarketMarket growthEVER share: 10% 16.7b16%Total AdvertisingSpendDigital spending growthEVER Share: 10% 6.5b 425m2Total DigitalSpend1.2.EverQuote 2022 revenueguidance midpointGrowth DriversContinued shift ofconsumer time spent onlineContinued shift ofacquisition spend onlineContinued shift todigitization of insuranceproducts and workflowsSource: Stax Consulting, Inc., S&P Global Market Intelligence SNL Insurance Data, IIABA and Company estimates.EverQuote is not reaffirming this guidance as of the date of this presentation & makes no statement with respect to this guidance other than such guidancewas provided by EverQuote as of February 16, 2021.Proprietary Information6
EverQuote Benefits Both Consumers & ProvidersOur platforms address challenges inherent in the highly-fragmented insurance marketConsumers save time and moneyProviders acquire consumers more efficiently Single destination for insurance needs Large volume of high intent consumers Personalized shopping experience Higher ROI from target-based consumer attributes Average savings of 600 per year1 Opportunity to acquire consumer referrals (withinMarketplace) and bound policies (within DTCA)1. Estimated average annual premium savings based on a countrywide survey in 2020 of EverQuote users that reported old & new auto premiums.Proprietary Information7
The Customer JourneyCustomer derEngagementEverQuoteMonetizationMarketplace (3rd allsLocal AgentsDTCA2 (1St nt forseveral carriers1TV / Other1.2.3.Other includes organic search, direct-to-site, inbound calls, social & other traffic sources.“DTCA” refers to Direct to Consumer Agency consisting of first party agents.“PSaaS” refers to Policy-Sales-as-a-Service offering.PSaaS3 teamsexclusive to eachcarrierPer PolicySoldProprietary Information8
Proprietary Platforms Strengthen Competitive MoatHighly integrated machine learning and data assets to support growth of all nelAutomated BiddingPersonalized UserExperiencesConsumer AlignmentAlgorithmsEnterprise & AgencyCampaignManagementMinimize Cost perAcquisitionMaximizeConversion RatesMaximize BindPerformanceMaximize Value perAcquisitionMachine learning platforms support automated selection, prediction, and anomaly detectionData Platform supports growing data assets, rapid data onboarding, and rich analytics toolsProprietary Information9
Distribution Strength of our PlatformsRepresentative Partners100 carriers available in the marketplace8,500 3rd party local agents200 1st party EverQuote agentsBased on Company data & representative of the insurance provider partners on the platform as of December 31, 2021Proprietary Information10
Creating a World-Class DTCA Platform 17.8m17.4% 14.5m PSaaS model for Auto and Home verticals; EQ agentsdedicated exclusively to selling a specific carrier’spoliciesQ4 ‘21 revenueQ4 ‘21 revenue;% of totalQ4 ‘21 Healthrevenue Independent agent model in Life and Health verticals;EQ advisors work with multiple carriers3.8x4.4x 84YoY revenuegrowthYoY policygrowthNPS2 EQ agents serve consumers in all of our insurance verticals Broadens access to the 137b commission TAM1component of insurance distribution spend shifting online Opportunity to improve shopping experience, buildlifetime consumer relationships and enhancemonetization Started in 2020 with in-house effort; complemented byacquiring CrossPointe Insurance and PolicyFuel1.2.Representative DTCA Customer Review“I can’t thank Erica enough for her patience, kindness, andcompassion she extended to me as I set up a new health care planfor my family. Also, the ability to call and email back and work withthe same person who is familiar with you and what you need isoutstanding!! Great customer service, looking forward to a longprofessional relationship.”- StephenSource: Stax Consulting, Inc., S&P Global Market Intelligence SNL Insurance Data, IIABA and Company estimates.Net Promoter Score based on surveys (November 2021 –January 2022) of consumers who submitted policies through our DTCA, the health AnnualEnrollment Period in 4Q21.Proprietary Information11
Building a Multi-Vertical Insurance DestinationWe are executing on our vision and continue to build more diversified revenue DTCAHealth &MedicareLifeHome &RentersAutoNon-AutoRevenue30%3% Service offered1.2.3.“Marketplace” refers to third party carriers and local agents.Direct to Consumer Agency (“DTCA”) refers to first party agents.Non-Auto revenues include home renters, health, and life verticals.15%18%21% Service not offeredProprietary Information12
Track-Record of Successful AcquisitionsPursued opportunities that accelerate our strategy to be the leading online destination for insurance shoppingAcquisition CriteriaBroaden marketopportunityAccelerate DTCAstrategyRecent TransactionsCrosspointe Insurance (closed September 2020) A sales and decision support agency that connects consumers to highquality health insurance in a customer-centric environment.Enhance consumerexperiencesFinancially accretiveSupport growthof carrier partnersBuild diversifiedrevenue streams Founders with deep health insurance experience; approximately 30full-time employees (many of whom are agents)PolicyFuel (closed August 2021) Digitally-enabled insurance agency offering auto and home policies via aPSaaS model; advisor teams focused exclusively on selling a carrier’sown insurance offerings to its target consumers Founders with decades of collective P&C insurance experience; a team of90 full-time employees (many of whom are agents)Proprietary Information13
Multiple Levers Driving Future GrowthExpandDTCA ncreaseProvider Coverage& BudgetDeepenConsumer & ProviderEngagementProprietary Information14
Financial OverviewProprietary Information15
Full Year 2021 Highlights Total revenues of 418.5m; a 21% YoY increase Non-auto revenues of 87.6m; a 38% YoY increaseand represents 21% of total revenue21%31%19%YoY revenuegrowthVMM as a% of revenueVMM YoYgrowth38% 14.6m17%Non-Auto YoYrevenue growthAdjustedEBITDADTCA revenuesas a % of Q4revenues Record quarter of DTCA revenues in Q4 of 17.8m,or 17% of revenues, driven by strong AnnualEnrollment Period in Health DTCA Variable Marketing Margin of 129.6m; a 19% YoYincrease and 31% as a percentage of revenues Delivered Adjusted EBITDA of 14.6m Closed PolicyFuel acquisition in Q3, adding autoand home insurance verticals to our DTCA Auto insurance headwinds in 2H21 adverselyimpacted CY21 financial performance1. Adjusted EBITDA is a non-GAAP metric, refer to financial reconciliation for additional detail.Proprietary Information16
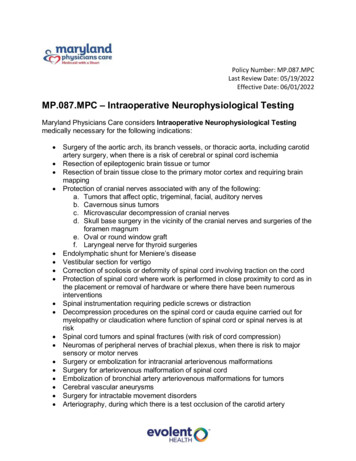
Strong Track Recordof GrowthTrack Recordof Strong GrowthRevenue ( m)28%CAGR 2016-2021 Total revenue grew 28% compounded annually 2016– 2021 Other Insurance verticals grew 95% compoundedannually 2016 – 2021 Revenue diversification by growing other insuranceverticals: Home & Renters, Life, HealthHome & RentersLifeHealthProprietary Information17
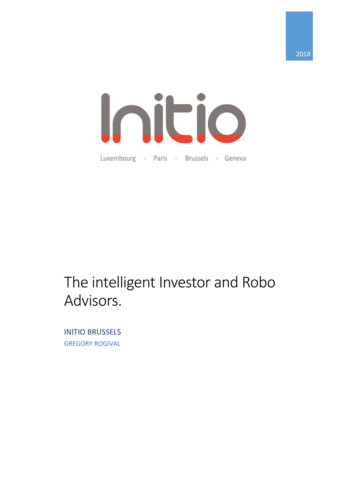
Delivering Incremental Variable Marketing MarginVariable Marketing Margin ( m)31%CAGR 2016-2021 VMM grew 31% compounded annually 2016 – 2021 Proprietary platforms have driven increasing VMM asa percentage of revenue (VMM%) since 2016 Auto insurance headwinds in 2H21 adverselyimpacted VMM and associated % Potential for incremental improvement in VMM%from higher VMM margins associated DTCA andcustomer cross-sellingVariable Marketing Margin %1. Beginning in the first quarter of 2019, we revised our definition of variable marketing margin, or VMM. The VMM displayed above reflects our revised definition of VMM forall years presented. Refer to Key Metrics Definitions in the Appendix for a definition of VMM.Proprietary Information18
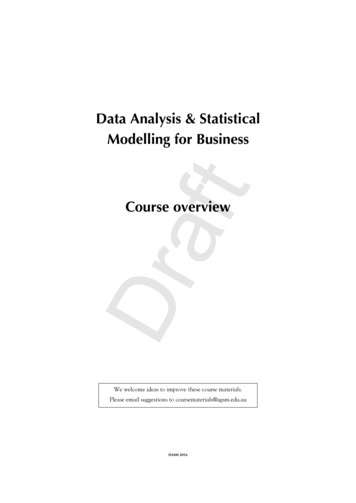
Focused on Delivering Long-term ProfitabilityAdjusted EBITDA ( m)37%CAGR 2016-2021 Adjusted EBITDA grew 37% compounded annually 2016 2021 Positioned to deliver positive full year Adjusted EBITDA inCY22, despite continued auto headwinds2018 Strategic investments in proprietary technology and dataplatforms provide key driver for long-term growth Significant opportunity for growing Adjusted EBITDAmargin by improving the efficiency of marketing costsand leveraging operating expensesNote: Adjusted EBITDA is a non-GAAP metric, refer to financial reconciliation for additional detail.Proprietary Information19
NASDAQ: EVERProprietary Information20
AppendixProprietary Information21
Key Metrics DefinitionsVariableMarketingMarginWe define variable marketing margin, or VMM, as revenue, as reported in our consolidated statements of operations andcomprehensive income (loss), less advertising costs (a component of sales and marketing expense, as reported in our statements ofoperations and comprehensive income (loss)). We use VMM to measure the efficiency of individual advertising and consumeracquisition sources and to make trade-off decisions to manage our return on advertising. We do not use VMM as a measure ofprofitability.AdjustedEBITDAWe define Adjusted EBITDA as net income (loss), adjusted to exclude: stock-based compensation expense, depreciation andamortization expense, acquisition-related costs, legal settlement expense, one-time severance charges, interest income and theprovision for (benefit from) income taxes. We monitor & present Adjusted EBITDA because it is a key measure used by ourmanagement & board of directors to understand & evaluate our operating performance, to establish budgets & to developoperational goals for managing our business.Proprietary Information22
Reconciliation of Adjusted EBITDA - 12 Months Ended12 Months Ended( in Thousands)Net income (loss)December 31,2021December 31,2020December 31,2019December 31,2018December 31,2017December 31,2016( 19,434)( 11,202)( 7,117)( 13,791)( 5,070)( 930) 12,721 7,121 1,860 1,956Stock-based compensation 30,020Depreciation & amortization 5,072 3,350 2,186 1,341 1,360 1,437-- 1,227--- 1,065 2,258----440-----Interest (income) expense,net( 37)(189)( 669)(121)381508Provision for income taxes( 2,510)----18 14,616 18,396 8,348( 5,450)( 1,469) 2,989Legal settlementAcquisition-related costs/earnoutSeverance under a planAdjusted EBITDA 24,179Proprietary Information23
Reconciliation of Adjusted EBITDA - 3 Months Ended3 Months Ended( in Thousands)December 31,2021September 30,2021June 30,2021March 31,2021December 31,2020( 8,480)( 5,272)( 1,881)( 3,801)( 3,768)Stock-based compensation 7,063 8,348 7,089 7,520 6,189Depreciation & amortization 1,464 1,298 1,136 1,174 1,176-----Acquisition-related costs/earnout 60 819 265( 79) 1,778Severance under a plan440----Interest (income) expense,net( 4)( 9)( 10)( 14)( 13)Provision for income taxes-( 2,510)--- 543 2,674 6,599 4,800 5,362Net income (loss)Legal settlementAdjusted EBITDAProprietary Information24
1. Based on the compound annual growth rate (CAGR) from 2016 - 2021; 2. "VMM" refers to Variable Marketing Margin 3. "Non-auto" refers to non-auto insurance verticals 4. Year-over-year increase based on 2021 over 2020 for combined DTCA operations; policy growth based on policies submitted and agent growth based on average within the .