Transcription
VOLUME 49, NO. 1 2014PRODUCTION AND INVENTORYMANAGEMENT JOURNALA Conceptual Framework for Inventory Management:Focusing on Low-Consumption ItemsPeter WankeIntegrating FMEA with the Supply Chain Risk ManagementProcesses to Facilitate Supply Chain Design DecisionsV.M. Rao Tummala, Tobias Schoenherr, CSCP, Thomas HarrisonOperations Management Salary ReportL. Drew Rosen, Thomas Janicki, Judith GebauerA Tutorial on Managerial Cost Accounting: Year-End ReportingTimothy D. Fry, Kirk D. Fiedler
ABOUT THE PRODUCTION AND INVENTORYMANAGEMENT JOURNALThrough the support of APICS Foundation, the P&IM Journal is committedto being the premier outlet for managerial-focused research in operationsand supply chain management. The APICS Foundation 2014 board officersand members are:President: Karl Klaesius, CPIM, KS&E EnterprisesVice President: Shari Ruelas, CPIM, CSCP, Chevron ProductsTreasurer: Robert Vokurka, PhD, CPIM, CIRM, CSCPBarbara Flynn, PhD, Richard M. and Myra Louise Buskirk Professor ofManufacturing Management, Kelley School of Business, Indiana UniversityAlan Dunn, CPIM, GDI Consulting and Training CompanyKatie Fowler, SchlumbergerAntonio Galvao, CSCP, Sealed Air Inc.Michael Wasson, CSCP, Coca-Cola North AmericaPaul Pittman, PhD, Indiana University SoutheastMarco Ugarte, PhD, CPIM, CSCP, MillerCoors2PRODUCTION AND INVENTORY MANAGEMENT JOURNAL
PRODUCTION AND INVENTORYMANAGEMENT JOURNALTABLE OF CONTENTSArticlesA Conceptual Framework for Inventory Management: Focusing onLow-Consumption Items6by Peter WankeIntegrating FMEA with the Supply Chain Risk Management Processesto Facilitate Supply Chain Design Decisions24by V.M. Rao Tummala, Tobias Schoenherr, CSCP and Thomas HarrisonOperations Management Salary Report71by L. Drew Rosen, Thomas Janicki, Judith Gebauer83A Tutorial on Managerial Cost Accounting: Year-End Reportingby Timothy D. Fry, Kirk D. FiedlerEditorial Staff InformationRobert L. BregmanEditor in ChiefAssociate ProfessorDecision and Information Sciences DepartmentUniversity of HoustonRBregman@uh.edu
ARTICLE SUMMARIESA CONCEPTUAL FRAMEWORK FOR INVENTORY MANAGEMENT:FOCUSING ON LOW CONSUMPTIONThis article evaluates the premise of demand adherence to normal distributionin inventory management models, showing that this can lead to significantdistortions, mainly to stock control of very low and low consumption items.The article thus proposes a framework to help managers determine the beststock policy to be adopted given product demand characteristics. The articlealso presents the use of such a framework in a case study, in an attempt toillustrate the benefits of adopting probability density functions that are moreadequate to product demand characteristics, in terms of total costs of stocks.INTEGRATING FMEA WITH THE SUPPLY CHAIN RISKMANAGEMENT PROCESS TO FACILITATE SUPPLY CHAINDESIGN DECISIONSWe present a novel approach of integrating failure mode and effect analysis(FMEA) with a supply chain risk management process (SCRMP). Focusing onthe challenging task to assess and manage supply-side risks in global supplychains, the approach developed offers an effective and affordable way forfirms to provide decision support for the selection of their most appropriatesupply chain design. The aim of the integrated approach combining thestrengths of FMEA and SCRMP is to gather as much pertinent informationas possible, to structure it, and to comprehensively delineate all potentialsupply chain risk factors, offering valuable decision support. We illustratethe application of the approach at Michigan Ladder Company, where it wasapplied to two specific supply chains for the procurement of fiberglass ladders.Specifically, one supply chain spanned from China to the U.S. via Mexico(taking advantage of a Mexican maquiladora), and one spanned from Chinadirectly to the U.S. The combination of FMEA and the SCRMP enhanced themanufacturer’s confidence in its supply chain design decision, and enabled thefirm to proactively manage its supply-side risks. Overall, the article is meant tomotivate practitioners to embark on the journey of active risk management.While some may perceive risk management as a daunting task or beingprimarily employed by larger firms, we provide guidance for firms of any sizeto apply the approach – it can be done, and does not have to consume aninordinate amount of resources.OPERATIONS MANAGEMENT SALARY REPORTAPICS, in conjunction with the Cameron School of Business at the Universityof North Carolina Wilmington, is pleased to provide the results of the 2013Operations Management Salary Report. The data are collected from a randomsample of more than 30,000 operations management professionals worldwide.4PRODUCTION AND INVENTORY MANAGEMENT JOURNAL
Twice annually, approximately fifty percent of the APICS membership andcustomer base receives a request to complete an online survey collecting dataconcerning current salary and compensation by job function and title. Thesurvey can be accessed at: http://csbapp.uncw.edu/apics/.A TUTORIAL ON MANAGERIAL COST ACCOUNTING: YEAR-ENDREPORTINGBuilding on the companion article “A Tutorial on Managerial Cost Accounting:Living with Variances” by Fry and Fiedler (2011), this current paper picksup where the previous paper left off and illustrates how the managementaccounting system (MCA) is linked to financial accounting (FA) to generatethe year-end financial reports required by shareholders, banks, and the IRS.The prior paper focused on the detailed use of information provided by theMCA throughout the year and walked through the development of the yearlybudget, calculation of product costs, determination of budget variances,derivation of the periodic income and statement of cash flows reports, andprovides possible examples of dysfunctional behavior at a fictitious companycalled Mandrake Manufacturing. This tutorial concentrates on the interactionof the MCA and FA systems and the production of year end FA statements. Inaddition to providing information such as cost of goods sold, inventory values,and operating standards to the FA, the year-end information provided by theMCA is also used to develop next year’s budgets. In this present paper, theconversion of the MCA reports into the FA reports will be presented. Also, theimpact of the MCA reports on future budgets will be discussed. As pointedout in F&F, it is vital that operations managers understand how the accountingsystems used by their company function. Without such understanding, manyof the problems associated with the improper use of the accounting systemswill never be corrected.VOLUME 49, NO. 15
A CONCEPTUAL FRAMEWORK FORINVENTORY MANAGEMENT: FOCUSING ONLOW- CONSUMPTION ITEMSPeter Wanke (Corresponding Author)Center for Logistics Studies, Infrastructure, and Management, The COPPEADGraduate School of Business, Federal University of Rio de Janeiro, Rio deJaneiro Brazil 21949-900ABSTRACTThis article evaluates the premise of demand adherence to normal distributionin inventory management models, showing that this can lead to significantdistortions, mainly to stock control of very low and low consumption items.The article thus proposes a framework to help managers determine the beststock policy to be adopted given product demand characteristics. The articlealso presents the use of such a framework in a case study, in an attempt toillustrate the benefits of adopting probability density functions that are moreadequate to product demand characteristics, in terms of total costs of stocks.Keywords: stock, lead-time demand, coefficient of variation, framework, costs1. IntroductionInventory management permeates decision-making in countless firmsand has been extensively studied in the academic and corporate spheres(Rosa et al. 2010). The key questions – usually influenced by a variety ofcircumstances – which inventory management seeks to answer are: whento order, how much to order and how much stock to keep as safety stock(Namit and Chen 1999; Silva 2009). According to Wanke (2011a), inventorymanagement involves a set of decisions that aim at matching existingdemand with the supply of products and materials over space and timein order to achieve specified cost and service level objectives, observingproduct, operation, and demand characteristics.These diverse circumstances that should be taken into account for anappropriate selection of inventory management models have contributedto the development of research and production of articles on possiblequalitative conceptual schemes – also known as classification approaches– aimed at supporting decision-making (Huiskonen 2001). There are severalexamples of this kind throughout the years.Williams (1984), for example, developed an analytical method to classifydemand as regular (high consumption), low consumption, or intermittent, by6PRODUCTION AND INVENTORY MANAGEMENT JOURNAL
decomposing the variability of lead-time demand into three parts: variabilityof the number of occurrences per unit of time, variability of demand size,and lead-time variability. Botter and Fortuin (2000) based their classificationof items on three criteria: lead time, price, and consumption level, whichunderpin the development of eight different inventory management models.Eaves and Kingsman (2004) revisited Williams’ (1984) model, reclassifyingspare parts into five categories: smooth, erratic, low turnover, slightlysporadic, and strongly sporadic. Syntetos, Boylan and Croston (2005) classifyitems into four quadrants, divided by two axes: the average demand intervaland the squared coefficient of demand variation. Years later Boylan, Syntetos,and Karakostas (2008) presented an application of this method in a softwarefirm. The items’ consumption pattern is classified as strongly sporadic,slightly sporadic, and non-sporadic.The aim of this article is to analyze the pattern of demand as the mainintervening factor in inventory management. It first of all discusses, in section2, how the frequently adopted premises regarding the adherence of demandto Normal distribution may not be realistic and cause distortions, especiallyin the case of very low – when the annual demand is less than one – and lowconsumption items – when the annual demand ranges between one anda value sufficiently high, say three hundred or five hundred units per year,in order to characterize a daily demand close to one. Section 3 proposes aconceptual framework designed to support inventory management, whichsynthesizes those models that are most adequate for specific patterns ofdemand (mean and variability). Finally, sections 4 and 5 present a case studyundertaken in a Brazilian company, which not only showed the practicalapplication of the conceptual framework but also revealed the latter’s impactin terms of shortage and excess costs.2. Literature ReviewChoosing the most adequate inventory management model is essentially anempirically-based decision that may involve the use of simulation, scenarioanalysis, incremental cost analyses (Silva 2009; Rosa et al. 2010; Rego andMesquita, 2011; Wanke 2011b) or qualitative conceptual schemes also knownas classification approaches (Huiskonen 2001). The latter usually considersthat the impact of product, operation and demand characteristics constituteintervening variables in this choice (see, for example, Williams 1984; Hax andCandea 1984; Dekker, Kleijn, and De Rooij 1998; Botter and Fortuin 2000;Braglia, Grassi, and Montanari 2004; Eaves and Kingsman 2004; Wanke 2011b).An analysis of the literature dealing with inventory management modelselection shows that it originally focused on production and distributionenvironments in which demand and lead time tend to be more predictableor, in other words, in which it is easier to answer the questions of “what” andVOLUME 49, NO. 17
“how much” to order (Wanke and Saliby, 2009; Wanke 2011b; Rosa et al. 2010).However, there is a growing literature related to the specific problems raised bylow and very low consumption items such as spare parts (Botter and Fortuin2000; Silva, 2009; Rego and Mesquita 2011; Syntetos et al. 2012).The intrinsic characteristics of spare parts, which are typically low and verylow consumption items, make the choice of inventory management modelsparticularly critical under the following circumstances (Cohen and Lee 1990;Cohen, Zheng, and Agrawal 1997; Muckstadt 2004; Kumar 2005; Rego 2006):low stock turnover, difficult predictability, longer replenishment times, greaterservice level demands and higher acquisition costs.Therefore, these special features of spare parts determine the selection ofappropriate inventory management models. According to Botter and Fortuin(2000), there is a consensus that spare parts cannot be managed using traditionalmodels (see, for example, those presented in Rosa et al. 2010). Basically, spareparts do not fit these models’ main premises such as, for example, the adherenceof demand to symmetric and continuous probability density functions (Silva 2009).The following subsections explore this issue at greater depth, linking demandcharacteristics (mean and variability) to inventory management modelsdeveloped in the literature. In the case of average demand, the literatureprovides the basis for the segmentation of annual consumption accordingto three different levels – very low consumption, low consumption and massconsumption (Ward, 1978; Silva, 2009; Wanke, 2011a) – while the coefficient ofvariation (see for instance, Silver et al., 1998; Hopp and Spearman, 2008) andthe probability distribution functions (see for instance, Yeh, 1997; Silver et al.,1998) form the basis for segmentation in the case of variability.2.1 Very low consumptionAccording to Tavares and Almeida (1983), very low consumption parts arethose whose average consumption is less than one unit per year. According tothese authors, the stock control of these items should not be performed usingthe usual models because, due to their particular consumption characteristic,there are not enough previous occurrences to make a precise estimate ofprobability distribution (Croston 1972; Syntetos and Boylan 2001; Ghobbar andFriend 2003; Eaves and Kingsman 2004; Willemain, Smart, and Schwarz 2004;Regattieri et al. 2005; Hua et al. 2007; Gutierrez, Solis, and Mukhopadhyay2008; Gomez 2008; Teunter and Duncan 2009).In addition, following Tavares and Almeida (1983), it is the analysis of total shortage,excess and order placement costs, given a certain service level, that makes itpossible to determine whether a part should, or should not, be kept in stock, and a8PRODUCTION AND INVENTORY MANAGEMENT JOURNAL
replenishment request made solely against an order. Thus, a binary total cost modelwas developed to support decision-making regarding whether to keep one (1) orno (0) unit in stock based on two suppositions: adherence of demand to Poissondistribution and the possibility of placing an emergency order with a lower thanusual lead time, whenever a shortage occurs. This model is presented in appendix 1.2.2 Low consumptionFor the purpose of this article, low cost items are those with a historicalconsumption of between 1 and 300 500 units per year, which leads to anaverage daily demand close to one, as suggested by Wanke (2005). As demandis not too small to use the model proposed by Tavares and Almeida (1983),service level-related decisions such as the order point and replenishmentlevel assume greater importance. Thus, the model, which is widely used in theliterature, was considered to be the most adequate (Rosa et al. 2010).More precisely, the model involves a continuous review of stock levels andreplenishment orders are always placed whenever the stock position reachesthe order point s (Silver and Peterson 1985; Silver et al. 1998). In this case, aquantity of replenishment is used that is sufficient to raise the stock positionto point S. That is, in practice, the lot size is . According to Hadley and Whitin(1961), the models result in unitary lot size orders when order placementcosts are low. Thus, as Feeney and Sherbrooke (1966) conclude, the policyconstitutes a particular case of models.Various authors (Feeney and Sherbrooke 1966; Walker 1997; Porras and Decker2008; Gomes and Wanke 2008) have used the model in spare part inventorymanagement. Using this model, a replenishment order is requested as soon asa unit of stock is consumed in order to recompose the maximum level of stock.This model is appropriate for very costly components that are essential forbusiness operations (Walker 1997).In relation to the probability distributions of demand and lead time in thecontext of models, Rosenshine et al. (1976 and Dhakar et al. 1993) initiallyassume that lead time is deterministic. However, various distributions, havebeen considered in the context of in order to represent the behavior of demandor lead time separately: Normal (Krupp 1997), Gama (Burgin 1975; Das 1976;Yeh 1997), Poisson (Hill, Omar, and Smith 1999) and empirical distribution withstochastic demands and lead times (Eppen and Martin 1988).Another important point involves the determination of the probabilitydistribution that results from the combination of lead-time demand results(Lau 1989; Silva 2009). According to Tyworth (1992), theNormal distributionconstitutes a reasonable approximation for high consumption items, but not forlow consumption ones. In the case of the latter items, distribution is typicallyasymmetric and possesses a high probability of demand equal to zero. PorrasVOLUME 49, NO. 19
and Decker (2008) adopted the Poisson distribution to estimate the lead-timedemand of items with only one occurrence at each specific time interval.It should be highlighted that when demand involves more than oneoccurrence per time interval, various authors have proposed compoundmodels, such as the Stuttering Poisson (Ward 1978), the compoundPoisson model (Williams 1984; Silver, Ho, and Deemer 1971) or thecompound Bernoulli model (Janssen, Heuts, and Kok 1998; Strijbosch,Heuts, and Schoot 2000). More recently, Syntetos et al. (2012) conducteda comprehensive literature review on the distributional assumptionsfor spare-parts management, assessing the goodness-of-fit of variousdistributions and their stock-control implications in terms of inventoriesheld and service levels achieved.However, since most of the distributional assumptions are difficult toapply in practice – as the parameters of more than one distribution mustbe determined first so as to analyze the lead-time demand behavior – andin order to make the conceptual framework developed in this researchoperational to managers, readily to be implemented in Excel spreadsheets,we decided to narrow the decision regarding the most adequate leadtime demand distribution between Poisson and Gamma distributions. Forexamples on the practically of the implementation of these distributions inExcel, readers should refer, for instance, to Hopp and Spearman (2008) andWanke (2011a) – for Poisson distribution – and Silver et al. (1998) and Tyworthand Ganeshan (2000) – for Gamma distribution. Besides, as detailed next,these distributions hold straightforward relations between their definingparameters and the mean and variance of the variable of interest.2.2.1. Poisson DistributionIn the case of low consumption items, Silver et al. (1998) suggest adoptingthe Poisson distribution premise (cf. Appendix 2). According to Yeh (1997),however, it is first of all necessary to verify the practical applicability of thePoisson distribution. This is because, in the Poisson distribution, the meanand variance are numerically equal. Thus, if this distribution is to be usedin practice, the variance of demand must be situated within an intervaldelimited by a variation of ten percent around its mean: 0.9ED VarD 1.1E(D).2.2.2. Gamma DistributionThe Gamma distribution premise (cf. Appendix 3) was adopted by Yeh (1997)in his study, in which more than fifty percent of the items considered inhis sample had a consumption of less than ten units per year. The use ofthe Poisson distribution was originally rejected as it did not satisfy thecondition previously expressed. According to Burgin (1975 and Yeh 1997), the10PRODUCTION AND INVENTORY MANAGEMENT JOURNAL
Gamma distribution adheres easily to real data and can be mathematicallymanipulated in inventory management.Following Yeh et al. (1997), the Gamma distribution is adequate in cases whereperiods with null demand occur more frequently. Under these circumstances,it makes sense to consider the time interval that has elapsed between twoconsecutive demands different from zero as a variable of interest for modelingpurposes, besides demand itself and lead time. Segerstedt (1994 and Yeh1997), for example, developed an inventory management model assuming thatthe time interval between two consecutive non-zero demands (Ti), demand (λ)and lead time (TR) are adherent to the Gamma distribution.It is worth noting that intermittent demand patterns – meaning that demandarrives infrequently and is interspersed by time periods with no demand at all– is a critical for choosing the most adequate distributional assumption (Eaves,2002; Syntetos et al., 2012). Boylan and Syntetos (2007) used the averagedemand interval, that is the mean time between two consecutive demandsgreater than zero, to classify spare parts in conjunction with demand and leadtime uncertainty. Eaves and Kingsman (2004) developed similar concepts.The model used by Yeh (1997) uses the probability of not having a stockshortage during an order cycle, that is, during the interval of time betweentwo consecutive replenishments, as a measure of the service level. The lowestand highest desired service levels for each item are defined according to themodel. The service level for the remaining stock is calculated by 1-Ps(S), inwhich Ps(S), given in Appendix 4, is the probability of stock shortage during theorder cycle, given the level of stock S.2.3 Mass consumptionMass consumption items are frequently considered to be those with ahistorical consumption of over 300 500 units per year, roughly one unit/day(Wanke2005). According to Rosa et al. (2010), the classic lot size/reorder pointmodel stands out among mass consumption item inventory managementmodels. According to this model, units are requested whenever the stockposition reaches reorder point (OP) (Love 1979; Silver et al. 1998; Muckstadt2004; Sherbrooke 2004; Hopp and Spearman 2008). In practice, the size of lotQ is determined by the traditional Economic Order Quantity formula (Harris1913) and the reorder point is defined so as to assure a specific service levelmeasure (Eppen and Martin 1988; Rego et al. 2011).It is necessary to know the format of the distribution of lead-time demandto determine the safety stock embedded within the reorder point (Keaton1995). According to Porras and Decker (2008), this calculation requiresspecifying the distribution of lead-time demand so that the safety factor, K,VOLUME 49, NO. 111
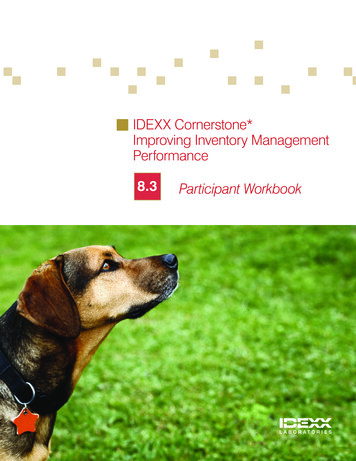
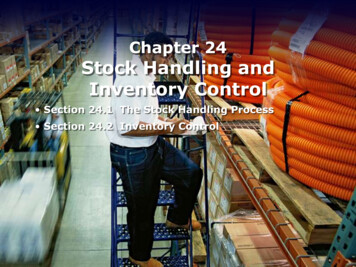
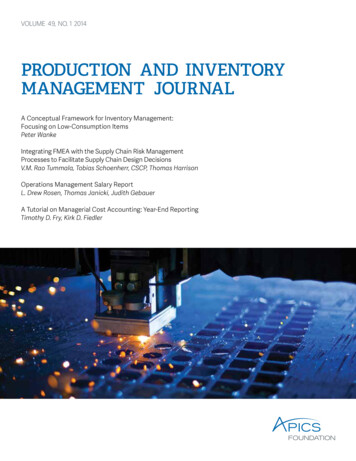
can be determined. Traditionally, lead-time demand is modeled using a Normaldistribution (Silver and Peterson 1985). Due to the properties of this distribution,the safety factor K for a specific service level is the same as of the standardnormal distribution curve, Z, which can be found in several statistics andlogistics textbooks such as, for example, Levine et al. (2005) and Ballou (2006).Various studies, however, criticize this approximation. According to Mentzerand Krishnan (1988), this approximation is only valid if the Normal distribution isdefined between the interval of - and . Moreover, this creates the possibilityof negative demand in many practical applications. For Moors and Strijbosch(2002), one of the main drawbacks of the Normal distribution is the symmetryassumption. Furthermore, according to Eppen and Martin (1988), items thatpresent a Normal distribution of lead-time demand are found in only a few cases.As an attempt to balance the advantages and disadvantages of choosing anspecific premise, Silver et al. (1998) propose a general rule for approximatinglead-time demand using the probability distribution of the coefficient ofvariation (CV), in the specific case of mass consumption items. If CV is greaterthan 0.5, the Gamma distribution should be used and, if it is not, a Normaldistribution provides a good approximation for lead-time demand.3. CONCEPTUAL FRAMEWORK FOR INVENTORY MANAGEMENTTaking the theoretical framework presented in previous sections as a point ofdeparture, the present article proposes a conceptual framework for inventorymanagement based on the segmentation of annual demand into threecategories – very low consumption, low consumption and mass consumption– and the coefficient of the variation of demand into two categories – highuncertainty and low uncertainty. Using these two demand pattern-associatedvariables, the conceptual framework indicates the most appropriate inventorymanagement model for low, very low, and mass consumption items, thus supportingdecision-making based on the most adherent premises to answer the questions ofhow much to order, when to order and how much stock to keep in safety stocks.In the conceptual framework synthesized in figure 1, extremely lowconsumption items are considered to be those with an average historicaldemand of less than one unit per year. Low consumption items correspond toitems whose average historical demand may vary between one and 300 500units per year, or a maximum of one unit per day, while mass consumptionitems are those with a demand of over approximately 300 500 units per year,in accordance with Wanke (2005). The cut-off point for the coefficient of thevariation of demand is 0.5, like in Silver et al. (1998).More specifically, for each quadrant of annual demand and the item’scoefficient of variation of demand, the conceptual framework contains the12PRODUCTION AND INVENTORY MANAGEMENT JOURNAL
most adherent probability distribution functions and the most appropriateinventory management model, incorporating all the theoretical considerationsdescribed in the previous sections.Policy (S, S-1)̥̥ Short Lead Time yLot 1̥̥ Lead Time LongyLot ConsunptionForecase during Lead Time.Premises/Assumptions toDetermine S:Binary Models (Zero or One)Coefficient of variation of demandLess than 0.5Greater than 0.5FIGURE 1: CONCEPTUAL FRAMEWORK FOR INVENTORYMANAGEMENT0Policy (Q, OP)̥̥ Order Point̥̥ SS Gamma Distributionor Data HistogramPoissonIf 0,9 E(D) Var (D) 1.1 E(D)GammaIf the percentage of periodsduring which D 0 exceeds30% of the total̥̥ Demand LT̥̥ Replenishment LT̥̥ Average Demand1̥̥ Order Point̥̥ SS Normal Distributionor Data Histogram300 500Annual DemandInfinityIn addition to the development of conceptual frameworks, Rego et al.(2011) stress the need to conduct case studies focusing on their practicalapplicability in firms in order to overcome gaps between theory and practice.These case studies enable researchers to increase their practical knowledgegiven that aspects involving understanding about environment’s complexity andthe managerial efforts made by firms become evident. Examples can be found inCohen et al. (1990), Botter and Fortuin (2000), Strijbosch, Heuts, and Schoot (2000),Trimp et al.(2004), Levén and Segerstedt (2004), Wanke (2005), Porras and Dekker(2008), Wagner and Lindemann (2008), Syntetos, Keyes, and Babai (2009), andSilva (2009). The following sections present and discuss the results of the practicalapplication of the proposed conceptual framework in a large Brazilian company.4. PRACTICAL APPLICATION: DESCRIPTION OF RESULTSThe conceptual framework presented in section 3 formed the basis for thedevelopment of a VBA tool for Excel to help segment inventory items using adatabase structured in an electronic spreadsheet. In addition, this tool makesit possible to obtain a quick answer to the questions of how much to order,when to order and how much stock to keep in a safety stock for a large numberVOLUME 49, NO. 113
of items, considering a given level of service that the firm wishes to offercustomers and the previously identified segmentation. The tool was applied toreal data from a Brazilian company in order to measure possible gains resultingfrom the proposed conceptual framework for inventory management.The firm that was the object of this practical application is one of the world’sleading manufacturers of agricultural and construction equipment. It hasapproximately one hundred sixty factories worldwide, of which three arelocated in Brazil. The Brazilian subsidiary has more than two thousandemployees. In addition, the firm maintains a total of more than 20,833 differentitems in its Brazilian subsidiary’s warehouses. The firm considers that thisdiversity of items is fundamental for providing support for technical assistanceactivities and post-sales services for the equipment it commercializes.In order to perform a comparison between the inventory management actuallyverified in the firm and the policy suggested by the tool (conceptual framework),the study used consumption data of the previous forty-eight months for all20,833 items. Besides consumption data, other data informed by the firm,which was important for modeling purposes, was also used: item’s acquisitioncost; replenishment/order placement cost; unavailability and penalty costs;average supplier lead time; variance of supplier lead time; opportunity cost ofmaintaining stocks for a year, for each of the different items.The first step in the application of the conceptual framework was to use theExcel tool to segment the items according to the classification categoriesof very low consumption, low consumption and mass consumption, whichresulted in the following respective percentages: 22 percent; 74.5 percentand 3.5 percent. In addition, based on the three demand categories and thetwo coefficients of variation, an analysis was undertaken of demand’s degreeof adherence to the Poisson and Gamma dist
2 PRODCTIO AND INVENTORY MANAGEMENT JORNAL ABOUT THE PRODUCTION AND INVENTORY MANAGEMENT JOURNAL Through the support of APICS Foundation, the P&IM Journal is committed to being the premier outlet for managerial-focused research in operations and supply chain management. The APICS Foundation 2014 board officers and members are:Cited by: 7Page Count: 100File Size: 892KB