Transcription
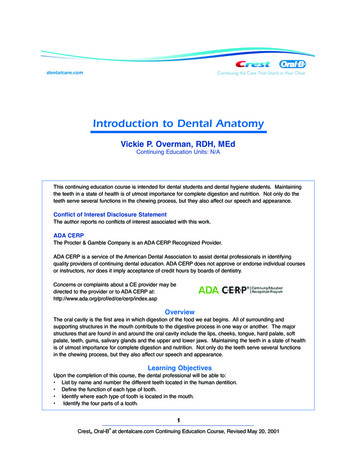
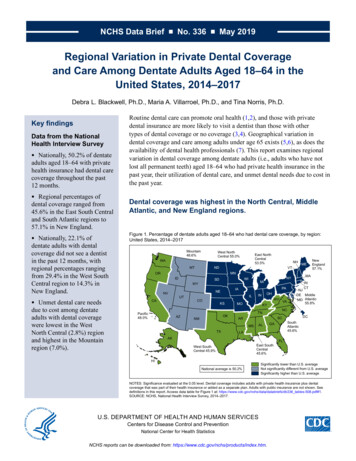
NCHS Data Brief No. 336 May 2019Regional Variation in Private Dental Coverageand Care Among Dentate Adults Aged 18–64 in theUnited States, 2014–2017Debra L. Blackwell, Ph.D., Maria A. Villarroel, Ph.D., and Tina Norris, Ph.D.Key findingsData from the NationalHealth Interview Survey Nationally, 50.2% of dentateadults aged 18–64 with privatehealth insurance had dental carecoverage throughout the past12 months. Regional percentages ofdental coverage ranged from45.6% in the East South Centraland South Atlantic regions to57.1% in New England.Nationally, 22.1% ofdentate adults with dentalcoverage did not see a dentistin the past 12 months, withregional percentages rangingfrom 29.4% in the West SouthCentral region to 14.3% inNew England. Unmet dental care needsdue to cost among dentateadults with dental coveragewere lowest in the WestNorth Central (2.8%) regionand highest in the Mountainregion (7.0%).Routine dental care can promote oral health (1,2), and those with privatedental insurance are more likely to visit a dentist than those with othertypes of dental coverage or no coverage (3,4). Geographical variation indental coverage and care among adults under age 65 exists (5,6), as does theavailability of dental health professionals (7). This report examines regionalvariation in dental coverage among dentate adults (i.e., adults who have notlost all permanent teeth) aged 18–64 who had private health insurance in thepast year, their utilization of dental care, and unmet dental needs due to cost inthe past year.Dental coverage was highest in the North Central, MiddleAtlantic, and New England regions.Figure 1. Percentage of dentate adults aged 18–64 who had dental care coverage, by region:United States, 2014–2017Mountain48.6%West NorthCentral 55.0%WANDMTNHVTMNORIDNVCAPacific48.0%WISDWY East LGALAAKWest SouthCentral 45.9%East SouthCentral45.6%HINational average is 50.2%RICTNJDE MiddleMD SouthAtlantic45.6%FLSignificantly lower than U.S. averageNot significantly different from U.S. averageSignificantly higher than U.S. averageNOTES: Significance evaluated at the 0.05 level. Dental coverage includes adults with private health insurance plus dentalcoverage that was part of their health insurance or added as a separate plan. Adults with public insurance are not shown. Seedefinitions in this report. Access data table for Figure 1 at: https://www.cdc.gov/nchs/data/databriefs/db336 tables-508.pdf#1.SOURCE: NCHS, National Health Interview Survey, 2014–2017.U.S. DEPARTMENT OF HEALTH AND HUMAN SERVICESCenters for Disease Control and PreventionNational Center for Health StatisticsNCHS reports can be downloaded from: https://www.cdc.gov/nchs/products/index.htm.
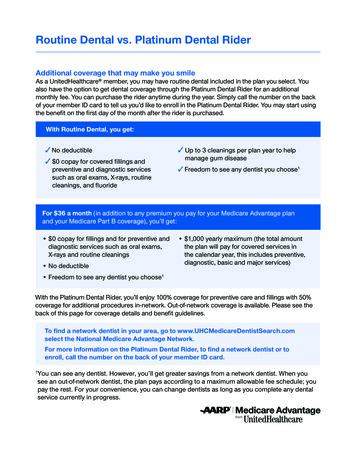
NCHS Data Brief No. 336 May 2019 Dental coverage among dentate adults was significantly higher than the national average(50.2%) in the New England (57.1%), Middle Atlantic (55.8%), West North Central(55.0%), and East North Central (53.5%) regions (Figure 1). Dental coverage was significantly lower than the national average in the South Atlantic(45.6%), East South Central (45.6%), West South Central (45.9%), and Pacific (48.0%)regions. Dental coverage in the Mountain region (48.6%) was comparable with the national average.Adults in the East and West South Central regions were most likely to notsee a dentist in the past 12 months. Compared with the national average (22.1%), dentate adults aged 18–64 with dentalcoverage were significantly more likely to go without seeing a dentist in the past 12 monthsin the East South Central (26.9%) and West South Central (29.4%) regions (Figure 2). Among dentate adults aged 18–64 with dental coverage, the percentages who did not see adentist in the past 12 months were significantly lower than the national average in the NewEngland (14.3%), Middle Atlantic (20.0%), and East North Central (20.6%) regions.Figure 2. Percentage of dentate adults aged 18–64 with dental care coverage who did not see a dentist in the past 12months, by region: United States, 2014–2017Mountain22.5%West NorthCentral AZPAILCOKSOKNMWVNCGASouthAtlantic22.7%LAEast SouthCentral26.9%National average is 22.1%DCSCARWest SouthCentral VPacific21.1%New England14.3%East NorthCentral20.6%FLSignificantly lower than U.S. averageNot significantly different from U.S. averageSignificantly higher than U.S. averageNOTES: Significance evaluated at the 0.05 level. Dental coverage includes adults with private health insurance plus dental coverage that was part of their healthinsurance or added as a separate plan. Adults with public insurance are not shown. See definitions in this report. Access data table for Figure 2 at:https://www.cdc.gov/nchs/data/databriefs/db336 tables-508.pdf#2.SOURCE: NCHS, National Health Interview Survey, 2014–2017. 2
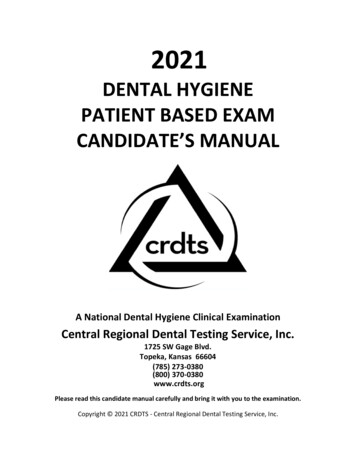
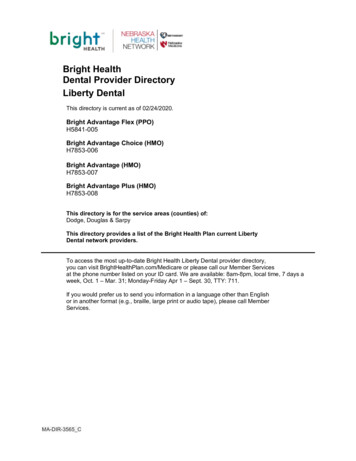
NCHS Data Brief No. 336 May 2019 Dentate adults aged 18–64 with dental coverage in the Pacific (21.1%), Mountain (22.5%),West North Central (22.5%), and South Atlantic (22.7%) regions were as likely as the nationas a whole to have not seen a dentist in the past 12 months.Unmet dental care needs due to cost were highest in the Mountain andWest South Central regions. Among dentate adults aged 18–64 with dental coverage, the Mountain (7.0%) and WestSouth Central (5.4%) regions had significantly higher percentages of unmet needs due tocost in the past 12 months compared with the national average (4.4%) (Figure 3). Dentate adults with dental coverage in the West North Central (2.8%) and Middle Atlantic(3.7%) regions had significantly lower percentages of unmet dental care needs due to cost inthe past 12 months compared with the national average. Unmet dental care needs among dentate adults with dental care coverage were notsignificantly different from the national average in the New England (3.5%), East SouthCentral (4.1%), East North Central (4.4%), Pacific (4.5%), and South Atlantic (4.7%)regions.Figure 3. Percentage of dentate adults aged 18–64 with dental coverage who needed dental care but couldn't afford it inthe past 12 months, by region: United States, 2014–2017Mountain7.0%West NorthCentral PAILCOKSOKNMWVNCDCSCARGAALSouthAtlantic4.7%LAEast SouthCentral4.1%National average is 4.4%MDVAKYAKHIDETNWest SouthCentral 5.4%MARINJOHINMOMSTXNYVTNHCTIANENVPacific4.5%New England3.5%East NorthCentral4.4%FLSignificantly lower than U.S. averageNot significantly different from U.S. averageSignificantly higher than U.S. averageNOTES: Significance evaluated at the 0.05 level. Dental coverage includes adults with private health insurance plus dental coverage that was part of their healthinsurance or added as a separate plan. Adults with public insurance are not shown. See definitions in this report. Access data table for Figure 3 at:https://www.cdc.gov/nchs/data/databriefs/db336 tables-508.pdf#3.SOURCE: NCHS, National Health Interview Survey, 2014–2017. 3
NCHS Data Brief No. 336 May 2019SummaryAbout one-half (50.2%) of dentate adults aged 18–64 in the United States had private healthcoverage with dental coverage during 2014–2017. Among those with private health insuranceand dental coverage, less than one-fourth (22.1%) did not see a dentist in the past 12 months, and4.4% had unmet dental needs due to cost in the past 12 months.Compared with national averages, dentate adults in the U.S. Middle Atlantic region were morelikely to have private dental coverage in the past year, less likely to go without seeing a dentistin the past year, and less likely to have unmet dental needs due to cost. Similarly, dentateadults in the New England, West North Central, and East North Central regions also had higherpercentages of dental coverage than the national average, lower percentages than the nationalaverage of dentate adults who did not see a dentist in the past 12 months (New England and EastNorth Central regions), and a lower percentage than the national average of having unmet dentalneeds due to cost (West North Central region only).In contrast, dentate adults in the West South Central and East South Central regions had lowerpercentages of dental coverage, higher percentages of dentate adults who did not see a dentistin the past 12 months, and a higher percentage of unmet dental needs due to cost (West SouthCentral region only) compared with national averages.Dentate adults in the Pacific and South Atlantic regions had lower percentages of private dentalcoverage than the national average, but among those with coverage, the percentages who did notsee a dentist or had unmet dental needs due to cost were comparable with the national average.Unmet dental care needs due to cost were higher than the national average in the Mountain regioneven though dentate adults in this region were comparable with the United States with respect toboth percentages of dental coverage and not having seen a dentist in the past 12 months. 4
NCHS Data Brief No. 336 May 2019DefinitionsDental coverage status: Refers to adults aged 18–64 who had any private health insuranceplan for the 12 months prior to their National Health Interview Survey (NHIS) interview plusdental coverage that was either part of that plan or added separately via the purchase of asingle-service dental plan. A single-service dental plan refers to a private health insurance plan,usually purchased separately, that only pays for dental care. Respondents with such plans wereidentified based on a positive response to the following question, “You mentioned that {you have/person has} a single-service plan—that is, an insurance plan that provides one specific type ofcoverage. What type of service or care does {your/person’s} single service plan or plans pay for? Dental care.”Dental care coverage reflects coverage at the time of interview. Also, “adults with private dentalcoverage” does not include publicly insured adults who purchased a single-service dental plan, orprivately insured adults with dental coverage who had a lapse in private health insurance duringthe past year.Dental visit in the past 12 months: Based on the following question, “About how long has it beensince you last saw a dentist? Include all types of dentists, such as orthodontists, oral surgeons, andall other dental specialists, as well as dental hygienists.” Sample adults who responded with “6months or less” or “More than 6 months, but not more than 1 year ago” were considered to haveseen a dentist in the past 12 months.Dentate adults: Refers to persons who have not lost all of their permanent or natural teeth (bothupper and lower), as identified by “no” responses to the question, “Have you lost all of yourupper and lower natural (permanent) teeth?” During 2014–2017, 96.4% of U.S. adults aged 18–64had some or all of their natural teeth.Regions: Categories were slightly modified from the nine U.S. Census Bureau-designateddivisions by moving Delaware, the District of Columbia, and Maryland into the Middle Atlanticregion (8). Divisions include: New England—Connecticut, Maine, Massachusetts, NewHampshire, Rhode Island, Vermont; Middle Atlantic—Delaware, District of Columbia, Maryland,New Jersey, New York, Pennsylvania; East North Central—Illinois, Indiana, Michigan, Ohio,Wisconsin; West North Central—Iowa, Kansas, Minnesota, Missouri, Nebraska, North Dakota,South Dakota; South Atlantic—Florida, Georgia, North Carolina, South Carolina, Virginia, WestVirginia; East South Central—Alabama, Kentucky, Mississippi, Tennessee; West South Central—Arkansas, Louisiana, Oklahoma, Texas; Mountain—Arizona, Colorado, Idaho, Montana, NewMexico, Nevada, Utah, Wyoming; and Pacific—Alaska, California, Hawaii, Oregon, Washington.Unmet dental needs due to cost: Based on a positive response to the question, “During the past 12months, was there any time when you needed any of the following but didn’t get it because youcouldn’t afford it? . Dental care (including check-ups)?” 5
NCHS Data Brief No. 336 May 2019Data source and methodsData from the 2014–2017 NHIS were used for this analysis. NHIS data are collected continuouslythroughout the year and include information about the health and health care of the civiliannoninstitutionalized U.S. population. Interviews are conducted in respondents’ homes, butfollow-ups to complete interviews may be conducted over the telephone.Information from the Sample Adult component of the 2014–2017 NHIS was used to determinedental visits and unmet dental needs due to cost in the past 12 months for 91,946 adultrespondents aged 18–64 who had not lost all of their upper and lower teeth. Information onprivate health insurance and dental care coverage was obtained from the 2014–2017 Person files.All analyses excluded adults with unknown private insurance status as well as those with privateinsurance and unknown dental coverage; adults with unknown information about dental visitsin the past 12 months and unmet dental care needs due to cost in the past 12 months were alsoexcluded from the analyses shown in Figures 2 and 3, respectively. For more information aboutNHIS, including the questionnaire, visit the NHIS website: https://www.cdc.gov/nchs/nhis.htm.Sampling weights were used to produce national and regional estimates that were representativeof the civilian noninstitutionalized U.S. population aged 18–64. Data weighting procedures aredescribed in more detail elsewhere (9,10). Point estimates and estimates of their variances werecalculated using SUDAAN software to account for the complex sampling design of NHIS (11).The Taylor series linearization method was chosen for estimation of standard errors. Differencesbetween percentages were evaluated using two-sided significance tests at the 0.05 level. Theestimated standard error of the difference between regional and national estimates accounted fornonindependence of regional and national estimates by incorporating their covariance.About the authorsDebra L. Blackwell, Maria A. Villarroel, and Tina Norris are with the National Center for HealthStatistics, Division of Health Interview Statistics. 6
NCHS Data Brief No. 336 May 2019References1. American Dental Association. Action for dental health: Bringing disease prevention intocommunities. A statement from the American Dental Association. 2013. Available from:https://www.ada.org/ e-prevention-tocommunities adh.ashx.2. U.S. Department of Health and Human Services. Oral health. Available alth-indicators/2020-lhi-topics/Oral-Health.3. Bloom B, Simile CM, Adams PF, Cohen RA. Oral health status and access to oral health carefor U.S. adults aged 18–64: National Health Interview Survey, 2008. National Center for HealthStatistics. Vital Health Stat 10(253). 2012.4. Hinton E, Paradise J. Access to dental care in Medicaid: Spotlight on nonelderly adults.The Kaiser Commission on Medicaid and the Uninsured. Issue Brief. March 2016. Availablefrom: -adults.5. Cohen RA, Martinez ME, Zammitti EP. Health insurance coverage: Early release of estimatesfrom the National Health Interview Survey, 2015. National Center for Health Statistics. May2016. Available from: sur201605.pdf.6. Khan A, Thapa JR, Zhang, D. Preventive dental checkups and their association with access tousual source of care among rural and urban adult residents. J Rural Health 33(4):419–26. 2017.7. National Center for Health Statistics. Table 86. Active dentists, by state: United States,selected years 2001–2016. Health, United States, 2017: With special feature on mortality.Hyattsville, MD: National Center for Health Statistics. 2018.8. Holahan J, Buettgens M, Carroll C, Dorn S. The cost and coverage implications of the ACAMedicaid expansion: National and state-by-state analysis. Kaiser Commission on Medicaid andthe Uninsured. 2012.9. Parsons VL, Moriarity C, Jonas K, Moore TF, Davis KE, Tompkins L. Design and estimationfor the National Health Interview Survey, 2006–2015. National Center for Health Statistics. VitalHealth Stat 2(165). 2014.10. National Center for Health Statistics. 2017 National Health Interview Survey (NHIS)public use data release. Survey description. 2018. Available from: t Documentation/NHIS/2017/srvydesc.pdf.11. RTI International. SUDAAN (Release 11.0.0) [computer software]. 2012. 7
U.S. DEPARTMENT OFHEALTH & HUMAN SERVICESFIRST CLASS MAILPOSTAGE & FEES PAIDCDC/NCHSPERMIT NO. G-284Centers for Disease Control and PreventionNational Center for Health Statistics3311 Toledo Road, Room 4551, MS P08Hyattsville, MD 20782–2064OFFICIAL BUSINESSPENALTY FOR PRIVATE USE, 300For more NCHS Data Briefs, .htm.NCHS Data Brief No. 336 May 2019Keywords: dental visits unmet dental need dental care coverage National Health Interview Survey. Suggested citationBlackwell DL, Villarroel MA, Norris T.Regional variation in private dental coverageand care among dentate adults aged 18–64 inthe United States, 2014–2017. NCHS DataBrief, no 336. Hyattsville, MD: NationalCenter for Health Statistics. 2019.Copyright informationAll material appearing in this report is inthe public domain and may be reproducedor copied without permission; citation as tosource, however, is appreciated.National Center for HealthStatisticsJennifer H. Madans, Ph.D., Acting DirectorAmy M. Branum, Ph.D., Acting AssociateDirector for ScienceDivision of Health Interview StatisticsStephen J. Blumberg, Ph.D., DirectorAnjel Vahratian, Ph.D., M.P.H., AssociateDirector for ScienceFor e-mail updates on NCHS publicationreleases, subscribe online at:https://www.cdc.gov/nchs/govdelivery.htm.For questions or general informationabout NCHS:Tel: 1–800–CDC–INFO (1–800–232–4636)TTY: 1–888–232–6348Internet: https://www.cdc.gov/nchsOnline request form: https://www.cdc.gov/infoISSN 1941–4927 Print ed.ISSN 1941–4935 Online ed.DHHS Publication No. 2019–1209CS305663
Dentate adults aged 18–64 with dental coverage in the Pacific (21.1%), Mountain (22.5%), West North Central (22.5%), and South Atlantic (22.7%) regions were as likely as the nation as a whole to have not seen a dentist in the past 12 months. Unmet dental care needs due to cost wer