Transcription
PARAG MILK FOODS LIMITEDInvestor PresentationAugust 2019
Safe HarborThis presentation and the accompanying slides (the “Presentation”), which have been prepared by Parag Milk Foods Limited (the “Company”), have beenprepared solely for information purposes and do not constitute any offer, recommendation or invitation to purchase or subscribe for any securities, and shallnot form the basis or be relied on in connection with any contract or binding commitment what so ever. No offering of securities of the Company will bemade except by means of a statutory offering document containing detailed information about the Company.This Presentation has been prepared by the Company based on information and data which the Company considers reliable, but the Company makes norepresentation or warranty, express or implied, whatsoever, and no reliance shall be placed on, the truth, accuracy, completeness, fairness andreasonableness of the contents of this Presentation. This Presentation may not be all inclusive and may not contain all of the information that you mayconsider material. Any liability in respect of the contents of, or any omission from, this Presentation is expressly excludedCertain matters discussed in this Presentation may contain statements regarding the Company’s market opportunity and business prospects that areindividually and collectively forward-looking statements. Such forward-looking statements are not guarantees of future performance and are subject toknown and unknown risks, uncertainties and assumptions that are difficult to predict. These risks and uncertainties include, but are not limited to, theperformance of the Indian economy and of the economies of various international markets, the performance of the industry in India and world-wide,competition, the company’s ability to successfully implement its strategy, the Company’s future levels of growth and expansion, technologicalimplementation, changes and advancements, changes in revenue, income or cash flows, the Company’s market preferences and its exposure to market risks,as well as other risks. The Company’s actual results, levels of activity, performance or achievements could differ materially and adversely from resultsexpressed in or implied by this Presentation. The Company assumes no obligation to update any forward-looking information contained in this Presentation.Any forward-looking statements and projections made by third parties included in this Presentation are not adopted by the Company and the Company isnot responsible for such third party statements and projections.2
Contents1Q1 FY20 Financials & Key Developments4Historical Financial Highlights2Company Overview5Vision 20203Industry Dynamics6Annexures3
Q1 FY20 Financials & KeyDevelopments
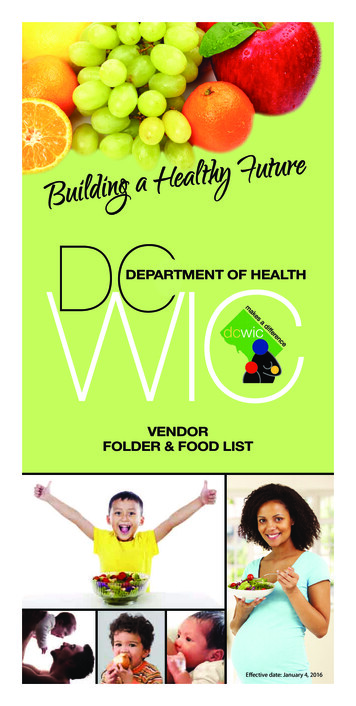
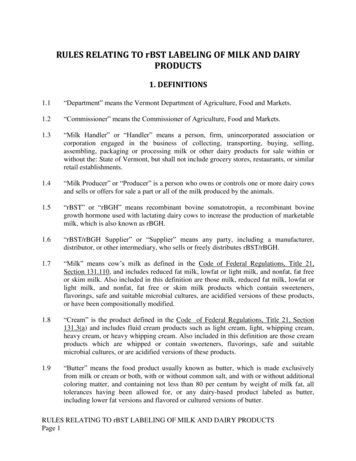
Consolidated Financial Analysis – Q1 FY20Revenue (Rs. Mn)EBITDA (Rs. Mn) 14.6%-4.6%5966,2975,494Product wise Revenue Break-up (Rs. Mn)5695,4956,29812.6%13.4%21%19.3%18.1%7%Q1 FY19Q1 FY20Q1 FY19PAT (Rs. Mn)Margins (%)EBITDA%-2.7%28327510.9%5.1%Q1 FY19Q1 FY20Q1 FY20Q1 FY1966.1%16%66.9%PAT%1%9.0%4.4%Q1 FY201.9%1.7%Q1 FY19Q1 FY20Skimmed Milk PowderMilk ProductsLiquid MilkOthers5
Key HighlightsRevenue Consolidated Revenue from Operations for Q1 FY20 reported a growth of 14.6% YoY to Rs. 6,297 million ascompared to Rs. 5,494 million in Q1 FY19. Growth was driven by an increase in revenue from Milk Products by 16% YoY to Rs. 4,211 million. Gross Profit for Q1 FY20 registered a growth of 1% YoY to Rs. 1,684 million as compared to Rs. 1668 million in Q1FY19. The compression in gross margins was mainly due to increase in milk procurement prices.Gross Profit Due to drought effect of last year and delayed monsoons, feed availability was severely constrained leading to stress atfarmer level. Therefore, raw milk prices paid to farmers increased sequentially during the quarter. We have already passed on the raw milk price increase by combination of increased consumer prices and reduced tradediscounts. The full effect of this correction will come from Q2 FY20.EBITDAPAT EBITDA for Q1 FY20 de-grew by 4.6% YoY to Rs. 569 million as compared to Rs. 596 million in Q1 FY19. EBITDA Margin for Q1 FY20 stood at 9.0% which was impacted mainly due to decline in gross margins. PAT for Q1 FY20 stood at Rs. 275 million as compared to Rs. 283 million in Q1 FY19. PAT Margin were healthy at4.4% in Q1 FY20.6
Consolidated Profit & Loss StatementParticularsQ1 FY20Q1 FY19YoYQ4 FY19QoQRevenue from Operations6,297.45,494.214.6%6,721.5-6.3%Raw Material Costs4,612.93,826.6GROSS PROFIT1,684.51,667.71.0%1,990.4-15.4%Gross Margins26.7%30.4%-370 bps29.6%-290 bpsEmployee Expenses267.1204.2258.9Other 330.0%EBITDA Margin %9.0%10.9%-190 bps6.5% 250 bpsOther 3.8478.5Finance Cost93.2101.478.1---PBT370.6377.1Tax Expense95.594.4PAT275.1282.7-2.7%312.9-12.1%PAT Margin %4.4%5.1%-70 bps4.7%-30 bpsOther Comprehensive Income0.2-0.4Total Comprehensive Income275.3282.3Exceptional ItemsAmounts in Rs. 2-2.5%316.1-12.9%7
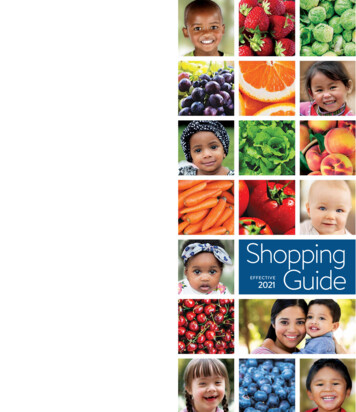
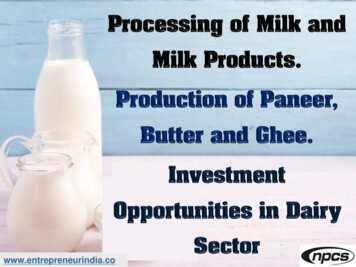
New Product Launch - Avvatar RapidSport Nutrition Whey Protein Market Size –Rs. 1,400 – 1,600 CrsGrowing at more than 25% CAGRStrengthens our Health and Nutrition PortfolioProduct Features – Only hydration drink in thecategory fortified with wheyprotein Makes an ideal intra-workoutdrink, unlike caffeine-based drinksthat tend to dehydrate the body149kcal Energy5900mg Whey Isolate123mg CalciumBlend of carbohydrates and sugars for aninstant and sustained burst of energyFastest absorebed whey protein isolatethat helps reduce muscle proteinbreakdown/catabolismPlays a vital role in muscle contractionand helps build healthy bones611mg Electrolytes1300mg BCAA20mg Vitamin CQuick replenishment of lost electrolytescaused by sweat loss during intensetraining, thus minimizing crampsPromotes protein synthesis and speedsup recovery after intensetraining/workoutsActs as a antioxidant that helps fight thedamage caused to the body duringstrenuous workouts8
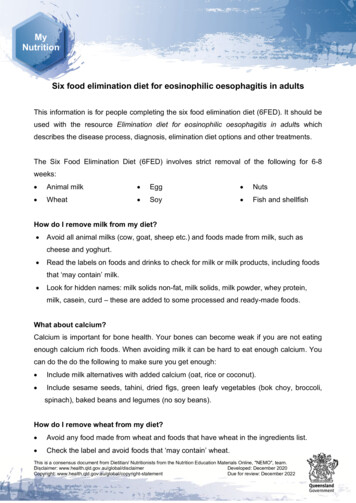
Launch of Pride of Cows in SingaporeLaunched its Farm-to-Home premium milk brand Pride ofCows in SingaporeThe company will be airlifting the milk from India’s largestdairy farm, located in Manchar, near Pune to SingaporeSingapore enjoys a reputation as a place for the wellheeled and has one of the largest per capita incomes inthe world, making it an ideal region to expand the brandFuture Plans : Aim to double the Pride of Cows revenue over the next two years Plan is to expand the product portfolio by introducing new variants under Prideof Cows9
Marketing Campaigns & Consumer Engagement InitiativesGO Cheese collaborates with Chhota BheemGO Cheese Campaign – Har Tasty Cheez Mein GO CheeseThe new campaign is an effort to educateconsumers on Go cheese being the keyingredient in their most loved dishes likepizza, fries, burgers and street food, which isbeing consumed almost every day outsidetheir home at various QSRs & hotel chainsMall activations wereconducted in 5 cities(Mumbai, Bangalore,Chennai, Nashik, Delhi)Co-branded TVC ran on POGO Channel where GO Cheesecollaborated with Chhota Bheem.Gowardhan GheeGowardhan Ghee – Festive PromotionsGo Cheese TVC Campaign #HarTastyCheezMeinGoCheeseGowardhan DahiGowardhan Dahi being promoted on Digital& Social Media PlatformsOne can check the TVC on YouTube:https://www.youtube.com/watch?v R5DoewJqX1gBeveragesPoint of Sale Material for Beverages10
Company OverviewSustainabilityInnovation
Parag at a sEstablished StrongRelationships withover 2 lakh farmersand over 3.5 lakhretail touch pointsAggregate milkprocessing capacityof 2.9 mn litres perday with the largestCheese productioncapacity in India of60 MT / day and aPaneer Capacity of20MT / dayStrongDistributionPan-IndiaDistribution Networkof 19 Depots, over140 Super Stockistsand 3,000 Distributors170 SKU’s7 BrandsRanked #1Diversified productportfolio with 170 SKU’s that cater to awide range ofcustomersGowardhanGoPride Of CowsTopp UpMilkrichAvvatarSlurpParag Milk Foodswas ranked #1 inFortune India's 'Next500‘ from #67 lastyear12
Evolution of the Company19921998Parag Milk Foods Ltd foundedCommissioned Mancharin 1992 with one purpose: plant and began manufacturingTo deliver Fresh MilkTraditional products like Butterand Diary Productsand Ghee under the brand,‘Gowardhan’2005200820102011Birth of BhagyalaxmiDairy Farm - India’s mostmodern dairy farm withthe finest InternationalEquipmentsCommissioned “Go CheeseWorld” - India’s largest cheesemanufacturing plant with acapacity of 40 MT per dayPalamaner plant wasestablished with aworld-class UHT facilityBirth of ‘Pride of Cows’, aFirst-of-its-kind premiumfarm-to home milk brand201720182018201420152016Realising the needs of ourinstitutional clients, welaunched B2B Whey ProteinRelaunched the brandParag with a new identityGot listed on the bourses,thus becoming a Publiclybranded and owned entityLaunched a 100% Wheyprotein under the brandAvvatarExtended the Health &Established our thirdNutrition Product Portfoliomanufacturing facility in Northby adding Go Protein Power & India in Sonipat, Haryana onAvvatar Advance Mass Gaineracquiring Danone’smanufacturing facility13
Our Diverse Product Portfolio catering to all segments of customersBrandsTarget Customer GroupPositioning Premium Household consumers seeking premiumquality cow’s milkHealth enthusiasts ModernChildren and the youth primarily for directconsumptionOn-the-go consumption as source ofinstant nourishment Traditional Traditional Indian recipes andcooking ingredientsIndian households14
Our Brand Power2nd Largest Player in Cheese in the India with35% Market SharePioneers of Fresh Paneer with a 75 Day Shelf LifeLeaders & Pioneers of Cow Ghee categoryunder Brand ‘Gowardhan’ GheeOwn one of the Largest Cow Farms in IndiaIndia’s First Company to launch a truly madein India B2C Whey protein powder underBrand ‘Avvatar’Leading private player in UHT Category under theBrand ‘GO’Introduced the concept of Farm-to-Homemilk under the brand ‘Pride of Cows’Converted waste into value-added products likeorganic fertilizers from cow manure and urineunder brand ‘Bhagyalaxmi Dairy Farms’15
Last mile availability from ‘Farm to Fork’Pan-India ReachDistribution NetworkRoute-to-market StrategyDepotSuper DelhiJaipur KanpurFresh MilkSiliguriGuwahatiMumbaiIndoreKolkataNagpur roducts3,000 DistributorsBulk 40 Super StockistsPatnaRanchiAhmedabadSurat19 Depots3.5 lakhs PalamanerRetail Touch pointsChennaiAndaman & NicobarInstitutionsBusinessHORECA Dedicated Sales and Marketing team comprising of over 800 personnel Sales force Automation –Better visibility of Supply Chain ManagementDisclaimer: Maps not to scale. All data, information, and maps are provided "as is" without warranty or any representation of accuracy, timeliness or completeness16
Partner with Leading Institutions and Quick Service RestaurantsInteract with Customers atthe Inception Phase ofthe Product and even helpthem to curate a menuCustomization of theproduct according to theNeedMaintaining theExclusivity of theProductStrong/ Long termRelations withCustomersSupplies To:Prominent Burger ChainsLeading Pizza ChainsMajor FMCG companiesHotels, Restaurants and Food Chains17
A Pan-India Manufacturing FootprintKey Features : Parag’s Manufacturing FootprintNewly AcquiredFacility from DanoneSonipat Plant, HaryanaRaipurManchar Plant,Pune NagpurVashi & t Technology One of the Largest Cheese Plants in India India’s 1st state-of-the-art fully integrated WheyProtein Plant Fully automated Paneer Plant World-class UHT facility India’s most Modern Dairy Farm Houses Over 2,500 Holstein Friesian CowsProcessing LocationPalamaner Plant, APMysore With an Average yield of 20-25 litres per cow vsIndia’s Average of 4-5 litres per cowTrichy Key CategoriesCapacityMilk Processing2.9 mn litres per dayCheese60MT per dayPaneer20MT per dayGhee110 MT per dayWhey Processing6 lakh litres per dayNewly Acquired Sonipat Facility & Infrastructure Currently has a Milk & Curd Processing Unit Future Plans to install processing units for pouchmilk, flavoured milk, pouch butter milk, cupcurd, misthi doi as well as expand the existingyoghurt facilityDisclaimer: Maps not to scale. All data, information, and maps are provided "as is" without warranty or any representation of accuracy, timeliness or completeness18
Farmer Relationship is an Integral part of our Business3-tier Milk Procurement ProcessTier 1Farmer ServicesProcurement NetworkNever Say No for MilkVillage collection centresprocure milkCorrect Quantity &Qualityfrom over 2 lakh farmersin 29 districtsSupplying Cattle feed atsubsidized ratesHaryanaUttarPradeshRajasthanTier 2Milk is then transported tonearby Bulk Milk Coolers(BMC) and chilledTransparent Milk PricingMadhyaPradeshBuilding Relationshipwith FarmersMaharashtraAndhraPradeshTier 3The chilled milk is thentransported in tanksto our dairy plantKarnatakaTamilNaduFuture Sourcing States postDanone’s plant AcquisitionFree Health Camps forCattlesImproving theProductivity of CowsFree Vaccinations forCattlesCurrent Sourcing StatesDisclaimer: Maps not to scale. All data, information, and maps are provided "as is" without warranty or any representation of accuracy, timeliness or completeness19
Integration of Technology across all verticalsBusiness intelligence andAnalytics captured throughSAPTheory of Constraints(Vector) Dashboard for livemonitoring of order takingand past trends of retailersOur systems provide realtime analysis of the qualityand quantity of milkprocuredSeamless integration of ourmanufacturing facilities, coldchain and our distributionnetwork of super-stockists &retailersSales Force Automation helpsto increase productivity andenhance the time spent ondriving salesDistributionManagementSystem helps with inventorymanagement and providesus with secondary sales datain real-time20
Board of DirectorsMr. Devendra ShahChairmanMr. Pritam ShahManaging DirectorMr. B. M. VyasDirectorMr. Sunil GoyalIndependent DirectorMr. Narendra AmbwaniIndependent DirectorMr. Nitin DhavalikarIndependent DirectorMrs. Radhika PereiraIndependent DirectorMr. Ramesh ChandakDirectorThe Board consists of well qualified personnel with a strong understanding on the Procurement & Production Processes with a widegamut of Industry experience in the Dairy and Consumer Space backed by innovative abilities to make the company a successful DairyFMCG company.21
Our Management TeamMr. Venkat ShankarChief Executive OfficerMr. Shashikant DalmiaChief Financial OfficerMs. Akshali ShahVP – Strategy (Sales & Marketing)He has more than 15 years of experience in theFMCG (Food) space with his most recent stint withBritannia Industries Ltd as the VP & Head of theDairy Business. Prior to that he has spent 14 years inPepsico Sales & Marketing and 9 years in PrivateEquity across numerous regions of India which hashelped him gain the experience of various trade andconsumer behaviours. He has also managed multifunctional and P&L responsibilities. He has a PGDMdegree from IIM Ahmedabad and an Engineeringdegree from IIT Kanpur.He has been with the group for the last 7 years andhas handled various functions which include DirectTaxation, Costing, Treasury & Risk Management,Corporate Finance & Accounts, Budget Planning,and Liaising with Government authorities as well asvarious accounting functions at Plant level. He isalso involved in the strategic initiatives of theGroup’s International business and Long-rangeplanning. He is a qualified Chartered Accountant.An MBA in Family Managed Business from S.P. JainInstitute of Management & Research, she is activelyinvolved in branding, marketing & advertisingstrategy, category intelligence & competitiveanalysis. She has also played a key role in therevamping the corporate identity of company.Mr. H.S. OberoiPresident - Cheese ManufacturingMrs. Rachana SanganeriaCompany Secretary & Compliance OfficerA Mozzarella Cheese manufacturing expert, he has aB. Tech degree and over 52 years of extensiveexperience in the dairy industry.Qualified Company Secretary and an AssociateMember of the Institute of Company Secretaries ofIndia. She also holds a Bachelor’s degree inCommerce and LL.B. degree from the University ofMumbai. She has over 18 years of experience as aCompany Secretary.22
Our Strategy for Value CreationIncrease Operational EfficienciesFocus on Health & NutritionLeverage in-house technological, R&D capabilitiesto: Maintain strict operational controls Enhance customer services levels Develop customised systems & processesIntroduce healthy & nutritious product variants like Whey protein powder for mass consumption and indifferent formats Colostrum products – as daily supplements High protein, low fat cheese productsOperationalEfficienciesHealth &NutritionIncrease Value-added ProductPortfolioStrengthen Our Brands Enhance brand recall through strategicbranding initiativesIncrease Ad spend on diverse channelsincluding television, newsprint, digital media ValueaddedProductBrands Increase Milk Procurement Strengthening existing farmer relationsOffer quality & quantity based incentivesSet up new collection centres & reach newdistrictsTo add 75 new bulk coolers, 100 automatedcollection systemsMilkProcurementProductReachOffer wider range of farm-to home productsunder ‘Pride of Cows’Focus on health & nutritional aspect indeveloping premium productsSell whey protein directly to consumers in theform of a branded productEnhance Product Reach Strengthen distributor & stockists base toachieve higher retail penetrationIntroduce low unit price products in Tier III citiesIdentify specific states and regions in India toincrease sales volumes23
Industry Dynamics
Indian Dairy MarketIndian Dairy Market (US 107 Bn)Organised Dairy Market(US 15 Bn)Cooperatives (US 7 Bn)Self ConsumptionTraditional Milkmen /Vendors (US 34 Bn)Private Dairies (US 8 Bn)Milk production volume break-upby Marketability54%Unorganised DairyMarket (US 92 Bn)46%Marketable MilkSource: IMARC Report – Industry size is as per market realizationsAmounts in US Billion, 1US INR 67Marketable Milk volume break-upby Segment70%Unorganised30%OrganisedSelf Consumption at Home(US 58 Bn)Organized Marketable Milk volumebreak-up by Segment45%Cooperatives55%Private Players25
Tremendous Growth Potential across Product SegmentsLiquid MilkGhee 15.0% 14.8%90,567Paneer 14.8%20,403Curd9,761 14.8%Traditional Products Growth7,358CAGR 922,40320104,3739,22439,11920142020E2010UHT MilkModern Products Growth20142020EFlavoured MilkCheese7161,552 26.4% 25.3%388194Whey (Powder)881149 27.9% 25.8%CAGR of26%2010Source: IMARC ReportAmounts in US Million, 1US INR E201020142020E26
Historical FinancialHighlights
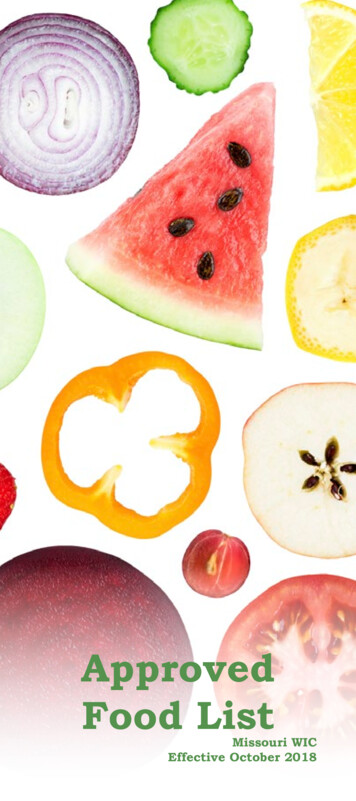
Key Financial HighlightsRevenue (Rs. Mn) 13.5%EBITDA (Rs. Mn) FY15FY18PAT (Rs. Mn)Margins (%)EBITDA% .5%5.0%FY18FY197.4%3222.2%FY15FY15 Pre IPOOn Consolidated BasisFY18FY19FY1528
Key Financial HighlightsWorking Capital (In Days)Operating Cash Flows (Rs. Mn)-5.6% 159.5%72681,591613FY18FY19FY18Fixed Assets Turnover RatioFY19Debt to Equity19.5%5.0FY18On Consolidated Basis6.00.40.3FY19FY18FY1929
Consolidated Profit & Loss StatementParticularsFY19FY18Revenue from Operations23,956.619,545.1Raw Material Costs16,573.613,678.9GROSS PROFIT7,383.05,866.2Gross Margins30.8%30.0%Employee Expenses949.9735.2Other Expenses4,198.13,198.1EBITDA2,235.01,932.9EBITDA Margin %9.3%9.9%Other 65.0%4.5%Other Comprehensive Income1.0-3.1Total Comprehensive Income1,208.2867.5EBITFinance CostExceptional ItemsPBTTax ExpensePATPAT Margin %Amounts in Rs. Million30
Consolidated Balance SheetParticularsASSETSNon-current assetsProperty, plant and equipmentCapital work-in-progressOther intangible assetsBiological assets other than bearer plantsFinancial assetsInvestmentsLoansOther financial assetsDeferred tax assets (net)Other non-current assetsSub-total - Non-Current AssetsCurrent assetsInventoriesFinancial assetsTrade receivablesCash and cash equivalentsOther Bank balancesOther current assetsSub-total - Current AssetsTOTAL - ASSETSAmounts in Rs. 815.3ParticularsEQUITY AND LIABILITIESEquityEquity Share capitalOther equitySub-total - Shareholders' fundsLIABILITIESNon-current liabilitiesFinancial liabilitiesBorrowingsProvisionsOther non-current liabilitiesSub-total - Non-current liabilitiesCurrent liabilitiesFinancial liabilitiesBorrowingsTrade payablesOther financial liabilitiesOther current liabilitiesProvisionsCurrent tax liabilities (net)Sub-total - Current liabilitiesTOTAL - EQUITY AND 3,032.6742.5113.013.861.55,964.813,815.331
Vision 202032
Vision 2020FY 2018FY 2020RevenueRs. 1,955 CrsRs. 2,700 – 3,000 CrsEBITDAMargin*10.5%11- 12%ROCE15.8%18-20%* Includes Other Income33
Annexures
India’s Favourable Dynamics offer Huge OpportunitiesRising Middle ClassPopulation & IncomeLevels Middle class households to grow from 255 million in 2015 to 586million in 2025 at a CAGR of 8.7%Rising income & disposable income to drive consumption of milk& dairy productsIndia – GDP Growth6.4%7.1% 7.5%Urbanisation Urban population expected to increase from 31.2% in 2011 to34.5% in 2021Preference for clean, hygienic & ready-to-eat milk & dairyproducts to boost organised dairy industrySimon India LimitedFY14FY17FY20E*Changing DietaryPatterns with focus onMilkShift to Packaged Food todrive Organised MarketSource: IMARC Report* As per World Bank report on Global Economic Prospects – January 2018 Milk being important source of vital nutrients especially forvegetarians, consumers are shifting away from cereals to milk &dairy products31% Indian population is vegetarian, ensuring continuous demandfor milk & dairy productsIncreasing quality & safety concerns increasing demand forpackaged food, in particular pasteurised packaged milkOrganised market share to also increase to 26%, in value terms, by202035
India Contributes 20% of Global Milk ProductionTop Milk Producing Countries (Million MT)Global - Animal Wise Milk Production - India1691741811882443.7%CowEU – t & 3%Russia31313131310.0%Brazil29303031362.1%India - Animal Wise Milk Production - 201745.0%CowBuffaloNew ce: IMARC Report, Ministry of Animal Husbandry, Dairy & Fisheries and FAO1.9%36
Milk Production in IndiaLiberalization of the sector in1991 led to entry of privateplayersDr. Verghese Kurien initiatedoperation Flood to increase MilkProduction244 4.3%18816911678 E2027EMilk Production (Million MT)Source: Ministry of Animal Husbandry, Dairy and Fisheries37
Ghee Market (Butter Oil/Cooking Oil/Clarified Butter)Key HighlightsIndia’s Ghee Market Size (in US Million)20,40317,98513,836 16.0% Ghee is traditionally used as cooking oil in 020118,030 It is the 2nd largest category in the Indian dairyindustry after Liquid Milk20132015201720182019E2020E The organized market is currently 20% of total,and is growing rapidly at a CAGR of 17%Organized vs Unorganized 00920112013OrganisedSource: IMARC Report1US INR 672015201720182019E2020E Parag is present in the “Cow Ghee” category andare not only pioneers of the category but also themost sought after brand in the segment The Cow Ghee segment is growing faster than theoverall Ghee market and has higher marginsUnorganised38
Cheese MarketKey HighlightsIndia’s Cheese Market Size (in US Million)513410 Cheese is one of the fastest growing segmentsamong dairy products in India328 25.3%54698510620102011201220131342014 Rise in food service outlets and changing foodhabits are major .0%Parag Milk FoodsBritanniaDynamix35.0%Source: IMARC Report1US INR 67 Earlier, the cheese market in India was dominatedby block cheese, slices and cubes Through innovation Parag has achieved aleadership position with a 1/3rd market shareCheese - Value Market Share7.0%2020Others Parag dominates the Institutional & HoReCasegment Maharashtra is the biggest market for cheeseconsumption, followed by Gujarat, Delhi, TamilNadu and Uttar Pradesh39
Paneer (Cottage cheese)Key HighlightsIndia’s Paneer Market Size (in US Million)9,7618,582 062013 Paneer is the third largest segment in the milkproducts category2015201720182019E2020EOrganized vs Unorganized 13OrganisedSource: IMARC Report1US INR 67 Paneer is to India what cheese is to the Westernworld and is an integral part of many Indianrecipes20152017Unorganised20182019E2020E Paneer is consumed like vegetables in Indianhouseholds and therefore purchased fresh on adaily basis With innovation in manufacturing & packaging,Parag has created a long-shelf life Fresh Paneermade from 100% cow milk Due to hygiene and consistency in taste, thetrend towards branded packaged paneer isgaining momentum40
Curd (Dahi)Key HighlightsIndia’s Curd Market Size (in US Million)7,3586,4785,6872,836 Curd industry has transformed from being aproduct that was traditionally made at home to abranded & packaged product2013 The organized curd market is growing rapidly at aCAGR of 20% with even higher growth in metros4,940 019E2020EOrganized vs Unorganized 132015201720182019E2020EOrganisedSource: IMARC Report1US INR 67 With a distinctive home-made recipe and madeof pure Cow milk, our curd is well-positioned todominate this category in major markets Parag has significant presence in major metroslike Mumbai, Pune, Nagpur, Hyderabad,Bangalore & Chennai and is now expanding intoDelhi NCR and nearby markets of North & EastUnorganised41
UHT & BeveragesIndia’s UHT Market Size (in US Million)India’s Flavoured Milk Beverages Market Size (US Million)1,5527161,239 28.4%582985 9E2020EKey Highlights In 2014, the UHT milk market accounted for less than 1% of the totalmilk market and 5% of the organized milk market However, with benefits like safety, convenience and longer shelf life,usage of UHT milk is increasing at a fast pace in major metros Milk deficit areas are switching from milk powders to UHT milk Parag has established itself as a the largest private player in thissegmentSource: IMARC Report1US INR ey Highlights Flavoured milk represents one of the fastest growing segments in theIndian dairy market due to: Indian consumers slowly substituting carbonated soft drinkswith healthier options Advent of single serve, re-sealable bottles and tetra packswhich has made milk convenient for use and easier todistribute42
Whey ProteinKey HighlightsCategoryMarket SizeHistoricalGrowth RatesSportsNutritionSegmentHealth &NutritionSegmentUS 225-300MillionUS tes, SportsEnthusiasts, GymgoersMass consumerslike children,women, agedpeopleMarket PlayersAlmost 100%Imported ProductsFew Large MNCsare presentSource: IMARC Report1US INR 67 Whey Protein market is estimated at 35,000 MT, translatinginto business potential of US 450 Million, growing upwardsof 25% Parag has the most integrated & largest whey processingfacility in the country and intends to dominate this market We have introduced ‘Avvatar’ whey protein in the sportsnutrition category and are in process of launching variousproducts under the Health & Nutrition segment as well Parag intends to not only have the Health & Nutritionbusiness as 7% of its portfolio in the medium term, but moreimportantly, intends to drive its profitability and growth forboth Cheese & Whey businesses43
Liquid Milk MarketKey HighlightsIndia’s Liquid Milk Market Size (in US Million )90,56779,01559,791 16.4%68,731 A majority (77%) of the milk sold in India isunorganized and in the form of loose milk sold 62013 The organized sector in liquid milk is highlyfragmented with several regional players and cooperatives2015201720182019E2020E Consumers are shifting from loose liquid milk tobranded packaged milk due to safety and qualityconcernsOrganized vs Unorganized 8%81.2%2013OrganisedSource: IMARC Report1US INR %201825.1%74.9%2019E26.3%73.7%2020E The organized liquid milk market is growing fasterthan the unorganized market Parag has a strong presence in urban parts o
Consolidated Financial Analysis -Q1 FY20 5,494 6,297 Q1 FY19 Q1 FY20 14.6% Revenue (Rs. Mn) 596 569 Q1 FY19 Q1 FY20-4.6% 283 275 Q1 FY19 Q1 FY20-2.7%