Transcription
Introduction to CECL QuantificationFebruary 2017
Today’s Speakers»Emil Lopez is a Director in the Enterprise Risk Solutions Group, based in New York, focusing on thedevelopment of software and analytic solutions for impairment accounting (CECL/IFRS 9).»Prior to joining the product strategy group, Mr. Lopez led risk rating and stress testing modeling projectsfor Basel and DFAST institutions.»Mr. Lopez received his MBA from New York University and received his BS in finance and businessadministration from the University of Vermont.»Dr. Jing Zhang is Managing Director and the Global Head of Moody’s Analytics Research andModeling Group. His group is responsible for the quantitative modeling behind the EDF and LGDmodels for both public and private firms, commercial real estate, portfolio and balance sheet, andinsurance analytics.»PhD from the Wharton School of the University of Pennsylvania»Editor of Risk Books “CCAR and Beyond,” and “From Incurred Loss to Expected Loss” (forthcoming)Moderator»Ed Young is a Senior Director at Moody’s Analytics. He advises clients across the Americas on riskmanagement and regulatory expectations issues around capital planning, liquidity, and credit stress testing,as well as allowance for credit loss processes.»Prior to joining Moody’s Analytics, Ed spent ten years working for the Federal Reserve. During his tenure, heparticipated on a multitude of Federal Reserve System initiatives related to capital planning, liquidityplanning, stress testing, credit risk management, interest rate risk management, and model riskmanagement.Introduction to CECL Quantification2
3About Moody’s AnalyticsLeading global provider of credit rating opinions, insight andtools for credit risk measurement and managementIndependent provider of credit rating opinionsand related information for over 100 yearsModels, data, software and research forfinancial risk analysis and relatedprofessional servicesIntroduction to CECL Quantification3
Welcome!Moody's Analytics CECL Webinar Series:Expected Credit Loss QuantificationIntroduction to CECL QuantificationTodayC&I CECL MethodologiesTuesday, March 14, 2017 1:00PM ESTTo find out more about Moody’sAnalytics perspectives on CECLand register for our webinar seriesvisit:Retail CECL MethodologiesTuesday, March 28, 2017 1:00PM ESTwww.moodysanalytics.com/ceclCRE CECL MethodologiesTuesday, February 28, 2017 1:00PM ESTStructured Assets CECL MethodologiesThursday, April 20, 2017 1:00PM EST
Polling Instructions1. Click on theicon located in theright hand corner of the WebExplatform, so that the icon is blue (asshown).2. Select your answers in the Pollingsection that appears in the righthand panel of the platform.3. Results will display after the poll hasended.Introduction to CECL Quantification5
Topic 326: Measurement of Credit Losses on FinancialInstruments; commonly known as “CECL”Who/What does it apply to?» All banks, savings associations, credit unions, and financialinstitution holding companies, regardless of asset size» Entities holding financial assets and net investment in leasesthat are not accounted for at fair value through net income» FY 2020 (after 12/15/20) for all other public business entitiesHeld forInvestmentCECLHeld for Sale» The standard requires organizations to immediately record thefull amount of credit losses that are expected over the lifetimeof the financial asset» FY 2019 (after 12/15/19) for public business entities that areSEC filersImpairmentModelPCDLoans/Leases» Includes: Loans, debt securities, trade receivables, netinvestments in leases, off-balance-sheet credit exposures,reinsurance receivables, etc.When does it go into effect?InvestmentStrategyLower of Am. CostMethod/ MarketCECLHeld to MaturityPCDDebtSecuritiesAvailable forSaleAFS Credit LossTradingFV-NIPCD» FY 2021 (after 12/15/21) for all other entities,» Early adoption permitted December 15, 2018New ImpairmentMethodOther FVOCl/FVPL MethodsIntroduction to CECL Quantification6
In essence, the new standard is about improving themeasurement of and reporting on credit lossesInstitutions will need to measure and record immediately all expected credit losses (ECL) overthe life of their financial assets based on:1)Past events, including historical experience2)Current conditions3)Reasonable and supportable forecastsIf it effects the collectability of the reported amount, it should be considered!» Although “reasonable and supportable forecasts” are required, an entity will not need to create aneconomic forecast over the entire contractual life of long-dated financial assets» Institutions will have significant discretion over how they measure expected credit losses» ECL recorded at origination and updated at subsequent reporting datesIntroduction to CECL Quantification7
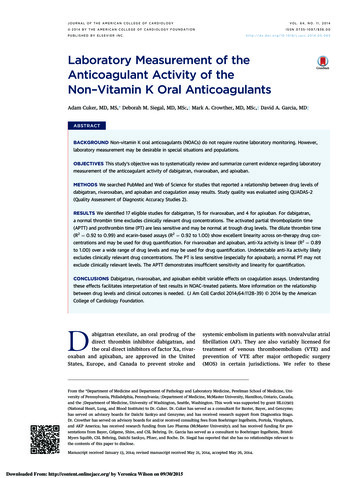
Hypothetical illustration of the expected credit lossquantification processHistorical ExperienceEconomic ForecastCurrent Conditions21Qualitative Adjustment3ACL (Very High)DeterioratingACL (High)Unfavorable4Example:3.00%ACL (Med-High)ImprovingCECLACL OsDeterioratingLevel of theAllowance forCredit LossesACL (Med-Low)FavorableACL (Low)ImprovingACL (Very Low)Example:0.03%Impact on Allowance for Credit Losses (“ACL”)ICLM Incurred Credit Loss Model (current GAAP) CECL Current Expected Credit Loss model (effective 2019-2021)Introduction to CECL Quantification8
The ASU requires entities to apply one of twoapproaches to evaluate expected credit lossesCollective (“Pool”) EvaluationIndividual Evaluation» Required for financial assets when similarrisk characteristic(s) exists» Required when a financial asset does notshare risk characteristics with its otherfinancial assetsExamples of Shared Risk Characteristics» Internal or external credit score» Effective interest rate» Risk ratings or classification» Term» Financial asset type» Geographical location» Collateral type» Industry of the borrower» Size» VintageIntroduction to CECL Quantification9
Key Modeling Challenges for CECL» Model methodology– Loan-level versus cohort-level?– Can we leverage existing stress testing, Basel or other models? How?» Incorporating macroeconomic drivers in accounting:– Which economic scenario? How many?– Demonstrating relationship to credit losses– Sensitivity analysis and scenario spreads» Lifetime length determination: particularly for revolving products– ECL for off balance sheet exposures to be reported separately» Benchmarking to industry performance and previous crisis– Support forecasts for audit» Disclosures: models, production processes and reporting platforms need tosupport required reportingIntroduction to CECL Quantification10
1. What is the most significant challenge you anticipatein CECL implementation?A. Data availability for ECL modelingB. ECL quantificationC. Scenario designD. Qualitative/Management Overlay methodologyE. Performance (i.e., speed of execution)F. Data and processes governance/controlsIntroduction to CECL Quantification11
What is the most significant challenge you anticipate in CECL on to CECL Quantification12
CECL Calculation: Strategic and Tactical ConsiderationsCriteria»»»»»Incorporate historical experienceIncorporate current conditionsIncorporate forward-looking informationForecast life of loan ECLSegment and granularity o materialityData availability: historical and reporting-date dataDevelopment costs: short-term vs. long-term investmentsTiming»Invest in data, measurement and system capabilities for both CECLand other applicationsConsider the impact of less granular quantification oncompetitivenessConsider the impacts on lending and other business decisionsCoordination and alignment with other processesInteractions with various internal and external stakeholdersStrategicConsiderations»»»»One Size Does Not Fit All!Introduction to CECL Quantification13
Coordination and Alignment With Other Processes---And Considering the interactions with various stakeholdersAuditor andexternal marketOrigination, relationshipmanagement, PortfoliomanagementCustomersLoan PricingFinance and TreasuryALMCECLRisk ManagementCCAR/DFASTScenarioForecastAPlanning and BudgetingBankRegulatorsIntroduction to CECL Quantification14
Possible Methodologies» Loss rate methods– Average charge-off method– Static pool analysis– Vintage analysis» PD/LGD rating method– Basel modelsFor most banks, thetypical approach is toleverage or build on topof existing approaches– Internal rating models– Granular stress testing models» Roll-rate method (migration analysis)» Discounted cash flow analysisBoth statistical and qualitative analysis can be applied to any method to» Incorporate forward-looking assessment (e.g. linking loss rate to forecast)» Account for life-time lossIntroduction to CECL Quantification15
2. What is/are the approach(es) you use in ALLLestimation today for your commercial portfolios?A. Loss rates based on peer institution data (e.g. call report data)B. Loss rates based on internal experience (e.g. static pool analysis)C. Rating migration / roll rateD. Vintage analysisE. Dual risk ratings (i.e., PD / LGD)F. OtherIntroduction to CECL Quantification16
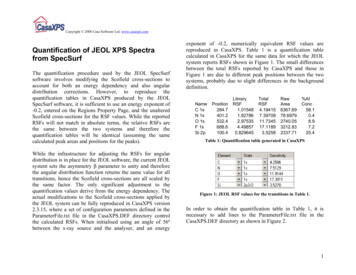
What is the approach you use in ALLL estimation today for yourcommercial portfolios?45%40%35%30%25%20%15%10%5%0%Loss rates based Loss rates based Rating migration /on peer institutionon internalroll ratedata (e.g. call report experience (e.g.data)static pool analysis)Vintage analysisDual risk ratings(i.e., PD / LGD)OtherNo AnswerIntroduction to CECL Quantification17
3. What is/are the approach(es) you use in ALLLestimation today for your retail portfolios?A. Loss rates based on peer institution data (e.g. call report data)B. Loss rates based on internal experience (e.g. static pool analysis)C. Rating migration / roll rateD. Vintage analysisE. Dual risk ratings (i.e., PD / LGD)F. OtherIntroduction to CECL Quantification18
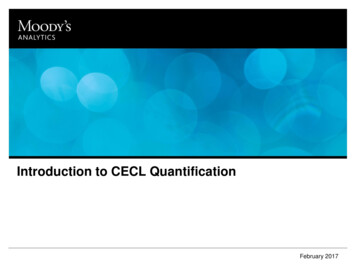
What is the approach you use in ALLL estimation today for yourretail portfolios?60%50%40%30%20%10%0%Loss rates based Loss rates based Rating migration /on peer institutionon internalroll ratedata (e.g. call report experience (e.g.data)static pool analysis)Vintage analysisDual risk ratings(i.e., PD / LGD)OtherNo AnswerIntroduction to CECL Quantification19
Building Upon the Loss Rate ApproachStarting PointEnhancementConsiderations» Apply a historic lossrate percentage, eithercollective or individualevaluation† Easy to implement» Average charge-offmethod††» Static pool analysis» Vintage analysis†Incorporate forwardlooking assessmentLink loss rate directlyor indirectly to macroforecastExtend annual loss tolife-time lossLeverage externaldata if appropriate Close to the currentpractice “Q” factor can be usedto incorporate forwardlooking assessment Proper segmentationand granularity isimportant Considering thelinkage with businessdecisions such as loanunderwritingIntroduction to CECL Quantification20
Leveraging the Roll Rate ApproachStarting PointEnhancementConsiderations» Compute percentagesof assets that will “roll”or “migrate” to a moresevere risk rating ordelinquency status.†Incorporate forwardlooking assessment†Linking the “roll” or“migration” tomacroeconomicforecast Linking creditmigration tomacroeconomicforecast: statisticallyor qualitatively?» Roll-rate percentagesare applied to thebalance in eachcategory to estimatethe amount that willmigrate to the nextcategory.†Incorporate life-timeloss Consider thelinkage withbusiness decisionssuch as setting loanterms» Aggregate totalmigration for eachcategory to determinethe allowance.Introduction to CECL Quantification21
Leveraging the Dual Rating FrameworkStarting PointEnhancementConsiderations Easier to implementfor Basel IRB banks(this is the mostpopular approachfor IFRS 9implementation)» The PD/LGD/EADframework for BaselIRB PD†Adjust “regulatory”definition to“accounting”definition» The dual ratingframework currentlyused in businessdecision such as loanpricing, limit setting, riskmonitoring and settingreserve†TTC to PITconversion toincorporate forwardlooking assessment There is a wealth ofdata and expertisein place as a resultof IRB compliance†Extend term structureof PD and LGD Easier to assessimpact on businessdecisions such assetting loan termpricing and termsIntroduction to CECL Quantification22
PD, LGD, EAD Modeling Under Basel and CECLBASELCECLPD1. 1-year TTC (through-the-cycle) PD based onhistorical long run average default rate;2. Subject to prescribed regulatory floors (e.g.3.b.p for some portfolio)3. Estimated based on minimum five years ofhistorical data1. Term structure of PDs2. Point-in-time (PIT) PD measures;3. Include historical, current and forward lookingelements at reporting date for all possibleoutcomes;4. No prescribed regulatory floorsLGD1. “Downturn” LGD to reflect adverse economicscenarios.2. Consider both direct and indirect costsassociated with collection of the exposure;3. Regulatory prescribed floors;4. Discount rate based on weighted average costof capital or risk-free rate;5. Min. 5 year data for retail and 7 year forsovereign, corporate and bank exposures1. “Current ” or “forward looking” to reflect impact ofeconomic scenarios;2. Only costs directly attributable to the collection ofrecoveries (remove the collective cost in BASELLGD);3. Discount rate based effective interest rate;4. Timely evaluations of collateral value andconsideration of future value changesEAD1. “Downturn” EAD to reflect what would beexpected during a period of economic downturnconditions;2. Estimates take into consideration of on/offbalance sheet exposures adjusted forestimated future draw downs over the lifetime.1. Consider all contractual terms (e.g. prepayment,usage, call and similar options) over the lifetime;2. Adjust for firm’s estimates for the undrawncommitmentsIntroduction to CECL Quantification23
Leveraging the CCAR/DFAST Stress Testing FrameworkStarting Point» CCAR/DFAST or otherstress testing models» These models havegone through extensiveand rigorous validationand benchmark» Resource and expertisebuilt for CCAR/DFASTEnhancementConsiderations† More seamlessintegration withCCAR/DFASTprocessCalibrate the models toboth “adverse/stress”and “normal” scenarios†Extend term structureof PD and LGD†Enhance segmentationand granularity There is a wealth ofdata and expertisealready in place as aresult of CCARimplementation Consider the linkagewith other businessapplications such asunderwriting, pricingof loans etc.Introduction to CECL Quantification24
4. How do you plan to incorporate forward-lookinginformation to expected credit loss estimates?A. Modeled: Linking macroeconomic variables to loss estimates quantitativelyB. Overlay: adding impact of macroeconomic forecast to the expected credit loss throughmore qualitative measuresC. Mix of quantitative models and qualitative overlaysD. Have not decidedIntroduction to CECL Quantification25
How do you plan to incorporate forward-looking information to expected credit ed: Linkingmacroeconomic variables toloss estimates quantitativelyOverlay: adding impact ofmacroeconomic forecast tothe expected credit lossthrough more qualitativemeasuresMix of quantitative modelsand qualitative overlaysHave not decidedNo AnswerIntroduction to CECL Quantification26
Business Impacts of CECL can be Significant and ProfoundLoss allowance under CECL and FAS 5&114 candiffer materially due to differences» between PIT and TTC PDs» lifetime expected loss and the assumed lossemergence periodCECL may affect» Fluctuation / volatility in provision and earnings,» Available capitalThese impacts on earnings and capital may besignificant with consequences for» Loan origination---loan product term and pricing» Customer relationship» Hedging and other credit portfolio decisionsWill my approaches to estimating CECL help track and monitor these impacts? Will theyhelp design metrics to reduce potential volatility—e.g. by diversifying loans within portfoliosto reduce concentrations of credit risk or adjusting maturities of loans?Introduction to CECL Quantification27
Key Takeaways» Modeling expected credit losses represents one of they key challenges of theCECL accounting standard» Existing risk measurement tools used for regulatory capital, internal ratings,and stress testing can serve as good starting points. However, necessaryenhancements may include:̶Segmentation granularity̶Adjustment for current conditions̶Linkage to forward-looking scenarios̶Extension to life of loan̶Adjustment for built-in bias (i.e. conservatism)» The appropriate approach ultimately depends on portfolio- and organizationspecific considerations, including data availability and interconnectedness ofbanking functions» The rest of the webinar series will focus on modeling considerations forspecific asset classesIntroduction to CECL Quantification28
Welcome!Moody's Analytics CECL Webinar Series:Expected Credit Loss QuantificationIntroduction to CECL QuantificationTodayC&I CECL MethodologiesTuesday, March 14, 2017 1:00PM ESTTo find out more about Moody’sAnalytics perspectives on CECLand register for our webinar seriesvisit:Retail CECL MethodologiesTuesday, March 28, 2017 1:00PM ESTwww.moodysanalytics.com/ceclCRE CECL MethodologiesTuesday, February 28, 2017 1:00PM ESTStructured Assets CECL MethodologiesThursday, April 20, 2017 1:00PM EST
Moody’s Credit Loss and Impairment Analysis SuiteSolutions to Support CECL Impairment CalculationEconomicScenariosAnalysis &ReportingCreditDataModeling &AdvisoryServicesCreditModeling &ELCalculationQualitativeOverlayManagementWorkflow andAutomationIntroduction to CECL Quantification30
2017 Moody’s Corporation, Moody’s Investors Service, Inc., Moody’s Analytics, Inc. and/or their licensorsand affiliates (collectively, “MOODY’S”). All rights reserved.CREDIT RATINGS ISSUED BY MOODY'S INVESTORS SERVICE, INC. AND ITS RATINGS AFFILIATES(“MIS”) ARE MOODY’S CURRENT OPINIONS OF THE RELATIVE FUTURE CREDIT RISK OF ENTITIES,CREDIT COMMITMENTS, OR DEBT OR DEBT-LIKE SECURITIES, AND CREDIT RATINGS ANDRESEARCH PUBLICATIONS PUBLISHED BY MOODY’S (“MOODY’S PUBLICATIONS”) MAY INCLUDEMOODY’S CURRENT OPINIONS OF THE RELATIVE FUTURE CREDIT RISK OF ENTITIES, CREDITCOMMITMENTS, OR DEBT OR DEBT-LIKE SECURITIES. MOODY’S DEFINES CREDIT RISK AS THERISK THAT AN ENTITY MAY NOT MEET ITS CONTRACTUAL, FINANCIAL OBLIGATIONS AS THEYCOME DUE AND ANY ESTIMATED FINANCIAL LOSS IN THE EVENT OF DEFAULT. CREDIT RATINGSDO NOT ADDRESS ANY OTHER RISK, INCLUDING BUT NOT LIMITED TO: LIQUIDITY RISK, MARKETVALUE RISK, OR PRICE VOLATILITY. CREDIT RATINGS AND MOODY’S OPINIONS INCLUDED INMOODY’S PUBLICATIONS ARE NOT STATEMENTS OF CURRENT OR HISTORICAL FACT. MOODY’SPUBLICATIONS MAY ALSO INCLUDE QUANTITATIVE MODEL-BASED ESTIMATES OF CREDIT RISKAND RELATED OPINIONS OR COMMENTARY PUBLISHED BY MOODY’S ANALYTICS, INC. CREDITRATINGS AND MOODY’S PUBLICATIONS DO NOT CONSTITUTE OR PROVIDE INVESTMENT ORFINANCIAL ADVICE, AND CREDIT RATINGS AND MOODY’S PUBLICATIONS ARE NOT AND DO NOTPROVIDE RECOMMENDATIONS TO PURCHASE, SELL, OR HOLD PARTICULAR SECURITIES.NEITHER CREDIT RATINGS NOR MOODY’S PUBLICATIONS COMMENT ON THE SUITABILITY OF ANINVESTMENT FOR ANY PARTICULAR INVESTOR. MOODY’S ISSUES ITS CREDIT RATINGS ANDPUBLISHES MOODY’S PUBLICATIONS WITH THE EXPECTATION AND UNDERSTANDING THAT EACHINVESTOR WILL, WITH DUE CARE, MAKE ITS OWN STUDY AND EVALUATION OF EACH SECURITYTHAT IS UNDER CONSIDERATION FOR PURCHASE, HOLDING, OR SALE.MOODY’S CREDIT RATINGS AND MOODY’S PUBLICATIONS ARE NOT INTENDED FOR USEBY RETAIL INVESTORS AND IT WOULD BE RECKLESS AND INAPPROPRIATE FOR RETAILINVESTORS TO USE MOODY’S CREDIT RATINGS OR MOODY’S PUBLICATIONS WHEN MAKING ANINVESTMENT DECISION. IF IN DOUBT YOU SHOULD CONTACT YOUR FINANCIAL OR OTHERPROFESSIONAL ADVISER.ALL INFORMATION CONTAINED HEREIN IS PROTECTED BY LAW, INCLUDING BUT NOT LIMITED TO,COPYRIGHT LAW, AND NONE OF SUCH INFORMATION MAY BE COPIED OR OTHERWISEREPRODUCED, REPACKAGED, FURTHER TRANSMITTED, TRANSFERRED, DISSEMINATED,REDISTRIBUTED OR RESOLD, OR STORED FOR SUBSEQUENT USE FOR ANY SUCH PURPOSE, INWHOLE OR IN PART, IN ANY FORM OR MANNER OR BY ANY MEANS WHATSOEVER, BY ANYPERSON WITHOUT MOODY’S PRIOR WRITTEN CONSENT.All information contained herein is obtained by MOODY’S from sources believed by it to be accurate andreliable. Because of the possibility of human or mechanical error as well as other factors, however, allinformation contained herein is provided “AS IS” without warranty of any kind. MOODY'S adopts all necessarymeasures so that the information it uses in assigning a credit rating is of sufficient quality and from sourcesMOODY'S considers to be reliable including, when appropriate, independent third-party sources. However,MOODY’S is not an auditor and cannot in every instance independently verify or validate information receivedin the rating process or in preparing the Moody’s Publications.To the extent permitted by law, MOODY’S and its directors, officers, employees, agents, representatives,licensors and suppliers disclaim liability to any person or entity for any indirect, special, consequential, orincidental losses or damages whatsoever arising from or in connection with the information contained hereinor the use of or inability to use any such information, even if MOODY’S or any of its directors, officers,employees, agents, representatives, licensors or suppliers is advised in advance of the possibility of suchlosses or damages, including but not limited to: (a) any loss of present or prospective profits or (b) any loss ordamage arising where the relevant financial instrument is not the subject of a particular credit rating assignedby MOODY’S.To the extent permitted by law, MOODY’S and its directors, officers, employees, agents, representatives,licensors and suppliers disclaim liability for any direct or compensatory losses or damages caused to anyperson or entity, including but not limited to by any negligence (but excluding fraud, willful misconduct or anyother type of liability that, for the avoidance of doubt, by law cannot be excluded) on the part of, or anycontingency within or beyond the control of, MOODY’S or any of its directors, officers, employees, agents,representatives, licensors or suppliers, arising from or in connection with the information contained herein orthe use of or inability to use any such information.NO WARRANTY, EXPRESS OR IMPLIED, AS TO THE ACCURACY, TIMELINESS, COMPLETENESS,MERCHANTABILITY OR FITNESS FOR ANY PARTICULAR PURPOSE OF ANY SUCH RATING OROTHER OPINION OR INFORMATION IS GIVEN OR MADE BY MOODY’S IN ANY FORM OR MANNERWHATSOEVER.Moody’s Investors Service, Inc., a wholly-owned credit rating agency subsidiary of Moody’s Corporation(“MCO”), hereby discloses that most issuers of debt securities (including corporate and municipal bonds,debentures, notes and commercial paper) and preferred stock rated by Moody’s Investors Service, Inc. have,prior to assignment of any rating, agreed to pay to Moody’s Investors Service, Inc. for appraisal and ratingservices rendered by it fees ranging from 1,500 to approximately 2,500,000. MCO and MIS also maintainpolicies and procedures to address the independence of MIS’s ratings and rating processes. Informationregarding certain affiliations that may exist between directors of MCO and rated entities, and between entitieswho hold ratings from MIS and have also publicly reported to the SEC an ownership interest in MCO of morethan 5%, is posted annually at www.moodys.com under the heading “Investor Relations — CorporateGovernance — Director and Shareholder Affiliation Policy.”Additional terms for Australia only: Any publication into Australia of this document is pursuant to the AustralianFinancial Services License of MOODY’S affiliate, Moody’s Investors Service Pty Limited ABN 61 003 399657AFSL 336969 and/or Moody’s Analytics Australia Pty Ltd ABN 94 105 136 972 AFSL 383569 (asapplicable). This document is intended to be provided only to “wholesale clients” within the meaning of section761G of the Corporations Act 2001. By continuing to access this document from within Australia, yourepresent to MOODY’S that you are, or are accessing the document as a representative of, a “wholesaleclient” and that neither you nor the entity you represent will directly or indirectly disseminate this document orits contents to “retail clients” within the meaning of section 761G of the Corporations Act 2001.MOODY’S credit rating is an opinion as to the creditworthiness of a debt obligation of the issuer, not on theequity securities of the issuer or any form of security that is available to retail investors. It would be recklessand inappropriate for retail investors to use MOODY’S credit ratings or publications when making aninvestment decision. If in doubt you should contact your financial or other professional adviser.Additional terms for Japan only: Moody's Japan K.K. (“MJKK”) is a wholly-owned credit rating agencysubsidiary of Moody's Group Japan G.K., which is wholly-owned by Moody’s Overseas Holdings Inc., awholly-owned subsidiary of MCO. Moody’s SF Japan K.K. (“MSFJ”) is a wholly-owned credit rating agencysubsidiary of MJKK. MSFJ is not a Nationally Recognized Statistical Rating Organization (“NRSRO”).Therefore, credit ratings assigned by MSFJ are Non-NRSRO Credit Ratings. Non-NRSRO Credit Ratingsare assigned by an entity that is not a NRSRO and, consequently, the rated obligation will not qualify forcertain types of treatment under U.S. laws. MJKK and MSFJ are credit rating agencies registered with theJapan Financial Services Agency and their registration numbers are FSA Commissioner (Ratings) No. 2and 3 respectively.MJKK or MSFJ (as applicable) hereby disclose that most issuers of debt securities (including corporate andmunicipal bonds, debentures, notes and commercial paper) and preferred stock rated by MJKK or MSFJ (asapplicable) have, prior to assignment of any rating, agreed to pay to MJKK or MSFJ (as applicable) forappraisal and rating services rendered by it fees ranging from JPY200,000 to approximately JPY350,000,000.MJKK and MSFJ also maintain policies and procedures to address Japanese regulatory requirements.Introduction to CECL Quantification31
B. Loss rates based on internal experience (e.g. static pool analysis) C. Rating migration / roll rate D. Vintage analysis E. Dual risk ratings (i.e., PD / LGD) F. Other. Introduction to CECL Quantification 19 0% 10% 20% 30% 40% 50% 60% Loss rates based on peer institution data (e.g. call report data) Loss rates based