Transcription
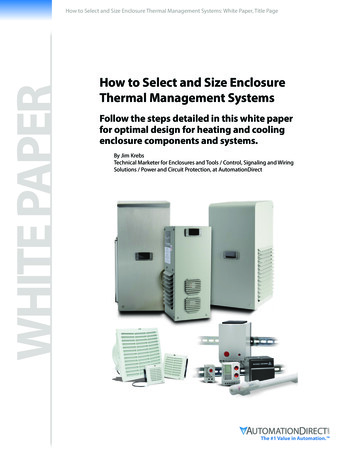
Spot SpeedSelect Study MethodologySelect LocationComplete StudyDocument1. Determine the issue at hand2. Does the study require a small or large sample3. Select the stopwatch, radar meter, or pneumaticroad tube method1. Select the proper location2. Plan the data collection preparations3. Select a day (Tuesday, Wednesday,or Thursday)4. Complete the pre-study documentation1. Collect the data2. Evaluate the data3. Calculate the speed percentiles1. Finalize the report2. File the report3. Communicate the results
INTRODUCTIONSpeed is an important transportation consideration because it relates to safety, time, comfort,convenience, and economics. Spot speed studies are used to determine the speed distribution of a trafficstream at a specific location. The data gathered in spot speed studies are used to determine vehicle speedpercentiles, which are useful in making many speed-related decisions. Spot speed data have a number ofsafety applications, including the following (Robertson 1994):1. Determining existing traffic operations and evaluation of traffic control devicesa. Evaluating and determining proper speed limitsb. Determining the 50th and 85th speed percentiles (explained below)c. Evaluating and determining proper advisory speedsd. Establishing the limits of no-passing zonese. Determining the proper placements of traffic control signs and markingsf. Setting appropriate traffic signal timing2. Establishing roadway design elementsa. Evaluating and determining proper intersection sight distance (for more information referto Chapter 4 in this handbook)b. Evaluating and determining proper passing sight distance (for more information refer toChapter 3 in the AASHTO Green Book)c. Evaluating and determining proper stopping sight distance (for more information refer toChapter 4 in this handbook)3. Assessing roadway safety questionsa. Evaluating and verifying speeding problemsb. Assessing speed as a contributor to vehicle crashesc. Investigating input from the public or other officials4. Monitoring traffic speed trends by systematic ongoing speed studies5. Measuring effectiveness of traffic control devices or traffic programs, including signs andmarkings, traffic operational changes, and speed enforcement programsFor a spot speed study at a selected location, a sample size of at least 50 and preferably 100 vehicles isusually obtained (Ewing 1999). Traffic counts during a Monday morning or a Friday peak period mayshow exceptionally high volumes and are not normally used in the analysis; therefore, counts are usuallyconducted on a Tuesday, Wednesday, and Thursday. Spot speed data are gathered using one of threemethods: (1) stopwatch method, (2) radar meter method, or (3) pneumatic road tube method. Thesemethods are described in this chapter in order from least expensive to most expensive. The stopwatchmethod is the least expensive and least accurate of the methods.Spot Speed2.1
SPEED PERCENTILES ANDAND HOW TO USE THEMSpeed percentiles are tools used to determine effective and adequate speed limits. The two speedpercentiles most important to understand are the 50th and the 85th percentiles. The 50thpercentile is the median speed of the observed data set. This percentile represents the speed atwhich half of the observed vehicles are below and half of the observed vehicles are above. The50th percentile of speed represents the average speed of the traffic stream. The 85th percentile isthe speed at which 85% of the observed vehicles are traveling at or below. This percentile is usedin evaluating/recommending posted speed limits based on the assumption that 85% of the driversare traveling at a speed they perceive to be safe (Homburger et al. 1996). In other words, the 85thpercentile of speed is normally assumed to be the highest safe speed for a roadway section.Weather conditions may affect speed percentiles. For example, observed speeds may be slowerin rainy or snowy conditions.A frequency distribution table is a convenient way to determine speed percentiles. An example isgiven in Table 2.1. The frequency of vehicles is the number of vehicles recorded at each speed.The cumulative frequency is the total of each of the numbers (frequencies) added together rowby row from lower to higher speed. The fourth column is a running percentage of the cumulativefrequency.Table 2.1. Example Frequency Distribution TableSpeed (mph)1518212427303336394245482.2Frequency 72%86%92%98%99%100%SpeedPercentile50th85thSpot Speed
The 50th and 85th speed percentiles are determined from the cumulative percent column. For theexample data in Table 2.1, the 50th percentile falls between 27 and 30 mph and the 85thpercentile falls between 33 and 36 mph. The calculation of speed percentiles is easier if a samplesize of 100 vehicles is collected. When the sample size equals 100 vehicles, the cumulativefrequency and cumulative percent are the same.As can be observed from Table 2.1, the exact 50% and 85% (50th and 85th percentiles) are notfound in the cumulative percent column. To reach these exact percentages, a calculation iscompleted using percentages and speeds from the distribution table. Shown below is the equationfor calculating speed percentiles:SD PD Pmin( S S min ) S min ,Pmax Pmin max(2.1)where S D speed at PD , PD percentile desired, Pmax higher cumulative percent, Pmin lowercumulative percent, S max higher speed, and S min lower speed.Example speed percentile calculations follow, using the example frequency distribution table inTable 2.1. The 50th percentile of speed ( PD 50%) falls between 27 and 30 mph (see Table 2.1),so S max 30 mph and S min 27 mph. The higher cumulative percent ( Pmax ) is 54%, and thelower cumulative percent ( Pmin ) is 23%. Therefore, to find S D at PD 50%,SD 50% 23%( 30 mph 27 mph ) 27 mph 29.6 mph.54% 23%The 85th percentile of speed ( PD 85%) falls between 33 and 36 mph (see Table 2.1), so S max 36 mph and S min 33 mph. The higher cumulative percent ( Pmax ) is 86%, and the lowercumulative percent ( Pmin ) is 72%. To find S D at PD in this case (85th percentile of speed),SD Spot Speed85% 72%(36 mph 33 mph ) 33 mph 35.8 mph.86% 72%2.3
(1) STOPWATCH METHODThe stopwatch method can be used to successfully complete a spot speed study using a smallsample size taken over a relatively short period of time. The stopwatch method is a quick andinexpensive method for collecting speed data.Preparation Checklist for a Stopwatch Spot Speed StudyWhen preparing for a spot speed study using a stopwatch, use the checklist in Table 2.2. Thechecklist may be modified or expanded as necessary.Table 2.2. Stopwatch Spot Speed Study Preparation ChecklistStep When CompleteNotesObtain stopwatchObtain backup stopwatchObtain 50–100 foot tapeObtain data collection formsObtain hardhat and safety vestObtain brightly colored reference postsSelect time and dayContact local law enforcementOther:If an agency does not possess the equipment necessary to complete a spot speed study using astopwatch, it may be obtained from the Iowa DOT, another jurisdiction, or a responsibleconsulting firm.Key Steps to a Stopwatch Spo t Speed StudyA stopwatch spot speed study includes five key steps:1. Obtain appropriate study length.2. Select proper location and layout.3. Record observations on stopwatch spot speed study data form.4. Calculate vehicle speeds.5. Generate frequency distribution table and determine speed percentiles.2.4Spot Speed
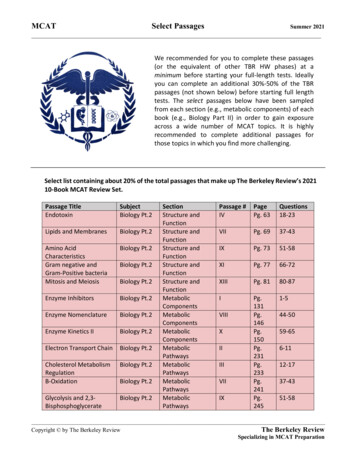
Obtain Appropriate Study LengthThe study length is important because it is used in the calculation of vehicle speeds. Table 2.3provides recommended study lengths, which are based on the average speed of the traffic stream.Using these recommended study lengths makes speed calculations straightforward and lessconfusing. If these lengths are not appropriate, another length can be used assuming it is longenough for reliable observer reaction times.Table 2.3. Recommended Spot Speed Study LengthsTraffic Stream Average SpeedBelow 25 mph25–40 mphAbove 40 mphRecommended Study Length(feet)88176264Select Proper Location and LayoutFigure 2.1 illustrates a typical layout for conducting a spot speed study using a stopwatch. Whenselecting a location and layout, care must be exercised so that the observer can clearly see anyvertical reference posts. The observer should be positioned higher than the study area and belooking down. The position could be on a bridge or a roadway back slope. The observer shoulduse reference points to aid in collecting the elapsed time it takes a vehicle to travel through thestudy area. The reference point to start timing may be a brightly colored vertical post. Thereference point to end timing may be a tree or a signpost in the observer’s sight line. An accuratesketch of the site should be documented, including number of lanes, position of observer, anddescription of reference points (see Figure 2.1 for an example).Spot Speed2.5
ObserverBrightly ColoredReference PostXStudy LengthApproaching VehicleEnd TimingStart TimingFigure 2.1. Stopwatch Spot Speed Study LayoutRecord Observations on Stopwatch Spot Speed Data FormOn the stopwatch spot speed data form (a blank form is provided in Appendix A.1), the observerrecords the date, location, posted speed limit, weather conditions, start time, end time, and downtime. As the front wheels of a vehicle (or only the lead vehicle in a group) cross a mark orpavement crack at the beginning of the predetermined study length, the observer starts thestopwatch. The watch is stopped when the vehicle’s front wheels pass a reference line in front ofthe observer. A slash is recorded on the data form corresponding to the elapsed time observed.Calculate Vehicle SpeedsTo calculate vehicle speed, use the predetermined study length and the elapsed time it took thevehicle to move through the course (as recorded on the stopwatch data form) in the followingformula (Robertson 1994):V D,1.47T(2.2)where V spot speed (mph), D length (feet), and T elapsed time (seconds). In the equation,1.47 is a constant that converts units of feet per second into miles per hour. For example, if thespot speed study length is 100 feet and the motorist’s elapsed time is 2.5 seconds, the motorist istraveling at2.6Spot Speed
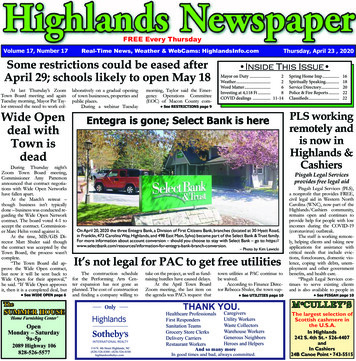
100 feet 27 mph.1.47( 2.5 seconds )Generate Frequency Distribution Table and Determine Speed PercentilesDetermine the 50th and 85th speed percentiles using a frequency distribution table andcalculations as described earlier.Example Stopwatch Spot Speed StudyThe city of Cottonwood Glen received a complaint of afternoon traffic speeding in a residentialarea. The city suspected this was related to students leaving a nearby high school. The first actiontaken by the city was to quantify the facts by conducting a spot speed study. The city decided touse the stopwatch method because of their limited resources.A location was selected near the intersection of 4th Street and University Avenue, approximatelytwo blocks from the high school and where the city had received multiple speeding complaintsfrom residents. The posted speed limit is 30 mph. The study was conducted on a Wednesday andstarted at 3:00 p.m. The time was selected to correspond to the period when most high schoolstudents leave the school. The study continued until a sample size of 100 vehicles was measured.The study length of 176 feet was used because the posted speed limit is between 25 and 40 mph,as shown in Table 2.3. The study layout is illustrated in Figure 2.2.Spot Speed2.7
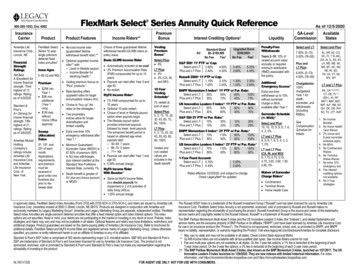
ObserverXVertical ReferencePointNorth176 ftUniversity AvenueStop TimingBegin TimingTreeReference PointFigure 2.2. Example Stopwatch Spot Speed Study LayoutThe vertical reference point is the “begin timing” reference. A tree is the “stop timing” referencepoint. This vertical reference point helps with the accuracy of timing by providing a line-of-sightto aid the observer. The results of the study are shown in Figure 2.3 (data form) and Table 2.4(distribution table). Figure 2.3 shows elapsed time in predetermined 0.2-second intervals(Robertson 1994).The study shows that the 50th percentile or median speed falls between 27.2 and 28.9 mph, andthe 85th percentile of speed falls between 33.3 and 35.2 mph. Equation 2.1 is used to find theexact speeds for the 50th and 85th percentiles of speed. For the 50th percentile of speed, PD 50%, Pmax 54%, Pmin 41%, S max 28.9 mph, and S min 27.2 mph, soSD 50% 41%( 28.9 mph 27.2 mph ) 27.2 mph 28.4 mph.54% 41%For the 85th percentile of speed, PD 85%, Pmax 92%, Pmin 83%, S max 35.2 mph, and S min 33.3 mph, soSD 2.885% 83%( 35.2 mph 33.3 mph ) 33 mph 33.4 mph.92% 83%Spot Speed
Date: MM/DD/YYName: John DoeLocation: 4th Street and University AvenueSpeed Limit: 30 mphPassengermph forSecondsVehicles176 7.56llll l3.435.29llll llll3.633.38llll lll3.831.58llll lll4.030.06llll l4.228.910llll llll4.427.29lllll llll4.626.17llll ll4.825.07llll art Time: 1500End Time: 1545Down Time: N.A.Weather: 223lllllll221211311169101091311987123100Figure 2.3. Example Stopwatch Spot Speed Study Data FormSpot Speed2.9
Table 2.4. Example Stopwatch Spot Speed Study Distribution 335.237.54042.8Frequency e50th85thA 5-mph rule of thumb is sometimes used to determine whether the 85th percentile of speed istoo high compared to the posted speed limit. If the 85th percentile of speed is 5 mph or moreabove the posted
pavement crack at the beginning of the predetermined study length, the observer starts the stopwatch. The watch is stopped when the vehicle’s front wheels pass a reference line in front of the observer. A slash is recorded on the data form corresponding to the elapsed time observed. Calculate Vehicle Speeds To calculate vehicle speed, use the predetermined study length and the elapsed time .