Transcription
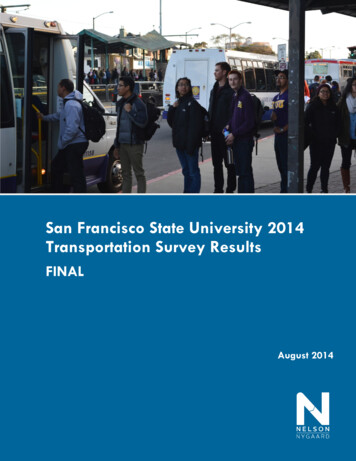
San Francisco State University 2014Transportation Survey ResultsFINALAugust 2014
2014 Transportation Survey Results FINALSan Francisco State UniversityTable of ContentsPage12345Executive Summary .1-1Introduction.2-1Online Survey .3-3Introduction. 3-3Survey Design . 3-3Methodology . 3-4Results . 3-8Cordon Count.4-1Introduction. 4-1Methodology . 4-1Results . 4-3Carbon Emissions .5-1Introduction. 5-1Methodology . 5-1Results . 5-4Appendix A: Survey InstrumentsCordon Count Survey Form . iOnline Survey . iiNelson\Nygaard Consulting Associates Inc. i
2014 Transportation Survey Results FINALSan Francisco State UniversityTable of FiguresPageFigure 3-1: Adjusted Faculty/Staff and Student Responses . 3-4Figure 3-2: Population Scale . 3-5Figure 3-3: Mode of Arrival to Campus. 3-8Figure 3-4: Number of Legs in Journey to Campus . 3-9Figure 3-5: All Modes Used to Get to Campus . 3-9Figure 3-6: Cost of Commute. 3-10Figure 3-7: Peak Hour and Total Auto Trips (N Total Campus Population) . 3-10Figure 3-8: Mode Split by Affiliation . 3-11Figure 3-9: Daily Muni trips by Muni route (N Total Campus Population) . 3-12Figure 3-10: Peak Hour Muni Trips for the SF State Peak Period (N Total CampusPopulation) . 3-13Figure 3-11: Peak Hour Muni Trips for the Muni System Wide Peak Period of 5:00 PM to 6:00PM . 3-13(N Total Campus Population) . 3-13Figure 3-12: Peak Hour, Peak Direction Riders for M line (N Total Campus Population) . 3-14Figure 3-13: Peak Hour, Peak Direction Riders for Bus Route 28/28L (N Total CampusPopulation) . 3-14Figure 3-14: Home County of BART Riders (n 726) . 3-14Figure 3-15: Parking On and Near Campus. 3-16Figure 3-16: Parking Costs . 3-17Figure 3-17: Programs to Encourage Drivers to Use Alternative Modes. 3-18Figure 3-18: Willingness to Purchase a Universal Transit Pass. 3-18Figure 3-19: Affiliation with San Francisco State University . 3-19Figure 3-20: Place of Residence . 3-19Figure 3-21: Campus Affiliates by Zip code. 3-21Figure 3-22: Location of SF State University Affiliates . 3-1Figure 4-1: Cordon Count Locations . 4-2Figure 4-2: Number of Vehicles Entering and Exiting by Location . 4-3Figure 4-3: Count of Vehicles Entering and Exiting by Location and Time . 4-4Figure 4-4: Count of Persons Entering and Exiting by Mode and by Hour. 4-5Figure 5-1: Total Passenger Miles Travelled per Day by Mode . 5-4Figure 5-2: Total Pounds of CO2 per Day by Mode . 5-5Figure 5-3: Pounds of CO 2 Emissions per Passenger Mile . 5-6Figure 5-4: Total Miles Travelled and CO 2 Emissions per Day 2014 . 5-6Figure 5-5: Passenger-miles travelled, pounds CO 2 per mile, and total CO 2 per year bymode . 5-8Nelson\Nygaard Consulting Associates Inc. i
2014 Transportation Survey Results FINALSan Francisco State University1 EXECUTIVE SUMMARYIn October 2007, the City and County of San Francisco and San Francisco State Universityentered into a Memorandum of Understanding (MOU). The purpose of the MOU is to address theimpact on the City and County of San Francisco from the implementation of the University’scampus master plan and anticipated increase in enrollment on the campus. The MOU identifies anumber of measures that the University must take, including the establishment of a trafficmonitoring and mitigation program.In response to the requirements of the MOU, San Francisco State University has conducted anonline transportation survey and cordon count every three years beginning in April, 2008 withsubsequent surveys taking place in April 2011 and April 2014. Survey data is used to track anumber of key factors such as mode split, peak hour vehicle trips, peak hour Muni ridership, andGHG emissions.Key FindingsKey findings from the 2014 transportation survey include the following: Since 2008 the drive-alone rate for commute trips to the University has decreased by 32%with 26% of campus affiliates driving alone to campus in 2008 compared to 19.7% in2014. The percentage of campus affiliates who arrive on campus on foot has increased by 27.6%between 2008 and 2014. Transit usage has increased with 46.8% of campus affiliates using Muni for some portionof their trip to campus and 26.4% using BART. This is an increase of 22.4% and 19.3%,respectively, since 2008. Between 2008 and 2014 the number of peak hour vehicle trips has decreased by 10.6%. Peak hour ridership on the Muni M Line and bus routes 28/28L has decreased slightlybetween 2008 and 2014. An increase in the daily student population and miles travelled has resulted in a 15%increase in GHG emissions from 2008 to 2014, compared with 30% increase in milestravelled over the same time period. The inverse relationship between GHG emissionsand miles travelled is due to more miles being travelled on public transportation ratherthan in private vehicles. Private vehicles have the highest levels of CO 2 emissions per passenger mile. More thanhalf of all daily passenger miles are travelled on BART, but only 11% of the total dailypounds of CO2 emissions are generated by BART. Less than half of the total daily passenger miles are in private vehicles, however personsdriving alone are the largest contributors to San Francisco State University’s CO 2commute travel emissions, representing 77% of the total daily pounds of CO2 emissions.Nelson\Nygaard Consulting Associates Inc. 1-1
2014 Transportation Survey Results FINALSan Francisco State University2 INTRODUCTIONIn October 2007, the City and County of San Francisco and San Francisco State Universityentered into a Memorandum of Understanding (MOU). The purpose of the MOU is to address theimpact on the City and County of San Francisco from the implementation of the University’scampus master plan and anticipated increase in enrollment on the campus.The MOU identifies a number of measures that the University must take, including theestablishment of a traffic monitoring and mitigation program. The MOU states that the purposeof the traffic monitoring and mitigation program is to monitor and determine whether theUniversity’s expanded Transportation Demand Management (requirement 1 in Section B of theMOU) is successfully minimizing or avoiding new peak hour trips. As part of the trafficmonitoring and mitigation program the MOU states that the University must conduct a newbaseline cordon count and intercept survey no less than 12 months following the certification ofthe master plan EIR. Furthermore, additional cordon counts must be conducted at intervals of nomore than every three years or no later than the enrollment of each 1,000 new headcountstudents to the University.In fulfillment of the requirements stated in the MOU, San Francisco State University conductedthe baseline cordon count and intercept survey on the main campus at 1600 Holloway Avenue onWednesday, April 30, 2008. A Wednesday was selected in order to ensure that the cordon countand intercept survey would be representative of a typical day on campus, when classes are insession and most affiliates are on campus. The cordon count covered 15 vehicle, pedestrian, andbicycle entry points to campus and intercept surveys were conducted at seven entrances tocampus. In total, 1400 intercept surveys were completed. A subsequent cordon count wasconducted on Wednesday, April 27, 2011. The second cordon count covered 16 vehicle,pedestrian, and bicycle entry points to campus. In 2014, the cordon count methodology wasrevised significantly to focus on vehicle entry points to campus. The third cordon count wasconducted on Wednesday, April 23, 2014 at nine locations.In addition to the cordon count, the University also conducted an online survey in 2008, 2011 andin 2014, which was sent to all University affiliates. An online survey was not identified in theoriginal MOU; however the creation of an online survey was a result of discussions between theUniversity and the San Francisco Municipal Transportation Agency regarding methodology andthe best way to capture the data required as part of the MOU. For the 2014 survey, Universityaffiliates were asked questions similar to those asked in the 2011 online survey regarding theirjourney to campus on Wednesday, April 23, 2014. The purpose of the online survey is to providemore detailed information on travel behavior than can be collected during an intercept survey orcordon count. In total, 3,959 University affiliates completed the online survey. It should be notedthat an intercept survey was not conducted in 2011 or 2014, as the MOU only stipulates that abaseline intercept survey should be conducted and information collected in the online survey iscomparable to information that would be gathered by an intercept survey.Nelson\Nygaard Consulting Associates Inc. 2-1
2014 Transportation Survey Results FINALSan Francisco State UniversityThis report provides in-depth analysis of the three surveys with a discussion of methodology,survey design and accompanying results, comparing 2014 survey results to 2011 and 2008 surveyresults. The report concludes with a carbon footprint analysis for commute trips, using the datagathered in the online survey.Nelson\Nygaard Consulting Associates Inc. 2-2
2014 Transportation Survey Results FINALSan Francisco State University3 ONLINE SURVEYINTRODUCTIONIn April 2014, San Francisco State University conducted an online survey that asked Universityaffiliates how they travelled to and from campus on Wednesday, April 23rd. A total of 3,959University affiliates responded to the survey, and out of the 3,959 total respondents, 3,077persons stated that they were on campus on Wednesday, April 23rd. In 2011 a total of 3,599University affiliates responded to the survey, and out of the 3,599 total respondents,approximately 2,764 persons stated that they were on campus on Wednesday, April 27th.In 2008 a total of 4,386 University affiliates responded to the survey, and approximately 3,300persons stated they were on campus on Wednesday, April 30th. Only those persons who statedthey were on campus are included in this analysis unless otherwise noted.SURVEY DESIGNThe online survey was designed to gain an in depth understanding of how University affiliatescommute to and from campus. Respondents were asked to provide travel information on up tofour legs of their journey to and from campus. For example, someone who drove to BART andthen took the San Francisco State University shuttle from the Daly City BART station to campuswould enter trip information for three legs. Similarly, if a respondent transferred from one Muniroute to another Muni route, they would enter trip information for two legs.Each leg of the journey is treated as a separate question, and respondents are asked to identify themode they took in each leg, providing the distance they travelled on that mode. If respondentstook Muni, they were asked to select the Muni route they took, and if a respondent selected BARTor Caltrain, they were asked to identify their start and end stations.Respondents who stated that they drove or carpooled to campus were asked a series of questionsrelated to parking, including their parking location and how much they paid for parking. Allrespondents were asked to answer a number of background questions, such as their place ofresidence and affiliation with the University.A copy of the online survey instrument is provided in the Appendix A for reference.Constraints and LimitationsTwo questions that were previously asked in 2011 and 2008 were mistakenly deleted from theonline survey during the survey design process. These questions asked respondents when theyarrived and departed campus. This data is used to determine the peak period of travel for Muniriders as well as drivers. This information is tracked in order for San Francisco State University tomonitor vehicle trips and Muni M-line and bus route 28/28L ridership as required by their MOUwith the City and County of San Francisco. Given that this data is missing an alternativeNelson\Nygaard Consulting Associates Inc. 3-3
2014 Transportation Survey Results FINALSan Francisco State Universitymethodology was developed to calculate peak hour vehicle trips and Muni M-line and bus route28/28L ridership. The revised methodology is described in further detail in the following section.METHODOLOGYPrior to conducting data analysis for the online survey, data cleanup and restructuring as well asthe establishment of location-based weights were necessary. This section provides a discussion ofthese processes and describes how the results were scaled up to the campus population.WeightsBased on the distribution of online surveys between students and faculty/staff, a weight wascreated and applied to all online survey analysis. On an average day 23,372 students and 2,608faculty and staff members are on campus (Figure 3-1 and Figure 3-2). However, the student tofaculty/staff ratio of the online survey sample was not equivalent to the population, so it wasnecessary to weight the number of student and faculty/staff responses. It should be noted thisweight is for those online survey respondents who stated they were on campus on April 23, 2014.Respondents who stated they were not on campus on April 23rd were not included in this analysis.In order to appropriately weight the online survey responses by affiliation, an overall weight wasestablished using the ratio of the total campus population (33,148) to the total number of onlinesurvey responses who stated they were on campus (3,077) 1. The adjusted weight for students andfaculty/staff was then determined by dividing the ratio of population to the sample for studentsand faculty/staff by the overall weight. The weighted number of cases is equal to the number ofonline survey responses multiplied by the adjusted weight.Figure 3-1: Adjusted Faculty/Staff and Student ResponsesTotal PopulationOnline ResponsesWeightedResponseAdjusted ,2436730.4473301Total33,1483,0773,077Scaling to the Campus PopulationIn order to scale the online survey data to represent the San Francisco State University populationas a whole, it was necessary to determine how many faculty, staff and students are on campus onan average day. The total campus population was obtained from University Facts brochure andthe online survey was used to determine the percentage breakdown by affiliation of those personswho are on campus. From this an adjustment factor was established.When calculating the weighting factor, those respondents who said they were on campus but who stated an affiliationof “Visitor/Contractor” or “Other” were not included.1Nelson\Nygaard Consulting Associates Inc. 3-4
2014 Transportation Survey Results FINALSan Francisco State UniversityFigure 3-2: Population ScaleAffiliationTotal Population 2AdjustmentFactorDaily Population 0%2,608Total33,14825,979The total population was then multiplied by the adjustment factor to determine the dailypopulation for students and faculty/staff. The daily population is used to scale the survey resultsto represent the actual San Francisco State University population.Data Clean-up and Data RestructuringA number of steps were taken to clean and restructure the online survey responses in order toproperly format them for analysis.As described in the survey design section, the format of the online survey made it possible forrespondents to put multiple legs of their trip in one field. In addition, a number of surveyrespondents did not input the legs of their trip to campus in a logical or feasible way. Listed beloware the measures taken to clean-up the data.1.A total of 145 respondents stated that they arrived at campus via Caltrain or BART. Sincethis is not physically possible, the last leg of their journey was adjusted. For respondentswith a last leg mode of Caltrain, their record was adjusted to reflect Muni M-line.2. For respondents stating that they arrived on campus via BART, their record was adjustedto reflect SF State Shuttle or Muni Route 28 as their last mode 3.Mode SplitIn order to determine the mode split for University affiliates commuting to and from campus itwas necessary to create several new variables. The newly created variables are as follows:1.Primary Mode To (Arrival Mode) – The “primary mode to” is the mode by whichrespondents arrived at campus. For the trip to campus, the last leg of the trip wasdetermined to be the primary mode, as respondents could have between one and four legsto their trip.2. Secondary Mode To – The “secondary mode to” is the mode respondents used beforetheir primary mode to campus. This trip may have occurred on leg 1, 2, or 3 of their trip,depending on the total number of legs. Respondents who used only one mode oftransportation to arrive on campus have no recorded secondary mode.Source: Faculty and staff population numbers courtesy of University Facts brochure athttp://www.sfsu.edu/ puboff/sfsufact/archive/1314/students.htm andhttp://www.sfsu.edu/ puboff/sfsufact/archive/1314/facstaff.htm3 Respondents who stated they arrived by BART were assigned to Muni Route 28 or the SF State Shuttle based on thepercentage breakdown of those respondents who said they took BART and selected a mode of arrival of either MuniRoute 28 or the SF Shuttle.2Nelson\Nygaard Consulting Associates Inc. 3-5
2014 Transportation Survey Results FINALSan Francisco State University3. Primary Mode From (Departure Mode) – The “primary mode from” is the mode by whichrespondents left campus.In addition to creating new variables, the existing data needed to be restructured in order to meetthe requirements of the MOU between the University and the City and County of San Francisco.The MOU requires that all persons who park and walk within 10 minutes of campus should beclassified as drivers rather than walkers when determining the mode split and peak hour autotrips. The following steps were taken to address this requirement:1.Persons with a primary mode to campus of walking and a secondary mode to campus ofdriving or carpooling were identified using the primary mode to campus variable and thesecondary mode to campus variable.2. A primary mode distance variable was then calculated using the responses given in thesurvey to the question “Please estimate the distance you travelled in this segment of yourtrip”. Persons whose walk segment was 0.5 mile or less were classified with an autoprimary mode. Half a mile was used because the average speed of walkers is 3 miles anhour, meaning a 10 minute walk is equivalent to approximately 0.5 miles.3. For persons who did not provide a distance, the location where they parked their car wasused. Respondents who drove or carpooled and parked on or near campus were asked toselect the zone which corresponded to their parking location on a map of the areasurrounding campus. The map covers the area bounded by I-280, Lake MercedBoulevard, Sloat Boulevard, Santa Clara Avenue, Victoria Street, and Head Street.Respondents were given 19 zones to choose from. Using a 0.5 mile radius, the zoneswhich are within a 10 minute walk to campus were identified. Zones where part but notthe entire zone is within a 10 minute walk are considered to be within the 0.5 radius. Ofthe 19 zones, only three are not within the 0.5 mile radius.4. The same steps were then repeated for the trips from campus.A similar methodology was applied to persons whose primary mode is walk and their secondarymode is Muni in order to more accurately determine the peak hour number of Muni trips asrequired by the MOU. The following steps were taken to address this requirement:1.Using the primary mode distance variable, persons whose walk segment was 0.5 miles orless were reclassified with a Muni primary mode. For persons who did not provide aprimary mode distance, the “Muni route taken” was used. Persons travelling on routesdirectly serving campus (17, 18, 28, 28L, 29, 88, M) were reclassified with a Muni primarymode. Persons travelling on any other Muni routes retained walk as their primary mode.2. The same steps were then repeated for the trips from campusVehicles Trips during the Peak HourPer the MOU, San Francisco State University is required to establish a baseline of PM peak hourvehicle trips. As noted in the constraints and limitations section, questions asking respondents atwhat time they arrived and departed from campus were mistakenly deleted. Given this, datacollected as part of the vehicle cordon count was used to establish the peak hour for vehicle tripsand to determine what percent of vehicle trips occur during the peak hour.The following steps were taken to determine the number of vehicle trips during the peak hour:1.Using the cordon count data, a PM vehicle peak hour of 3:00 PM to 4:00 PM wasestablished with 10% of vehicle trips occurring during this time period. This is earlierNelson\Nygaard Consulting Associates Inc. 3-6
2014 Transportation Survey Results FINALSan Francisco State Universitythan the 2011 peak hour of 5:00 PM to 6:00 PM and the 2008 vehicle peak hour whichoccurred between 4:00 PM to 5:00 PM.2. The primary mode to and primary mode from campus were used to determine the totalnumber of trips for drive alone, carpool, and drop off and pick up trips.3. The number of carpool trips was reduced by a factor of 2.42 for trips to campus and 2.60for trips from campus, which is the average number of people in a carpool for trips to andfrom San Francisco State University. The average number of persons in a carpool wasdetermined using responses to the question “how many people were in your carpool”.It should be noted that while the methodology for establishing the PM peak hour for vehicle tripschanged, the percentage of trips occurring during the peak hour is approximately the same (10%)as in previous survey years.Muni Trips during the Peak HourPer the MOU, San Francisco State University is required to establish a baseline of peak hour Munitrips for both the campus Muni peak hour as well as the Muni system wide peak hour (5:00 PM to6:00 PM). As noted in the constraints and limitations section, two questions were mistakenlydeleted from the 2014 online survey. These questions asked respondents at what time theyarrived and departed from campus. Given this, the campus Muni peak hour of 9:00 AM to 10:00AM from the 2011 survey was utilized for this analysis.The following steps were taken to determine the number of Muni trips during both the campuspeak hour and Muni system wide peak hour:1.Using the mode split by time analysis from the 2011 online transportation survey, acampus Muni peak hour of 9 AM to 10 AM was established. This is an hour later than the2008 campus Muni peak hour, which occurred between 8 AM and 9 AM.2. Using the mode split by time analysis from the 2011 online survey, the percentage ofMuni trips occurring during the campus Muni peak hour was established.3. The primary mode to and primary mode from campus were used to determine the totalnumber of Muni trips.4. In order to determine the distribution of Muni trips over the six routes directly servingcampus (as required in the MOU), two new variables were created that identified whichMuni route was taken for the “primary mode to” campus and for the “primary modefrom” campus. The frequency of the new Muni route variables provided the number oftrips taken on each Muni route. This distribution was then applied to the total populationnumber of Muni trips.Areas for Additional ConsiderationCurrently, there are a number of respondents who use the San Francisco State Shuttle in theirjourney to campus but it is not classified as their mode of arrival on campus, or “primary mode”.However, it is highly unlikely that someone who took the San Francisco State Shuttle on theirjourney to campus would not arrive on campus via the San Francisco State Shuttle. Thus, it isrecommended for the next survey period that this issue is addressed during the data clean up andrestructuring process so that the share of campus affiliates arriving on campus via the SanFrancisco State Shuttle is more accurately reflected.Nelson\Nygaard Consulting Associates Inc. 3-7
2014 Transportation Survey Results FINALSan Francisco State UniversityRESULTSThe following section discusses the results of the online survey, focusing on mode split, Muniridership on the lines that directly serve the campus, parking, and demographics. At the end ofthe chapter, results for a number of demographic questions that were asked of all respondents-regardless of whether or not they were on campus that day, are presented. Unless otherwisenoted, results shown in this section are for only those respondents who stated that they were oncampus on April 23, 2014.CommuteFigure 3-3 below shows the mode people used to arrive at campus. Muni was the most commonmode used, at approximately 30%. Driving was the second most common mode at 20%, which isa six percentage point decrease from 2008. Between 2008 and 2011, ridership on the SF Stateshuttle rose slightly and then returned to 2008 levels in 2014. The percentage of respondentsarriving on foot has continued to increase while the number of
San Francisco State University 3 ONLINE SURVEY INTRODUCTION In April 2014, San Francisco State University conducted an online survey that asked University affiliates how they travelled to and from campus on Wednesday, April 23rd. A total of 3,959 University affiliates responded to the survey, and out of the 3, 959 total respondents, 3,077