Transcription
K AISER FAMILY FOUNDATIONSurvey of Healthy San Francisco ParticipantsAUG U S T 2 0 0 9
TABLE OF CONTENTSExecutive Summary .1Introduction . 3Key Findings . 5Discussion and Conclusions 25Appendix 1: Survey Methodology . 27Appendix 2: Comparison of Healthy San Francisco enrollees to local and national estimates .28Appendix 3: Survey Topline Results .29
Survey of Healthy San Francisco ParticipantsExecutive SummaryEXECUTIVE SUMMARYHealthy San Francisco, created by City Ordinance in July 2006, is San Francisco’s health access program forthe uninsured, the first of its kind in the nation. Healthy San Francisco is not insurance, but provides uninsuredSan Francisco residents access to affordable basic and ongoing health care services, including primary carethrough a medical home, as well as specialty and inpatient care, diagnostic and mental health services, andprescription drugs. All uninsured adult City residents who are not eligible for other public programs are eligibleto enroll in Healthy San Francisco, regardless of immigration status, employment status, or pre-existing medicalconditions.As of October 31, 2008, more than 32,000 uninsured residents were enrolled in the program. The vast majorityof these enrollees (73 percent) had incomes below the federal poverty line (about 10,000 for an individual orabout 21,000 for a family of four in 2008). In March 2009, Kaiser Family Foundation researchers conducted anindependent survey to gauge the early opinions and experiences of this first wave of participants. The survey isbased on a random sample of those enrolled as of October 31, 2008, and still enrolled as of March 1, 2009, inorder to include those who had been in the program for at least four months.Key findings from the survey include:oHealthy San Francisco participants represent a population with substantial health care needs.Compared to the general population, they are sicker and older, and report somewhat greater utilizationof health care services.oParticipants in Healthy San Francisco report high levels of satisfaction and voice a resoundingendorsement for the program. Ninety-four percent say they are satisfied with the program overall, andnine in ten say they would recommend the program to a friend.oMost participants say they understand how Healthy San Francisco works overall, but awareness andeducation challenges remain, particularly for certain groups of enrollees, including those in fair or poorhealth and those with lower levels of education.oParticipants give positive reviews to the Healthy San Francisco enrollment process and writtenmaterials, but non-English speakers report slightly more challenges.oA large majority of participants (86 percent) report having a usual source of care. Most understand thatthey have a medical home, and most have had an initial visit since joining the program.oNearly all participants say their health needs are being well met today, and four in ten reportimprovements in meeting their health needs since joining Healthy San Francisco. Many report easieraccess to care under Healthy San Francisco, though small but important shares report some aspects ofaccessing care are more difficult now than before they joined the program, and nearly three in ten (29percent) say at least one thing is harder now than before.oMost participants say they feel well-protected when it comes to their health care needs, and more thanfour in ten say they are paying less for care now than before they joined Healthy San Francisco.oProgram participants who report being in fair or poor physical or mental health stand out as reportingparticular challenges. Compared with those in better health, they are more likely to report havingtrouble understanding the program and what costs they are responsible for, more likely to report adeterioration in how well their health needs are being met now compared to before they joined theprogram, more likely to say at least one aspect of accessing care is more difficult than before theyjoined, and more likely to worry about their health needs not being paid for.oParticipants overwhelmingly say the reason they decided to enroll in Healthy San Francisco is becausethey could not afford health insurance or health care services.1
Survey of Healthy San Francisco Participants2Executive SummaryoSmall but notable shares of participants report problems with delaying or skipping care. Overall, about aquarter of participants say that since joining Healthy San Francisco, they have either delayed or notgotten medical care or medication, or had problems getting recommended follow-up care; 13 percentsay that one of these things happened due to cost or lack of insurance.oCompared to previous estimates for the uninsured in San Francisco before the program was created,Healthy San Francisco participants are more likely to report having a usual source of care and morelikely to report accessing health care services.oParticipants recommend some ways they think the program could be improved, most notablystreamlining the appointment process and providing additional services, such as dental and vision care.
Survey of Healthy San Francisco ParticipantsIntroductionINTRODUCTIONAbout Healthy San FranciscoIn July 2006, the San Francisco Board of Supervisors passed the Health Care Security Ordinance, whichcreated the Healthy San Francisco program and made San Francisco the first city in the nation to provideaccess to health care services for all adult residents without health insurance. Healthy San Francisco, aprogram of the San Francisco Department of Public Health (DPH), is not a health insurance program, but itprovides uninsured residents access to affordable basic and ongoing health care services, regardless ofimmigration status, employment status, or pre-existing medical conditions. The San Francisco DPH estimates1that 60,000 adults living in the City are uninsured, representing 11 percent of the non-elderly population.All San Francisco residents, ages 18-64, who have been uninsured for at least 90 days and who are ineligiblefor other public programs, are eligible for Healthy San Francisco. A key feature of Healthy San Francisco is theuse of medical homes, designed to improve the quality and continuity of care. Upon enrollment, participantschoose a medical home from among participating clinics. Medical homes initially included 14 clinics operated byDPH and 13 operated by the San Francisco Community Clinic Consortium (SFCCC); two new independentlyoperated medical homes were added in September 2008. In addition to primary care through their medicalhome, participants are provided with access to specialty and inpatient care, diagnostic services, mental healthservices, and prescription drugs. Because the program provides universal access, not coverage, these servicesmay only be obtained from the participating clinics and selected hospitals.2 Any care received outside the Cityof San Francisco is not covered by the program.Healthy San Francisco enrollees with incomes below the federal poverty level (FPL) pay nothing to participate inthe program. Enrollees whose family income is above the poverty line are required to pay a quarterly participantfee on a sliding scale. These fees are designed not to exceed 5 percent of family income for those below 500percent FPL. In addition to the quarterly fee, those with incomes above 100 percent FPL are required to paypoint-of-service fees for clinic and hospital services, including 10 per primary care visit, 20 per specialty visit, 5 for formulary preferred drugs, 25 for formulary non-preferred drugs, and 200 per hospital admission.Enrollment in Healthy San Francisco began in July 2007 and was initially launched at two health centers; it wasexpanded in September 2007 to include all 27 clinics. Initial enrollment was limited to individuals with familyincomes below the poverty line. In January 2008, individuals with incomes up to 300 percent FPL becameeligible to apply. As of October 31, 2008, more than 32,000 San Francisco residents were enrolled in theprogram. The vast majority (79 percent) of these participants indicated at the time they enrolled that they had amedical visit at their selected medical home within the previous 2 years, indicating that most participants hadpreviously used the City’s safety-net program, which was in place before Healthy San Francisco was created,and allowed uninsured residents to pay for health care services received from City clinics on a sliding scale.More details about Healthy San Francisco, including information about employer requirements and programfinancing, are available in a Kaiser Family Foundation fact sheet (http://www.kff.org/uninsured/7760a.cfm) orfrom the San Francisco DPH at http://www.healthysanfrancisco.org/.About the surveyResearchers at the Kaiser Family Foundation designed the Survey of Healthy San Francisco Participants togauge the early experiences and opinions of the first wave of enrollees in Healthy San Francisco. The surveywas conducted with input from and the full cooperation of the San Francisco Department of Public Health;however, final survey design decisions and all reporting and analysis were performed independently by KaiserFamily Foundation researchers.1Estimate from 2007 California Health Interview Survey, Los Angeles, CA: UCLA Center for Health Policy Research, 2008.Initially, hospital care was provided only through San Francisco General Hospital. In September 2008, four additional hospitals wereadded, bringing the total number of hospitals in the City at which participants can receive services to five.23
Survey of Healthy San Francisco ParticipantsIntroductionThe survey is based on a representative random sample of 1,026 participants who were enrolled in Healthy SanFrancisco as of October 31, 2008 and still enrolled as of March 1, 2009, in order to include those who were inthe program for at least four months. The survey has a margin of sampling error of plus or minus 3 percentagepoints. Interviews were conducted in English, Spanish, and Cantonese, and efforts were made to ensure thatthe demographics of those interviewed closely matched those of the total Healthy San Francisco participantpopulation. A few highlights of the sample demographics are shown below in Table 1; for more details, seeAppendix 1: Survey Methodology.Table 1: Sample demographics compared to overall Healthy San Francisco enrollment as of October 31, 2008SurveyAll HealthyinterviewsSan FranciscoIncomeBelow 100% FPL72%73%100% FPL and above2827Primary spoken Prior visit at medical home in past 2 yearsYes7679No24214
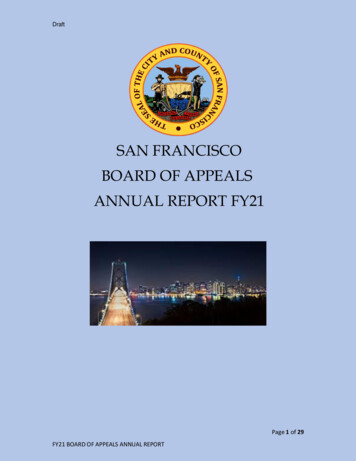
Survey of Healthy San Francisco ParticipantsKey FindingsKEY FINDINGSHealthy San Francisco participants represent a population with substantial health care needs.Compared to the general population, they are sicker and older, and report somewhat greater utilizationof health care services.Nearly three in ten Healthy San Francisco participants (28 percent) report being in fair or poor health, and nearlyone in five (18 percent) report being in fair or poor mental health. More than half (55 percent) say they have atleast one chronic condition, including being told by a doctor that they have high blood pressure (33 percent),diabetes (11 percent), asthma (9 percent), heart disease (5 percent), cancer (3 percent), or any other chroniccondition (17 percent).CHART 1Participants’ reported health statusWould you say that in general your health isexcellent, very good, good, fair or poor?Would you say that in general your MENTALhealth is excellent, very good, good, fair orpoor?26%26%27%Very goodGoodVery %3%PoorPoorSource: Kaiser Family Foundation Survey of Healthy San Francisco Participants (conducted March 1-30, 2009)While it is difficult to make direct comparisons at the same point in time due to data availability for other groups,when comparing to the best and most recent available data, Healthy San Francisco participants appear to be inpoorer reported health than the general population. The share reporting fair or poor health is significantly higheramong program participants (28 percent) than among all San Francisco residents (12 percent) and among allU.S. residents (11 percent) in the same age range in 2007. Healthy San Francisco participants are also asignificantly older population than the non-elderly population of both San Francisco and the U.S. (44 percent areages 50-64, compared with 24 percent of all non-elderly SF residents, and 29 percent of the non-elderly in thecountry as a whole).Table 2: Health status and age of Healthy San Francisco enrollees compared with local and national estimatesSan Francisco residentsAll U.S. residentsHealthyages 18-64ages 18-64San Francisco200920072007/2008Self-reported health statusExcellent/very %*11*2234441858*24*27*44*29** indicates statistically significant difference from Healthy San Francisco (p .05). See Appendix 2 for full estimates and confidence intervals.Sources for comparison: Estimates for San Francisco residents from California Health Interview Survey; U.S. estimates for health statusfrom 2007 National Health Interview Survey; U.S. estimates for age from U.S. Census Bureau 2008.5
Survey of Healthy San Francisco ParticipantsKey FindingsNine in ten Healthy San Francisco participants report having seen a medical doctor at least once in the pastyear, including more than half (56 percent) who say they’ve had 3 or more doctor visits. One in nine (11percent) also say they’ve had at least one overnight hospital stay, and nearly three in ten (29 percent) reportvisiting an emergency room in the past year. Again, while it is difficult to make direct comparisons, using themost recent available data, Healthy San Francisco participants report significantly greater numbers of doctorvisits than the general population, both in San Francisco and nationally, perhaps a reflection of their greaterhealth needs.Table 3: Self-reported health care utilization in the past year3San Francisco residentsHealthyages 18-64San Francisco20092007Doctor visits in past yearNone1-23 or more visitsE.R. visits in past yearNoneAnyOvernight hospital stays in past yearNoneAnyAll U.S. residentsages *8911N/AN/AN/AN/A* indicates statistically significant difference from Healthy San Francisco (p .05). See Appendix 2 for full estimates and confidence intervals.Sources for comparison: Estimates for San Francisco residents from California Health Interview Survey; U.S. estimates from National HealthInterview Survey3Note: Results for Healthy San Francisco participants were not significantly different when looking only at those who have been enrolled forat least one year.6
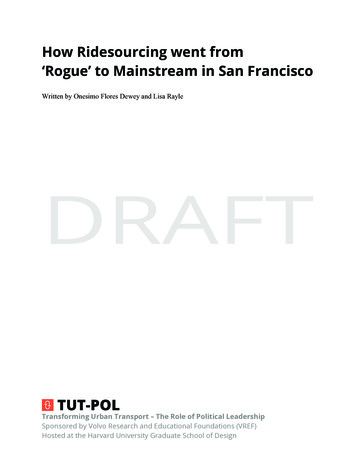
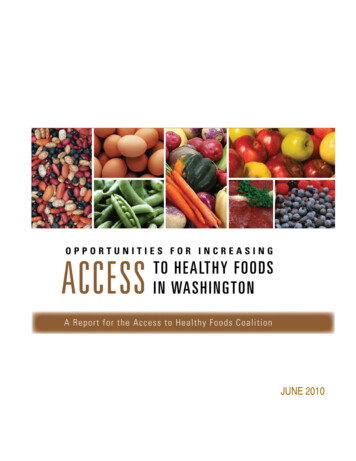
Survey of Healthy San Francisco ParticipantsKey FindingsParticipants in Healthy San Francisco report high levels of satisfaction and voice a resoundingendorsement for the program.Nearly all Healthy San Francisco enrollees (94 percent) say they are at least somewhat satisfied with theprogram overall, including more than six in ten (63 percent) who say they are very satisfied. Satisfaction is highacross various groups of enrollees, and is equally high among those whose medical home is part of the SanFrancisco Department of Public Health (DPH), and those who visit non-DPH clinics. Satisfaction is also equallyhigh among those who have been participating in Healthy San Francisco for one year or longer and those whoare newer to the program.CHART 2High satisfaction and resounding endorsement of HSFOverall, are you very satisfied,somewhat satisfied, not toosatisfied, not at all satisfiedwith the Healthy San Franciscoprogram?63%VerysatisfiedWould you recommend joiningHealthy San Francisco to afriend, or not?Do you think other cities shouldcreate programs like HealthySan Francisco, or not?92%92%YesYes31%Somewhatsatisfied5%No1%Don't 1%3% Not tooknowsatisfiedNot at allsatisfied2%Don't know6%Don'tknow2%NoSource: Kaiser Family Foundation Survey of Healthy San Francisco Participants (conducted March 1-30, 2009)More than nine in ten participants (92 percent) say they would recommend Healthy San Francisco to a friend,and an equal share say that other cities should create similar programs. Ninety-two percent also say they planto continue with the program next year.Levels of satisfaction are high across various aspects of the program. About two-thirds say they are verysatisfied with communication between themselves and their doctor (66 percent), their overall costs (65 percent),and the quality of care they receive (64 percent). More than half of those who have used specific services alsosay they’re very satisfied with their ability to get the treatments and prescription drugs they need (62 percent),their ability to get routine doctor appointments (56 percent), getting answers to their administrative questions (55percent), their ability to see the doctor they want (54 percent), and their ability to get appointments withspecialists (51 percent). Fewer than one in ten report being dissatisfied with any of these aspects, except whenit comes to appointments; 14 percent overall (15 percent of those who have needed an appointment) say theyare “not too” or “not at all” satisfied with their ability to get appointments for check-ups and minor illnesses, and12 percent overall (16 percent of those who have needed to see a specialist) say they are not satisfied with theirability to get specialty appointments.7
Survey of Healthy San Francisco ParticipantsKey FindingsCHART 3Satisfaction strong on most program specificsWould you say that you are very satisfied, somewhat satisfied, not too satisfied, or not at allsatisfied with each of the following elements of Healthy San Francisco?VerysatisfiedSomewhatsatisfiedNot too/not atall satisfiedCommunication betweenyou and your doctor66%22%7%Overall cost to you65%23%6%Quality of care64%Your ability to get thetreatments/drugs you need4%27%62%8%27%Your ability to getdoctor appts56%28%15%Getting answers toadministrative questions55%34%7%Your ability to see thedoctor you want54%Your ability to get apptswith specialists30%51%29%10%16%Note: Based on those for whom the question applies; “Don’t know” responses not shownSource: Kaiser Family Foundation Survey of Healthy San Francisco Participants (conducted March 1-30, 2009)Most participants say they understand how Healthy San Francisco works overall, but awareness andeducation challenges remain, particularly for certain groups of enrollees.Most people who participate in the program say that in general, they understand how Healthy San Franciscoworks at least somewhat well (85 percent), though just about a third (35 percent) say they understand it “very”well. Fourteen percent of all participants say they do not have a good understanding of how Healthy SanFrancisco works, a response that is more common among those in fair or poor health (22 percent), those in fairor poor mental health (22 percent) and those with lower levels of education (21 percent of those with no high4school diploma).CHART 4Reported problems understanding Healthy SF by subgroupPercent who say they understand how Healthy San Francisco works “not too well” or“not at all well”:Healthy SF Average 14%By Health Status22%*Fair/poor healthExcellent/good health11%By Mental Health Status22%*Fair/poor mental healthExcellent/good mental health12%By Education Level21%*Less than High School diplomaHigh School diplomaHigher than High School diploma13%10%* indicates statistically significant difference from comparison group (p .05); by education, significant difference between HS and both other groups.Source: Kaiser Family Foundation Survey of Healthy San Francisco Participants (conducted March 1-30, 2009)4It should be noted that those with lower levels of education are more likely to be Cantonese speakers than those with higher educationlevels. Although every effort was made to ensure that questionnaires were translated in a way that retained the original meaning of thequestion, there is a possibility that at least part of the difference between these groups could be attributable to survey translation issues. Itcould also reflect real differences in problems understanding the program for those whose first language is not English.8
Survey of Healthy San Francisco ParticipantsKey FindingsWhen it comes to specific aspects of the program, somewhat fewer overall report having a good understandingof their own costs. About two-thirds (65 percent) say they understand what costs they are responsible for in theHealthy San Francisco program, but notably, nearly three in ten (28 percent) say they don’t understand. Certaingroups are even more likely to say they don’t understand what costs they’re responsible for, including Spanishspeakers (41 percent)5, those with less than a high school degree (36 percent), those in fair or poor physical ormental health (36 percent and 34 percent, respectively), and those with incomes below the federal poverty level(32 percent).CHART 5Reported problems understanding costs by subgroupPercent who say they don’t understand what costs they’re responsible for:Healthy SF Average 28%By Primary LanguageSpanish speakers41%*Cantonese speakers24%25%English speakersBy Education LevelLess than High School diploma36%*High School diploma27%23%Higher than High School diplomaBy Health StatusFair/poor health36%*Excellent/good healthBy Mental Health Status24%Fair/poor mental health34%*26%Excellent/good mental healthBy IncomeLess than 100% FPL100% FPL and higher32%*15%* indicates statistically significant difference from comparison group (p .05); by language, significant difference between Spanish speakers andboth other groups; by education, significant difference between HS and both other groups.Source: Kaiser Family Foundation Survey of Healthy San Francisco Participants (conducted March 1-30, 2009)Further, one in five participants report that there has been a time when they needed care that they thought wascovered, but then learned it was not included or paid for by Healthy San Francisco. This experience is morecommonly reported by those in fair or poor physical or mental health (26 percent and 29 percent, respectively),those with chronic conditions (24 percent), and those who were prior users of their medical home before joiningHealthy San Francisco (22 percent).CHART 6Reported problems with care not being covered by subgroupPercent who say they needed care they thought was covered, but then learned it was notpaid for by Healthy San Francisco:Healthy SF Average 20%By Health Status26%*Fair/poor healthExcellent/good health18%By Mental Health StatusFair/poor mental healthExcellent/good mental health29%*19%By Chronic Condition24%*Have a chronic conditionDo not have a chronic condition16%By Prior Use of Medical Home22%*Prior usersNew users15%* indicates statistically significant difference from comparison group (p .05)Source: Kaiser Family Foundation Survey of Healthy San Francisco Participants (conducted March 1-30, 2009)5Again, this could reflect a real difference in problems understanding for those whose first language is not English, but it could also reflect inpart a difference in how respondents who speak different languages interpret this question due to survey translation issues.9
Survey of Healthy San Francisco ParticipantsKey FindingsBeyond problems understanding costs, there are other specific areas highlighted in the survey where educationchallenges remain. For example, nearly four in ten participants (37 percent) falsely believe that one can receivecare at locations outside of San Francisco as part of Healthy San Francisco, or say they don’t know. Thismisconception is more common among older participants (45 percent of those ages 50-64), those with less thana high school education (50 percent), those in fair or poor mental health (44 percent), and those who were priorusers of their Healthy San Francisco medical home (39 percent).In addition, nearly three in ten (28 percent) are unsure whether you need to re-apply each year to remain in theprogram, or incorrectly believe they don’t need to re-apply. Not surprisingly, those who have been in theprogram for more than one year are more likely to be aware of the need to re-apply. Still, even though theyhave already had to re-apply at least once, 17 percent of this group gets the question wrong or says they don’tknow.CHART 7Some are confused about key aspects of programAs far as you know, can you receive health careat locations outside of San Francisco as part ofthe Healthy San Francisco program, or not?63%No, cannot receivecare outside SF(Correct answer)9%Yes, canreceive careoutside SFAs far as you know, to continue to receiveservices by Healthy San Francisco, do you needto reapply each year, or are you permanently partof the program once you enroll for the first time?72%Need to re-apply each year(Correct answer)13%Don’t needto �t know37%Incorrect/Don’t knowSource: Kaiser Family Foundation Survey of Healthy San Francisco Participants (conducted March 1-30, 2009)CHART 8Misconceptions about geographic area of coverage by subgroupPercent who do not know that you cannot receive health care outside of San Franciscoas part of the program:Healthy SF Average 37%By Education LevelLess than High School diploma50% *35% *High School diplomaHigher than High School diploma28%By Age45% *Ages 50-64Ages 18-4930%By Mental Health Status44% *Fair/poor mental health35%Excellent/good mental healthBy Prior Use of Medical Home39% *Prior usersNew users28%* indicates statistically significant difference from comparison group (p .05); by education, significant difference for each 2-way comparison.Source: Kaiser Family Foundation Survey of Healthy San Francisco Participants (conducted March 1-30, 2009)10
Survey of Healthy San Francisco ParticipantsKey FindingsParticipants give positive reviews to the Healthy San Francisco enrollment process and writtenmaterials, but non-English speakers report slightly more challenges.When it comes to signing up for Healthy San Francisco, 86 percent of participants say the enrollment processwas easy, and 11 percent say it was difficult. Spanish speakers are somewhat more likely to report difficultywith enrollment – 18 percent of them say the process was difficult, compared with 10 percent of Englishspeakers and 9 percent of Cantonese speakers. Participants almost unanimously agree that the ApplicationAssistor who enrolled them was helpful, including 82 percent who say the Assistor was “very” helpful.CHART 9Positive reviews of enrollment processThinking back to when you first signed forHealthy San Francisco, would you say enrollingin the program was easy, or difficult?Thinking about the Healthy San FranciscoApplication Assistor, would you say thisperson was very helpful, somewhat helpful,not too helpful or not at all helpful?82%46%Very easy40%SomewhateasyVery helpful14%Somewhathelpful8%3%2%Other/Don't knowVeryDifficultSomewhatdifficult2%Don’t remember(vol.)1%Not too helpful/Not at all helpfulSource: Kaiser Family Foundation Survey of Healthy San Francisco Participants (conducted March 1-30, 2009)Nearly nine in ten participants (85 percent) say they have received handouts or other materials about howHealthy San Francisco works. However, 14 percent say they have not received such handouts, including 20percent of those in fair or poor health, 23 percent of African Americans, and 18 percent of Asians. Most saythey received handouts in their primary language, including 84 percent of Spanish speakers, 77 percent ofEnglish speakers, and 73 percent of Cantonese speakers.6 Most also say the handouts were easy tounderstand; however, 12 percent of Spanish and Cantonese speakers say they received handouts that werehard to understand, compared with 5 percent of English speakers.Table 4: Reports of receiving handouts by primary spoken languagePrimary spoken languageTotalEnglishSpanishCantoneseReceived handouts (NET)85%86%88%80%In primary language76778473Not in primary language/Don’t know9957Handouts were easy to understandHandouts were hard to understandDid not receive handoutsDon’t know if received handouts7487957612601214114 11201646Of 31 people in our survey whose primary spoken language is something other than English, Spanish, or Cantonese, 9 say they receivedhandouts in their primary language, 15 report receiving handouts not in their primary language, and 7 say they did not receive handouts.11
Survey of Healthy San Francisco ParticipantsKey FindingsA large majority of participants report having a usual source of care. Most understand that they have amedical home, and most have had an initial visit since joining the program.Eighty-six percent of Healthy San Francisco participants say they have a place to go when they are sick or needadvice about their health. Again, while it is difficult to make direct comparisons, when using the best availabledata, the share of Healthy San Francisco participants who report having a usual source of care appears to besimilar to the share of all San Francisco residents (88 percent). It is also slightly higher than the nationalestimate of 82 percent in 2007.Table 5: Percent reporting that there is a place they usually go when they are sick or need health adviceSan Francisco residentsAll U.S. residentsHealthyages 18-64ages 18-64San Francisco200920052007Yes, have a usual source of care**No, do not have a usual source of care8613881282*17** indicates statistically significant difference from Healthy San Francisco (p .05). See Appendix 2
In July 2006, the San Francisco Board of Supervisors passed the Health Care Security Ordinance, which . All San Francisco residents, ages 18-64, who have been uninsured for at least 90 days and who are ineligible for other public programs, are eligible for Healthy San Francisco.