Transcription
National VitalStatistics ReportsVolume 70, Number 1March 11, 2021U.S. State Life Tables, 2018by Elizabeth Arias, Ph.D., Brigham Bastian, B.S., Jiaquan Xu, M.D., and Betzaida Tejada-Vera, M.S., Division of Vital StatisticsAbstractObjectives—This report presents complete period life tablesfor each of the 50 states and the District of Columbia by sexbased on age-specific death rates in 2018.Methods—Data used to prepare the 2018 state-specificlife tables include 2018 final mortality statistics; July 1, 2018population estimates based on the 2010 decennial census; and2018 Medicare data for persons aged 66–99. The methodologyused to estimate the state-specific life tables is the same asthat used to estimate the 2018 national life tables, with somemodifications.Results—Among the 50 states and the District of Columbia,Hawaii had the highest life expectancy at birth, 81.0 yearsin 2018, and West Virginia had the lowest, 74.4 years. Lifeexpectancy at age 65 ranged from 17.5 years in Kentucky to 21.1years in Hawaii. Life expectancy at birth was higher for femalesin all states and the District of Columbia. The difference in lifeexpectancy between females and males ranged from 3.8 years inUtah to 6.2 years in New Mexico.Keywords: state life expectancy survival death rates National Vital Statistics SystemIntroductionThis report presents the first set of annual completeperiod life tables for each of the 50 states and the District ofColumbia (D.C.) for the year 2018. Life tables were produced forthe total, male, and female populations of each state and D.C.based on age-specific death rates for 2018. The methodologyused to estimate the state-specific life tables is the same as thatused to estimate the annual U.S. life tables, with some minormodifications described in the Technical Notes of this report (1).There are two types of life tables: the cohort (or generation)life table and the period (or current) life table. The cohort life tablepresents the mortality experience of a particular birth cohort—allpersons born in the year 1900, for example—from the momentof birth through consecutive ages in successive calendar years.Based on age-specific death rates observed through consecutivecalendar years, the cohort life table reflects the mortalityexperience of an actual cohort from birth until no lives remainin the group. To prepare just a single complete cohort life tablerequires data over many years. It is usually not feasible toconstruct cohort life tables based entirely on observed data forreal cohorts due to data unavailability or incompleteness (2). Forexample, a life table representation of the mortality experience ofa cohort of persons born in 1970 would require the use of dataprojection techniques to estimate deaths into the future (3,4).Unlike the cohort life table, the period life table does notrepresent the mortality experience of an actual birth cohort.Rather, the period life table presents what would happen to ahypothetical cohort if it experienced throughout its entire life themortality conditions of a particular period in time. For example,a period life table for 2018 assumes a hypothetical cohort thatis subject throughout its lifetime to the age-specific death ratesprevailing for the actual population in 2018. The period life tablecould be characterized as rendering a “snapshot” of currentmortality experience and shows the long-range implications ofa set of age-specific death rates that prevailed in a given year. Inthis report the term “life table” refers only to the period life tableand not to the cohort life table.Life tables can be classified in two ways according tothe length of the age interval in which data are presented. Acomplete life table contains data for every single year of age. Anabridged life table typically contains data by 5- or 10-year ageintervals. A complete life table can easily be aggregated into 5- or10-year age groups. U.S. decennial life tables and, beginning in1997, U.S. annual life tables, are complete life tables. This reportpresents the first in a series of annual complete period statespecific life tables.U.S. DEPARTMENT OF HEALTH AND HUMAN SERVICESCenters for Disease Control and PreventionNational Center for Health StatisticsNational Vital Statistics SystemNCHS reports can be downloaded from: https://www.cdc.gov/nchs/products/index.htm.
2National Vital Statistics Reports, Vol. 70, No. 1, March 11, 2021Data and MethodsThe data used to prepare the U.S. state life tables for 2018are state-specific final numbers of deaths for the year 2018;July 1, 2018 state-specific population estimates based on the2010 decennial census; and state-specific death and populationcounts for Medicare beneficiaries aged 66–99 for the year 2018from the Centers for Medicare & Medicaid Services. Data fromthe Medicare program are used to supplement vital statisticsand census data for ages 66 and over. The methodology used toestimate the 2018 complete life tables for the 50 states and D.C.presented in this report is the same as what is used to estimatethe annual U.S. national life tables, with some modifications. Forsome states, very small age-specific or zero numbers of deathsin childhood ages sometimes required the use of additionalsmoothing techniques not necessary in the construction of thenational life tables. A modification to the estimation of deathrates in the oldest ages was also necessary due to the lack ofstate-specific census population estimates for ages 85–100. Themethodology with modifications used to construct the first set ofannual U.S. state life tables is described in detail in the TechnicalNotes of this report.Explanation of the columns of the life tableColumn 1. Age (between x and x 1)—Shows the ageinterval between the two exact ages indicated. For instance,“20–21” means the 1-year interval between the 20th and 21stbirthdays.Column 2. Probability of dying (qx )—Shows the probabilityof dying between ages x and x 1. For example, for males whoreach age 20 in Massachusetts, the probability of dying beforereaching their 21st birthday is 0.000601 (Table MA–2). Thiscolumn forms the basis of the life table; all subsequent columnsare derived from it.Column 3. Number surviving (lx )—Shows the number ofpersons from the original hypothetical cohort of 100,000 livebirths who survive to the beginning of each age interval. The lxvalues are computed from the qx values, which are successivelyapplied to the remainder of the original 100,000 persons stillalive at the beginning of each age interval. For example, outof 100,000 male babies born alive in Massachusetts in 2018,99,243 will survive to their 21st birthday (Table MA–2).Column 4. Number dying (dx )—Shows the number dyingin each successive age interval out of the original 100,000live births. For example, out of 100,000 males born alive inMassachusetts in 2018, 60 will die between ages 20 and 21(Table MA–2). Each figure in column 4 is the difference betweentwo successive figures in column 3.Column 5. Person-years lived (Lx )—Shows the number ofperson-years lived by the hypothetical life table cohort within anage interval x to x 1. Each figure in column 5 represents thetotal time (in years) lived between two indicated birthdays by allthose reaching the earlier birthday. Therefore, the figure 99,213for males in the age interval 20–21 is the total number of yearslived between the 20th and 21st birthdays by the 99,243 males inMassachusetts (column 3) who reached their 20th birthday outof 100,000 males born alive (Table MA–2).Column 6. Total number of person-years lived (Tx )—Showsthe total number of person-years that would be lived after thebeginning of the age interval x to x 1 by the hypothetical lifetable cohort. For example, the figure 5,776,560 is the totalnumber of years lived after attaining age 20 by the 99,243 malesreaching that age in Massachusetts (Table MA–2).Column 7. Expectation of life (ex )—The expectation of lifeat any given age is the average number of years remaining tobe lived by those surviving to that age, based on a given setof age-specific rates of dying. It is derived by dividing the totalperson-years that would be lived beyond age x by the numberof persons who survived to that age interval (Tx /lx ). Thus, theaverage remaining lifetime for males in Massachusetts whoreach age 20 is 58.2 years (5,776,560 divided by 99,243)(Table MA–2).Standard errors of the probability of dying andlife expectancyAlthough they are based on complete counts of death, thelife table functions presented in this report are subject to error.Therefore, standard errors of the two most important functions,the probability of dying and life expectancy, are also presented.The mortality data on which the state life tables are based are notaffected by sampling error because they are based on completecounts of deaths and, as a result, standard errors reflect onlystochastic (random) variation. While measurement errors suchas age misreporting on death certificates or census data areknown to affect mortality estimates, they are not considered inthe calculation of the standard errors of the life table functions.In most cases, standard errors for life expectancy at birth and theprobability of dying are small due to large numbers of deaths.However, for some states with small populations, particularly atthe youngest ages, the standard errors presented are relativelylarge.ResultsComplete life tables for the 50 states and D.C.A set of complete period life tables for each state andD.C. is available online from ‘‘U.S. State Life Tables, 2018” at:https://ftp.cdc.gov/pub/Health Statistics/NCHS/Publications/NVSR/70-01/. Table I lists table titles for each of these tables.Table numbering is based on the federal information processingstandards, or FIPS, alpha code for the state combined with a tablecode. The table code is denoted as 1 for the total population, 2for males, 3 for females, and 4 for the standard errors of theprobability of dying and life expectancy. For example, Table FL–2refers to the complete period life table for males in Florida.Life expectancy in the 50 states and D.C.Table A shows life expectancy at birth for the total, male, andfemale populations for the 50 states, D.C., and the United States.In 2018, among the 50 states and D.C., Hawaii ranked first ashaving the highest life expectancy for the total population, with
National Vital Statistics Reports, Vol. 70, No. 1, March 11, 20213Table A. Life expectancy at birth, rank, and standard error, by sex: Each state, the District of Columbia, and United States, 2018AreaRankTotalStandard errorRankMaleStandard errorRankFemaleStandard errorHawaii . . . . . . . . . . . . . . . .California . . . . . . . . . . . . . .New York . . . . . . . . . . . . . .Minnesota . . . . . . . . . . . . .Connecticut . . . . . . . . . . . .Massachusetts . . . . . . . . . .Washington . . . . . . . . . . . .Colorado . . . . . . . . . . . . . .New Jersey . . . . . . . . . . . .Rhode Island . . . . . . . . . . 0.173Oregon . . . . . . . . . . . . . . . .Utah . . . . . . . . . . . . . . . . . .Vermont . . . . . . . . . . . . . . .North Dakota . . . . . . . . . . .Wisconsin . . . . . . . . . . . . .Iowa . . . . . . . . . . . . . . . . . .New Hampshire . . . . . . . . .Nebraska . . . . . . . . . . . . . .Idaho . . . . . . . . . . . . . . . . .Virginia. . . . . . . . . . . . . . . 0.0760.1030.1540.1330.1390.063South Dakota . . . . . . . . . . .Florida . . . . . . . . . . . . . . . .Illinois . . . . . . . . . . . . . . . .United States . . . . . . . . . . .Montana . . . . . . . . . . . . . . .Arizona . . . . . . . . . . . . . . . .Maine . . . . . . . . . . . . . . . . .Maryland . . . . . . . . . . . . . .Texas . . . . . . . . . . . . . . . . .Pennsylvania . . . . . . . . . . .Wyoming . . . . . . . . . . . . . .212223 78.178.10.1540.0320.040 0.1380.0550.1210.0580.0260.0400.185222423 75.576.10.2200.0470.058 0.1970.0800.1790.0870.0380.0590.267201624 80.880.30.2090.0420.052 0.1880.0710.1570.0750.0350.0530.252Kansas . . . . . . . . . . . . . . . .Alaska . . . . . . . . . . . . . . . .Nevada . . . . . . . . . . . . . . . .Delaware . . . . . . . . . . . . . .Michigan . . . . . . . . . . . . . .District of Columbia . . . . . .North Carolina . . . . . . . . . .Georgia . . . . . . . . . . . . . . .New Mexico . . . . . . . . . . . .Indiana . . . . . . . . . . . . . . . .Ohio . . . . . . . . . . . . . . . . . .1380.0750.057Missouri . . . . . . . . . . . . . . .South Carolina . . . . . . . . . .Arkansas . . . . . . . . . . . . . .Oklahoma . . . . . . . . . . . . . .Louisiana . . . . . . . . . . . . . .Tennessee . . . . . . . . . . . . .Kentucky . . . . . . . . . . . . . .Alabama . . . . . . . . . . . . . . .Mississippi . . . . . . . . . . . . .West Virginia . . . . . . . . . . 80.0910.0750.0910.0890.1190.152 Category not applicable.NOTE: Life expectancies shown in this table are rounded, but rankings are based on unrounded life expectancies.SOURCE: National Center for Health Statistics, National Vital Statistics System, Mortality.
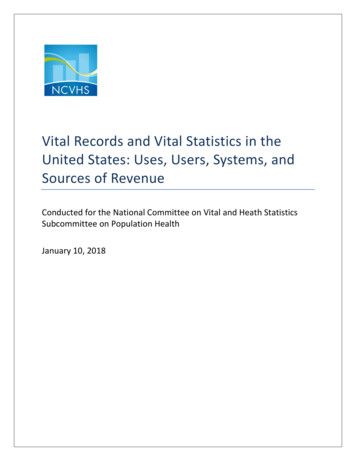
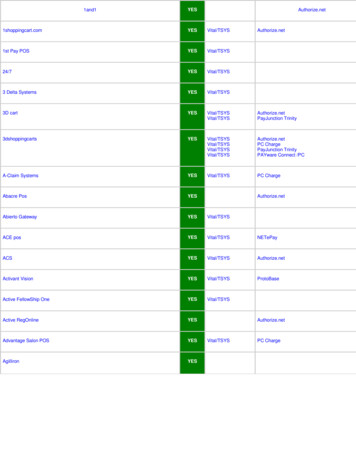
4National Vital Statistics Reports, Vol. 70, No. 1, March 11, 202117.5 and 18.6, respectively. For males, Mississippi ranked 51st,with a life expectancy at age 65 of 15.9 years. In comparison, lifeexpectancy at age 65 for the entire United States was 19.5, 18.1,and 20.7 for the total, male, and female populations, respectively.Figure 3 shows that states with the lowest life expectancies atage 65 are mostly concentrated in the south, and those with thehighest life expectancies are mostly in the west and northeast.a life expectancy at birth of 81.0 years. California ranked firstfor males, with a life expectancy of 78.4 years. West Virginiaranked 51st, with the lowest life expectancy among the 50 statesand D.C. for the total, male, and female populations, with lifeexpectancies at birth of 74.4, 71.7, and 77.3 years, respectively.In comparison, life expectancy at birth for the entire UnitedStates was 78.7, 76.2, and 81.2 for the total, male, and femalepopulations, respectively. Figure 1 presents a map of the UnitedStates with state-specific life expectancy at birth grouped intoquartiles. It shows that states with the lowest life expectancy atbirth are mostly southern states, and states with the highest lifeexpectancy at birth are predominantly western and northeasternstates.The difference in life expectancy between the sexes in theUnited States was 5.0 years in 2018, ranging from a high of 6.2years in New Mexico to a low of 3.8 years in Utah (Figure 2).With a few exceptions, the states with the largest sex differencesare those with lower life expectancy at birth, while the smallestsex differences are found mostly among states with higher lifeexpectancy.Table B shows life expectancy at age 65 for the total,male, and female populations for the 50 states, D.C., and theUnited States. In 2018, Hawaii ranked first for the total, male,and female populations, with life expectancy at age 65 of 21.1,19.3, and 22.6 years, respectively. Kentucky ranked 51st, withthe lowest life expectancy among the 50 states and D.C. for thetotal and female populations, with life expectancy at age 65 ofSummaryThis report presents the first ever annual complete periodlife tables for the 50 states and D.C. and represents the first in aplanned series of annual state life tables. Historically, completeperiod state life tables have been published once a decade as partof the decennial life table program, beginning with the set forthe 1939–1941 decennial period (5). Only one other set of statelevel life tables has been published by the National Center forHealth Statistics. Those tables were part of a project to producecensus tract-level life tables and were generated primarily for thepurpose of evaluating the validity of the census tract-level lifetables (6). They are not strictly comparable with the completelife tables presented in this report because they were based on 5years of pooled data (2011–2015) and were abridged rather thancomplete life tables.Figure 1. Life expectancy at birth: Each state, the District of Columbia, and United States, VAKYNCTNHISOURCE: National Center for Health Statistics, National Vital Statistics System, United States life expectancy: 78.7
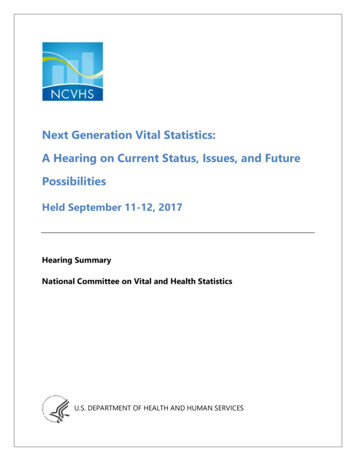
National Vital Statistics Reports, Vol. 70, No. 1, March 11, 2021Figure 2. Difference between male and female life expectancy at birth: Each state, the District of Columbia, andUnited States, 2018New Mexico6.2Hawaii5.95.9District of sippiSouth Carolina5.6West 5.35.35.3PennsylvaniaKentuckyMaine5.35.3North CarolinaArkansas5.25.2Difference in life expectancy at birth s5.0United StatesNew Jersey5.0Rhode IslandConnecticutSouth sachusettsTexasNew h Dakota4.74.74.7VermontVirginia4.74.7New 4.2United States life expectancy: 78.73.8Utah03.54.05.0Difference in life expectancy at birth (years)NOTE: The color key reflects the range of life expectancy at birth for both sexes for each area.SOURCE: National Cemter for Health Statistics, National Vital Statistics System, Mortality.6.07.05
6National Vital Statistics Reports, Vol. 70, No. 1, March 11, 2021Table B. Life expectancy at age 65, rank, and standard error, by sex: Each state, the District of Columbia, and United States, 2018AreaRankTotalStandard errorRankMaleStandard errorRankFemaleStandard errorHawaii . . . . . . . . . . . . . . . .California . . . . . . . . . . . . . .Connecticut . . . . . . . . . . . .New York . . . . . . . . . . . . . .Colorado . . . . . . . . . . . . . .Minnesota . . . . . . . . . . . . .Florida . . . . . . . . . . . . . . . .Massachusetts . . . . . . . . . .New Jersey . . . . . . . . . . . .Washington . . . . . . . . . . . 350.038Vermont . . . . . . . . . . . . . . .South Dakota . . . . . . . . . . .North Dakota . . . . . . . . . . .Oregon . . . . . . . . . . . . . . . .Arizona . . . . . . . . . . . . . . . .District of Columbia . . . . . .Rhode Island . . . . . . . . . . .Utah . . . . . . . . . . . . . . . . . .United States . . . . . . . . . . .Montana . . . . . . . . . . . . . . .1112131415161718 790.0910.0350.0280.1130.0730.048 0.06691719111523217 060.1240.0500.0410.1670.1020.069 0.093126111715141829 120.1290.0480.0380.1490.1000.066 0.088New Mexico . . . . . . . . . . . .New Hampshire . . . . . . . . .Wisconsin . . . . . . . . . . . . .Maryland . . . . . . . . . . . . . .Illinois . . . . . . . . . . . . . . . .Idaho . . . . . . . . . . . . . . . . .Iowa . . . . . . . . . . . . . . . . . .Virginia. . . . . . . . . . . . . . . .Nebraska . . . . . . . . . . . . . .Alaska . . . . . . . . . . . . . . . 30.0300.0770.0590.0360.0770.127Delaware . . . . . . . . . . . . . .Maine . . . . . . . . . . . . . . . . .Pennsylvania . . . . . . . . . . .Wyoming . . . . . . . . . . . . . .Michigan . . . . . . . . . . . . . .Texas . . . . . . . . . . . . . . . . .Kansas . . . . . . . . . . . . . . . .Nevada . . . . . . . . . . . . . . . .North Carolina . . . . . . . . . .South Carolina . . . . . . . . . 00.0320.0210.0630.0600.0320.043Missouri . . . . . . . . . . . . . . .Ohio . . . . . . . . . . . . . . . . . .Georgia . . . . . . . . . . . . . . .Indiana . . . . . . . . . . . . . . . .Louisiana . . . . . . . . . . . . . .Tennessee . . . . . . . . . . . . .Arkansas . . . . . . . . . . . . . .Oklahoma . . . . . . . . . . . . . .West Virginia . . . . . . . . . . .Alabama . . . . . . . . . . . . . . .Mississippi . . . . . . . . . . . . .Kentucky . . . . . . . . . . . . . 330.0410.0490.0390.0610.0540.0710.0460.0610.049 Category not applicable.NOTE: Life expectancies shown in this table are rounded, but rankings are based on unrounded life expectancies.SOURCE: National Center for Health Statistics, National Vital Statistics System, Mortality.
National Vital Statistics Reports, Vol. 70, No. 1, March 11, 20217Figure 3. Life expectancy at 65 years: Each state, the District of Columbia, and United States, ited States life expectancy at 65 years: 19.5HISOURCE: National Center for Health Statistics, National Vital Statistics System, Mortality.References1.2.3.4.5.6.7.Arias E, Xu JQ. United States life tables, 2018. National VitalStatistics Reports; vol 69 no 12. Hyattsville, MD: NationalCenter for Health Statistics. 2020.Shryock HS, Siegel JS, Larmon EA. The methods andmaterials of demography, vol 2. U.S. Bureau of the Census.Washington, DC: U.S. Government Printing Office. 1971.Moriyama IM, Gustavus SO. Cohort mortality andsurvivorship: United States death-registration states,1900–1968. National Center for Health Statistics. VitalHealth Stat 3(16). 1972. Available from: https://www.cdc.gov/nchs/data/series/sr 03/sr03 016.pdf.Preston SM, Heuveline P, Guillot M. Demography:Measuring and modeling population processes. Oxford:Blackwell Publishers. 2001.Greville TNE. United States life tables and actuarial tables,1939–1941. Public Health Service, National Office of VitalStatistics. 1948.Arias E, Escobedo LA, Kennedy J, Fu C, Cisewski J. U.S.small-area life expectancy estimates project: Methodologyand results summary. National Center for Health Statistics.Vital Health Stat 2(181). 2018.Bell FC, Miller ML. Life tables for the United States SocialSecurity area 1900–2100. Baltimore, MD: Social SecurityAdministration, Office of the Chief Actuary. SSA Pub. No.11–11536. 2005.8.9.10.11.12.13.Anderson RN. Method for constructing complete annualU.S. life tables. National Center for Health Statistics. VitalHealth Stat 2(129). 1999. Available from: https://www.cdc.gov/nchs/data/series/sr 02/sr02 129.pdf.Thatcher AR, Kannisto V, Vaupel JW. The force of mortalityat ages 80 to 120. Odense, Denmark: Odense UniversityPress. 1998.Andreev KF, Bourbeau RR. Frailty modeling of Canadian andSwedish mortality at adult and advanced ages. PopulationAssociation of America Annual Meeting. 2007.Chiang CL. The life table and its applications. Malabar, FL:Krieger Publishing. 1984.Arias E, Curtin SC, Tejada-Vera B. U.S. decennial life tablesfor 2009–2011: Methodology of the United States life tables.National Vital Statistics Reports; vol 69 no 10. Hyattsville,MD: National Center for Health Statistics. 2020.Silcocks PB, Jenner DA, Reza R. Life expectancy asa summary of mortality in a population: Statisticalconsiderations and suitability for use by health authorities.J Epidemiol Community Health 55(1):38–43. 2001.
8National Vital Statistics Reports, Vol. 70, No. 1, March 11, 2021Technical NotesThe methods used to estimate the 2018 complete life tablesfor the 50 states and the District of Columbia (D.C.) are the sameas those used to estimate the U.S. annual life tables, with twomodifications (1). First, for states with zero death counts atsingle ages 1–4, linear interpolation was used to replace thosezero death counts. For a few states, linear interpolation wasused to replace zero and negative death counts resulting fromthe application of the Beers’ smoothing technique to very smalldeath counts for ages 6–12. Second, a modification was madeto the estimation of the age-specific death rates for ages 66–99years. Because state age-specific census population estimatesfor ages 85–100 are not available, it was necessary to modifythe age range where vital and Medicare death rates are blendedand where Medicare data are used exclusively (details of themethodology and modifications are provided below).Data for calculating life table functionsThe data used to prepare the U.S. state life tables (Table I)include state-specific final death counts from the National VitalStatistics System (NVSS), state-specific population estimatesfrom the U.S. Census Bureau, and state-specific death andpopulation counts for Medicare beneficiaries aged 66–99 fromthe Centers for Medicare & Medicaid Services (CMS).Vital statistics dataDeath counts used for computing the life tables presentedin this report are state-specific final numbers of deaths for 2018collected from death certificates filed in state vital statisticsoffices and reported to the National Center for Health Statistics(NCHS) as part of NVSS.Census population dataThe population data used to estimate the life tables shownin this report are state-specific postcensal population estimatesbased on the 2010 decennial census and are available from theU.S. Census website at: Medicare dataData from the Medicare program are used to supplementvital statistics and census data for ages 66–99 for the totalpopulation and by sex for each state and D.C.Medicare data are considered to be more accurate than vitalstatistics and census data at the oldest ages because Medicareenrollees must have proof of age to enroll (7). However, thereliability of Medicare data beyond age 100 declines because ofthe small percentage of persons who enrolled at the start of theMedicare program in 1965 for whom it was not possible to verifyexact age (7).To estimate death rates for the state-specific Medicarepopulations in 2018, sex- and age-specific numbers of deathsand population counts for the population aged 66–99 in eachstate and D.C. from the 2018 Medicare file were used. The datafile is created by CMS for the Social Security Administrationand shared with NCHS under a special agreement. The 2018file contains state-specific 2018 mid-year Medicare populationcounts (June 30, 2018) and calendar year Medicare death counts(January 1 through December 31, 2018). Age for both death andmid-year population counts is calculated as age at last birthday.Preliminary adjustment of the dataAdjustments for unknown ageAn adjustment is made to account for the smallproportion of deaths each year for which age is not reportedon the death certificate. The number of deaths in each agecategory is adjusted proportionally to account for thosewith not-stated age. An adjustment factor (F ) is used todistribute deaths with nonstated ages. F is calculated forthe total population and by sex for each state and D.C. as:where D is the total number of deaths and Da is the total numberof deaths for which age is stated. F is then applied by multiplyingit by the number of deaths in each age group.Interpolation of Px and DxAnomalies—both random and those associated withreporting age at death—can be problematic when using vitalstatistics and census data by single years of age to estimate theprobability of death (2,8). Graduation techniques are often usedto eliminate these anomalies and to derive a smooth curve byage. Beers’ ordinary minimized fifth difference formula is usedto obtain smoothed values of population counts (Px )
2 National Vital Statistics Reports, Vol. 70, No. 1, March 11, 2021. Data and Methods. The data used to prepare the U.S. state life tables for 2018