Transcription
National VitalStatistics ReportsVolume 59, Number 4March 16, 2011Deaths: Preliminary Data for 2009by Kenneth D. Kochanek, M.A.; Jiaquan Xu, M.D.; Sherry L. Murphy, B.S.; Arialdi M. Miniño M.P.H.;and Hsiang-Ching Kung, Ph.D., Division of Vital StatisticsAbstractObjectives—This report presents preliminary U.S. data ondeaths, death rates, life expectancy, leading causes of death, andinfant mortality for 2009 by selected characteristics such as age, sex,race, and Hispanic origin.Methods—Data in this report are based on death records com prising more than 96 percent of the demographic and medical files forall deaths in the United States in 2009. The records are weighted toindependent control counts for 2009. Comparisons are made with 2008preliminary data.Results—The age-adjusted death rate decreased from 758.7deaths per 100,000 population in 2008 to 741.0 deaths per 100,000population in 2009. From 2008 to 2009, age-adjusted death ratesdecreased significantly for 10 of the 15 leading causes of death:Diseases of heart, Malignant neoplasms, Chronic lower respiratorydiseases, Cerebrovascular diseases, Accidents (unintentional injuries),Alzheimer’s disease, Diabetes mellitus, Influenza and pneumonia,Septicemia, and Assault (homicide). Life expectancy increased by 0.2year, from 78.0 in 2008 to 78.2 in 2009.Keywords: death rates c life expectancy c vital statistics c cause ofdeathIntroductionThis report presents preliminary mortality data for the UnitedStates based on vital records for a substantial proportion of deathsoccurring in 2009. Statistics in preliminary reports are generallyconsidered reliable; past analyses reveal that most statistics shown inpreliminary reports for 1995–2007 were confirmed by the finalstatistics for each of those years (1–13).Data Sources and MethodsPreliminary data in this report are based on records of deathsthat occurred in calendar year 2009, which were received from statevital statistics offices and processed by the Centers for DiseaseControl and Prevention’s (CDC) National Center for Health Statistics(NCHS) as of November 5, 2010. Estimates of the level of complete ness of preliminary data for each state are shown in Table I (see‘‘Technical Notes’’). Detailed information on the nature, sources, andqualifications of the preliminary data are given in ‘‘Technical Notes.’’The preliminary 2009 data for Georgia were incomplete, therefore,additional review of the data was included to ensure that the 2009estimates for the United States were accurate.Each state vital statistics office reported to NCHS the number ofdeaths registered and processed for calendar year 2009. Those statecounts were used as independent control counts for NCHS’ 2009preliminary national mortality file. A comparison of a) the number of2009 death records received from the states for processing by NCHSwith b) each state’s independent control counts of the number of deathsin 2009 indicates that demographic information for the United Stateswas available for an estimated 97 percent of infant deaths (under age1 year) and 99 percent of deaths of persons aged 1 year and overoccurring in calendar year 2009 (see Table I in ‘‘Technical Notes’’).Medical (or cause-of-death) information was processed separately andavailable for an estimated 94 percent of infant deaths and 97 percentof deaths of persons aged 1 year and over in 2009.To produce the preliminary estimates shown in this report, 2009records were weighted using 2009 state-specific, independent controlcounts of infant deaths and deaths of those aged 1 year and overreceived in state vital statistics offices. Two separate sets of weightswere applied to the death records—one set for demographic informa tion and another for medical information. This results in inconsistenciesbetween demographic data from the mortality demographic tables andthe medical tables showing causes of death (see ‘‘Nature and sourcesof data’’ in ‘‘Technical Notes’’). Preliminary estimates are subject tosampling variation as well as random variation.Cause-of-death information is not always available when prelimi nary data are sent to NCHS but is available later for final dataprocessing. As a result, estimates of cause of death based on pre liminary mortality data may differ from statistics developed from the finalmortality data (see Tables II and III in ‘‘Technical Notes’’). Such dif ferences may affect certain causes of death where the cause is pendinginvestigation, such as for Assault (homicide), Intentional self-harmU.S. DEPARTMENT OF HEALTH AND HUMAN SERVICESCenters for Disease Control and PreventionNational Center for Health StatisticsNational Vital Statistics System
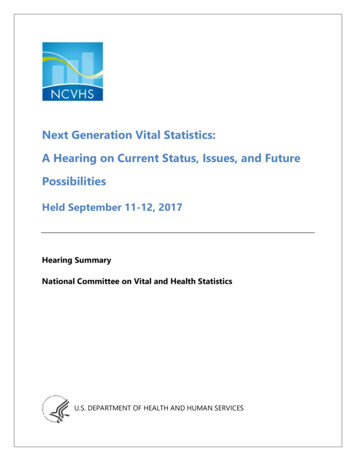
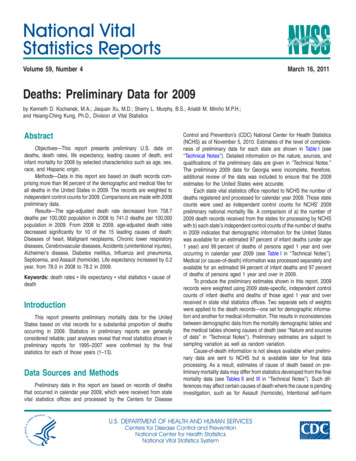
2National Vital Statistics Reports, Vol. 59, No. 4, March 16, 2011(suicide), Accidents (unintentional injuries), Drug-induced deaths, andSudden infant death syndrome (SIDS); see ‘‘Nonsampling error’’ in‘‘Technical Notes.’’This preliminary report includes national and state estimates oftotal deaths and death rates, as well as statistics on life expectancy,infant mortality, and causes of death. Data are shown for the followingrace and ethnic groups: white, non-Hispanic white, black, non-Hispanicblack, American Indian or Alaska Native (AIAN), Asian or PacificIslander (API), and Hispanic populations. Tabulations by race andethnic group are based on the race and ethnic group reported for thedecedent. Race and Hispanic origin are reported as separate items onthe death certificate. Death rates for AIAN, API, and, to a lesser extent,Hispanic populations are known to be too low because of reportingproblems (see ‘‘Race and Hispanic origin’’ in ‘‘Technical Notes’’).Changes in death rates from 2008 to 2009 were tested forstatistical significance. Differences in death rates across demographicgroups (but occurring in 2009 only) were also tested for statisticalsignificance. Unless otherwise specified, reported differences in deathrates are statistically significant.Age-adjusted death rates are better indicators than crude deathrates for showing changes in the risk of death over time when the agedistribution of the population is changing, and for comparing themortality of population subgroups that have different age compositions.All age-adjusted death rates are standardized to the year 2000 popu lation (see ‘‘Computing rates and percentages’’ in ‘‘Technical Notes’’).Two measures of infant mortality are shown: the infant death rateand the infant mortality rate (see ‘‘Infant mortality’’ in ‘‘Technical Notes’’).These measures typically are similar, although they can differ becausethey have different denominators. The denominator of the 2009 infantdeath rate is the estimated population under age 1 year on thereference date of July 1, 2009 (14). This estimated population includesa combination of infants born in 2008 who had not reached their firstbirthday by July 1, 2009, and infants born in 2009 before July 1. Incontrast, the denominator of the 2009 infant mortality rate is all livebirths occurring in 2009. The infant mortality rate is a better indicatorof the risk of dying during the first year of life than the infant death rate.This report includes data for 30 states and the District ofColumbia—Arkansas, California, Connecticut, Delaware, Florida,Georgia, Idaho, Illinois, Indiana, Kansas, Michigan, Montana,Nebraska, Nevada, New Hampshire, New Jersey, New Mexico, NewYork, North Dakota, Ohio, Oklahoma, Oregon, Rhode Island, SouthCarolina, South Dakota, Texas, Utah, Vermont, Washington, andWyoming—that had implemented the 2003 revision of the U.S. Stan dard Certificate of Death by 2009, and for the remaining 20 states thatcollected and reported death data in 2009 based on the 1989 revisionof the U.S. Standard Certificate of Death. The 2003 revision isdescribed in detail elsewhere (15,16). In this report, revised data arecombined with unrevised but comparable data. More details on pro cedures used to combine revised with unrevised data on race are givenin ‘‘Technical Notes.’’Because the 2000 U.S. census allowed for selection of multipleraces, death certificate data by race (i.e., the numerators for deathrates) are not wholly compatible with the population data collected inthis census. Data from the census are necessary to produce denomi nators for computing death rates.Multiple-race data were collected in 2009 by the 30 states and theDistrict of Columbia that used the 2003 revision of the U.S. StandardCertificate of Death in a manner that is consistent with the populationdata collected in the 2000 census. Four additional states—Hawaii,Maine, Minnesota, and Wisconsin—that used the 1989 revision of theU.S. Standard Certificate of Death also reported multiple-race data. Theremaining 16 states did not collect multiple-race data in 2009. In orderto produce national death rates for 2008 and 2009 for this report,multiple-race data from death certificates were ‘‘bridged’’ to be con sistent with the 1977 Office of Management and Budget (OMB) singlerace categories (17); that is, the multiple-race categories were bridgedback to single-race categories. In addition, data for Asian and NativeHawaiian or Other Pacific Islander (NHOPI) persons were reported asthe combined category API (18). The populations used to calculatedeath rates are also bridged to single-race categories. These popu lations are produced under a collaborative arrangement with the U.S.Census Bureau and are based on year 2000 census counts. Theprocedures used to produce the bridged populations are described inseparate publications (19,20). As the remaining 16 reporting areasgradually begin to collect data on race according to the 1997 OMBstandards (21), use of the bridged populations is expected to bediscontinued.Note that the population data used to compile the death rates byrace shown in this report are based on special estimation procedures.They are not true counts. The estimation procedures used to developthese populations are subject to error. Smaller population groups areaffected much more than larger populations by this measurement error,especially the AIAN population (19).Previous preliminary death reports have compared preliminarydata from the current data year with final data from the previous year(1–13). Because the final data for 2008 are not yet available, allcomparisons in this report are between the 2008 preliminary data (22)and the 2009 preliminary data.ResultsTrends in numbers and ratesThe preliminary number of deaths in the United States for 2009was 2,436,682 (Tables A and 1). The crude death rate of 793.7 per100,000 population was 2.4 percent less than the rate of 813.3 per100,000 in 2008. The estimated age-adjusted death rate, whichaccounts for changes in the age distribution of the population,reached a record low of 741.0 per 100,000 U.S. standard population,2.3 percent lower than the 2008 rate of 758.7 (Tables A and 1) (22).Figure 1 illustrates the general pattern of decline in both crude andage-adjusted death rates from 1980 through 2009. The age-adjusteddeath rate decreased from 2008 to 2009 by 2.8 percent for femalesand 1.4 percent for males. The relative magnitudes of significantchanges in age-adjusted death rates by sex, race, and Hispanicorigin (Table 1) are: White males—1.5 percent decreaseWhite females—3.0 percent decreaseNon-Hispanic white males—1.9 percent decreaseNon-Hispanic white females—3.3 percent decreaseBlack females—1.5 percent decreaseNon-Hispanic black females—1.7 percent decrease
National Vital Statistics Reports, Vol. 59, No. 4, March 16, 20113Table A. Deaths, age-adjusted death rates, and life expectancy at birth, by race and sex, and infant deaths andmortality rates, by race: United States, preliminary 2008 and 2009[Data based on a continuous file of records received from the states. Figures are based on weighted data rounded to the nearest individual, so categories may not add tototals]All races1White2Black2Measure and sex200920082009200820092008All deaths . . . . . . . . . . . . . . . . . .Male . . . . . . . . . . . . . . . . . . . .Female . . . . . . . . . . . . . . . . . 1Age-adjusted death rate3 . . . . . . . . .Male . . . . . . . . . . . . . . . . . . . .Female . . . . . . . . . . . . . . . . . 6889.5637.1923.91,148.0767.7935.61,151.3779.0Life expectancy at birth (in years)4 . . .Male . . . . . . . . . . . . . . . . . . . .Female . . . . . . . . . . . . . . . . . 4.370.977.474.370.977.4All infant deaths . . . . . . . . . . . . . .Infant mortality rate5 . . . . . . . . . . . 18,51312.681Includes races other than white and black.Race categories are consistent with 1977 Office of Management and Budget (OMB) standards. Multiple-race data were reported for Arkansas, California, Connecticut, Delaware, District of Columbia,Florida, Georgia, Hawaii, Idaho, Illinois, Indiana, Kansas, Maine, Michigan, Minnesota, Montana, Nebraska, Nevada, New Hampshire, New Jersey, New Mexico, New York, North Dakota, Ohio,Oklahoma, Oregon, Rhode Island, South Carolina, South Dakota, Texas, Utah, Vermont, Washington, Wisconsin, and Wyoming in 2009 and 2008. Multiple-race data for these reporting areas werebridged to single-race categories of the 1977 OMB standards for comparability with other reporting areas; see ‘‘Technical Notes.’’3Per 100,000 U.S. standard population, based on the year 2000 standard.4Data for 2008 have been updated and may differ from that previously published; see ‘‘Technical Notes.’’5Deaths under age 1 year per 1,000 live births in specified group.2than that for the non-Hispanic white population (Table 1). It isimportant to keep in mind, however, that mortality for races other thanwhite and black may be seriously understated in some cases due tounderreporting for some race groups and Hispanic origin on deathcertificates (23–25).Statistically significant decreases in mortality from 2008 to 2009were registered for those under age 1 year, 1–4 years, 15–24 years,and across age groups ranging from age 55 through 84 years. Otherage groups did not experience significant change. The magnitude ofthe significant changes in mortality by age group is (Table 1):Rate per 100,000 population1,100Age 052009NOTE: Crude death rates on an annual basis are per 100,000 population; age-adjustedrates are per 100,000 U.S. standard population; see “Technical Notes.”SOURCE: CDC/NCHS, National Vital Statistics System, Mortality.Figure 1. Crude and age-adjusted death rates:United States, 1980–2007 final and 2008–2009 preliminary Hispanic males—2.6 percent decreaseHispanic females—3.3 percent decreaseAmong the major race and Hispanic origin groups, the lowestmortality was reported for the API, Hispanic, and AIAN populations.Compared with the non-Hispanic white population, preliminary ageadjusted death rates were 44.5 percent lower for the API population,30.3 percent lower for the Hispanic population, and 19.0 percentlower for the AIAN population. In contrast, the age-adjusted deathrate for the non-Hispanic black population was 26.6 percent higher Under 1 year—4.2 percent decrease1–4 years—7.7 percent decrease15–24 years—6.7 percent decrease55–64 years—0.9 percent decrease65–74 years—3.4 percent decrease75–84 years—4.9 percent decreaseThe death rate for ‘‘under 1 year’’ shown above is based on apopulation estimate and is different from the infant mortality rate,which is based on live births (see ‘‘Infant mortality’’).Preliminary life expectancy data shown in this report for the 2008data year have been updated and may differ from those previouslypublished (see ‘‘Life Tables’’ in ‘‘Technical Notes’’). Life expectancy datashown in this report for data years 2008–2009 are based on meth odology that was revised in 2000. The revised methodology is similarto that developed for the 1999–2001 decennial life tables; see ‘‘Tech nical Notes.’’ The preliminary estimate of life expectancy at birth for thetotal population in 2009 is 78.2 years. This represents an increase inlife expectancy of 0.2 year relative to 2008 (Tables A and 6). Lifeexpectancy for males increased 0.2 year, from 75.5 in 2008 to 75.7 in2009. Female life expectancy increased from 80.5 to 80.6. The dif
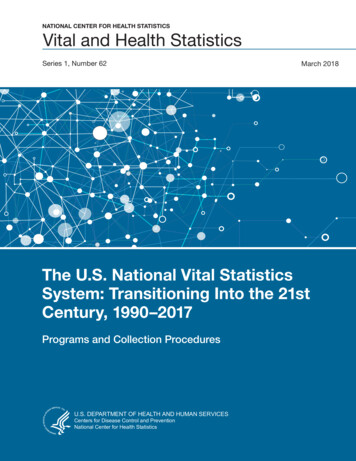
4National Vital Statistics Reports, Vol. 59, No. 4, March 16, 2011ference between male and female life expectancy at birth has beengenerally decreasing since its peak of 7.8 years in 1979 (26). The gapbetween male and female life expectancy was 4.9 years in 2009. Thedifference in life expectancy between the white and black populationsin 2009 was 4.3 years, a 0.2-year increase from the 2008 gap betweenthe two races (22).White females have the highest life expectancy (Figure 2), fol lowed by, in order, black females, white males, and black males.Figure 2 also shows that this pattern has not changed from 1975through 2009, even though life expectancy for all groups has generallyincreased over this time period.By state of residence, Hawaii had the lowest mortality in 2009 withan age-adjusted death rate of 619.8 deaths per 100,000 standardpopulation (Table 3). Mortality was highest in West Virginia, with anage-adjusted death rate of 949.6 per 100,000 standard population.Causes of deathThe 15 leading causes of death in 2009 remained the same asin 2008, with the exception of two causes that exchanged ranks.Intentional self-harm (suicide), the 11th leading cause of death in2008, became the 10th leading cause of death in 2009, whereasSepticemia, the 10th leading cause in 2008, became the 11th leadingcause of death in 2009.The 15 leading causes of death in 2009 (Table B) were:1.2.3.4.5.6.7.8.9.10.11.12.13.14.15.Diseases of heartMalignant neoplasmsChronic lower respiratory diseasesCerebrovascular diseasesAccidents (unintentional injuries)Alzheimer’s diseaseDiabetes mellitusInfluenza and pneumoniaNephritis, nephrotic syndrome and nephrosisIntentional self-harm (suicide)SepticemiaChronic liver disease and cirrhosisEssential hypertension and hypertensive renal diseaseParkinson’s diseaseAssault (homicide)From 2008 to 2009, the age-adjusted death rate declinedsignificantly for 10 of the 15 leading causes of death. The preliminary8580White femaleAll races, both sexes75Age in yearsBlack female70White maleBlack male656001975198019851990199520002005SOURCE: CDC/NCHS, National Vital Statistics System, Mortality.Figure 2. Life expectancy at birth, by race and sex: United States, 1975–2007 final and 2008–2009 preliminary2009
National Vital Statistics Reports, Vol. 59, No. 4, March 16, 20115Table B. Deaths and death rates for 2009, and age-adjusted death rates and percent changes from 2008 to 2009, forthe 15 leading causes of death: United States, preliminary 2008 and 2009[Data based on a continuous file of records received from the states. Rates are per 100,000 population; age-adjusted rates per 100,000 U.S. standard population are based onthe year 2000 standard; see ‘‘Technical Notes.’’ For explanation of asterisks (*) preceding cause-of-death codes, see ‘‘Technical Notes.’’ Figures are based on weighted datarounded to the nearest individual, so categories may not add to totals]Age-adjusted death rateRank1Cause of death (based on the International Classification of Diseases,Tenth Revision, Second Edition, 9101112131415.All causes . . . . . . . . . . . . . . . . . . . . . . . . . . . . . . . . . . . . . . .Diseases of heart . . . . . . . . . . . . . . . . . . . . . . (I00–I09,I11,I13,I20–I51)Malignant neoplasms . . . . . . . . . . . . . . . . . . . . . . . . . . . (C00–C97)Chronic lower respiratory diseases . . . . . . . . . . . . . . . . . . . . (J40–J47)Cerebrovascular diseases . . . . . . . . . . . . . . . . . . . . . . . . . . (I60–I69)Accidents (unintentional injuries) . . . . . . . . . . . . . . (V01–X59,Y85–Y86)2Alzheimer’s disease. . . . . . . . . . . . . . . . . . . . . . . . . . . . . . . (G30)Diabetes mellitus . . . . . . . . . . . . . . . . . . . . . . . . . . . . . . (E10–E14)Influenza and pneumonia . . . . . . . . . . . . . . . . . . . . . . . . . (J09–J18)Nephritis, nephrotic syndrome and nephrosis . (N00–N07,N17––N19,N25–N27)Intentional self-harm (suicide) . . . . . . . . . . . . . . . (*U03,X60–X84,Y87.0)2Septicemia . . . . . . . . . . . . . . . . . . . . . . . . . . . . . . . . . . (A40–A41)Chronic liver disease and cirrhosis . . . . . . . . . . . . . . . . . (K70,K73–K74)Essential hypertension and hypertensive renal disease . . . . . . . (I10,I12,I15)Parkinson’s disease . . . . . . . . . . . . . . . . . . . . . . . . . . . . (G20–G21)Assault (homicide). . . . . . . . . . . . . . . . . . (*U01–*U02,X85–Y09,Y87.1)2All other causes . . . . . . . . . . . . . . . . . . . . . . . . . . . . . . . 4.1–4.1–4.1–4.70.00.9–1.80.00.00.0–6.8. . . Category not applicable.1Based on number of deaths.2For unintentional injuries, suicides, and homicides, preliminary and final data may differ significantly because of the truncated nature of the preliminary file.NOTES: Data are subject to sampling and random variation. For information regarding the calculation of standard errors and further discussion of variability of the data, see ‘‘Technical Notes.’’age-adjusted death rate for the leading cause of death, Diseases ofheart, decreased by 3.7 percent. The age-adjusted death rate forMalignant neoplasms decreased by 1.1 percent (Tables B and 2).Deaths from these two diseases combined accounted for 48 percentof deaths in the United States in 2009. Although heart diseasemortality has exhibited a downward trend since 1950, cancermortality began to decline only in the early 1990s (10,22). Thepreliminary age-adjusted death rate also decreased significantly forChronic lower respiratory diseases (4.1 percent) and Cerebrovasculardiseases (4.2 percent).Other leading causes of death that showed significant decreasesin 2009 relative to 2008 were: Accidents (unintentional injuries)(4.1 percent), Alzheimer’s disease (4.1 percent), Diabetes mellitus(4.1 percent), Influenza and pneumonia (4.7 percent), Septicemia(1.8 percent), and Assault (homicide) (6.8 percent).The observed increase in the age-adjusted death rate for Inten tional self-harm (suicide) was not significant. The age-adjusted deathrates for Nephritis, nephrotic syndrome and nephrosis; Chronic liverdisease and cirrhosis; Essential hypertension and hypertensive renaldisease; and Parkinson’s disease remained unchanged from 2008 to2009.Human immunodeficiency virus (HIV) disease was not among the15 leading causes of death in 2009. The preliminary age-adjusted deathrate for HIV disease declined by 9.1 percent from 2008 to 2009(Table 2). Following a period of increase from 1987 through 1994, HIVdisease mortality reached a plateau in 1995. Subsequently, the rate forthis disease decreased an average of 33.0 percent per year from 1995through 1998 (27), and 5.1 percent per year from 1999 through 2008(22). For all races combined in the age group 15–24, HIV disease wasthe 12th leading cause of death in 2009, decreasing by two positionsrelative to its rank as 10th leading cause for those aged 15–24 in 2008.HIV disease remained the sixth leading cause of death for the agegroup 25–44, unchanged in rank from 2008. Among decedents aged45–64, HIV disease dropped from 12th leading cause in 2008 to 13thleading cause.Enterocolitis due to Clostridium difficile (C. difficile)—a predomi nantly antibiotic-associated inflammation of the intestines caused by C.difficile, a gram-positive, anaerobic, spore-forming bacillus—is ofgrowing concern. The disease is often acquired by long-term patientsor residents in hospitals or other health-care facilities and accountedfor an increasing number of deaths between 1999 and 2008 (28,29).In 1999, 793 deaths were due to C. difficile compared with 7,483 C.difficile deaths in 2008 (22). In 2009, the number of deaths decreasedto 7,285. The age-adjusted death rate for this cause decreased from2.3 deaths per 100,000 standard population in 2008 to 2.2 deaths per100,000 standard population in 2009 (4.3 percent). In 2009, C. difficileranked as the 19th leading cause of death for the population aged 65and over. Approximately 92 percent of deaths from C. difficile occurredto people aged 65 and over (data not shown).The preliminary age-adjusted death rate for drug-induced deathsdeclined by 1.6 percent, from 12.3 in 2008 to 12.1 in 2009. However,the final number of drug-induced deaths in 2008 or 2009 may besubstantially higher because information on cause of death in thesecases is often delayed pending investigation. Additional information
6National Vital Statistics Reports, Vol. 59, No. 4, March 16, 2011based on toxicology or autopsy reports is often not available in thepreliminary file. The age-adjusted death rate for injury at work declined10.5 percent, from 1.9 to 1.7. The observed decrease in the ageadjusted death rate for alcohol-induced deaths (1.4 percent) was notsignificant. Mortality from firearm injuries (Table 2) decreased by2.9 percent.Infant mortalityThe preliminary infant mortality rate for 2009 was 6.42 infantdeaths per 1,000 live births (Tables A and 4). This represents adecrease of 2.6 percent from the preliminary 2008 rate of 6.59. Withthe exception of 2002 and 2005, the infant mortality rate hasstatistically remained the same or decreased significantly eachsuccessive year from 1958 through 2009 (22,30). The neonatal (i.e.,infants aged less than 28 days) mortality rate decreased 1.9 percentfrom 4.27 per 1,000 live births in 2008 to 4.19 per 1,000 live births in2009, but the decrease was not significant. The postneonatal (i.e.,infants aged 28 days–11 months) mortality rate decreased by3.4 percent between 2008 and 2009.The 2009 preliminary infant mortality rate for black infants was12.71 infant deaths per 1,000 live births compared with 12.68 per 1,000live births in 2008, but the observed increase was not significant.The infant mortality rate for white infants decreased in 2009 by4.0 percent, from 5.54 infant deaths per 1,000 live births in 2008 to 5.32in 2009. The mortality rate for black infants was 2.4 times the rate forwhite infants (Tables A and 4). Because of inconsistencies in thereporting of race groups on birth and death certificates, especially forraces other than white and black and for Hispanic origin, infant mortalityrates for these groups are likely to be underestimated (25). The linkedbirth/infant death data set provides a better source of data for infantdeaths and mortality rates by maternal race and ethnicity (31).Although the infant mortality rate is the preferred indicator of therisk of dying during the first year of life, the infant death rate is alsoshown in this report. While similar, these two rates vary based ondifferences in their denominators. The denominator of the 2009 infantdeath rate is the estimated population under age 1 year as of thereference date, July 1, 2009 (14). This population estimate includes acombination of infants born in 2008 who had not reached their firstbirthday before July 1, 2009, and infants born in 2009 before July 1,2009. In contrast, the denominator of the 2009 infant mortality rate isall live births occurring during 2009 (32). For example, the preliminarynumber of live births for 2009 (n 4,131,019) is 3.1 percent lower thanthe midyear infant population in 2009 (n 4,261,494). Therefore, theinfant mortality rate for 2009 (642.1 deaths per 100,000 live births) ishigher than the infant death rate for 2009 (622.6 deaths per 100,000population). For 2009, both the infant mortality rate and the infant deathrate decreased significantly from 2008.The 10 leading causes of infant mortality for 2009 were:1. Congenital malformations, deformations and chromosomalabnormalities2. Disorders related to short gestation and low birth weight, notelsewhere classified3. Sudden infant death syndrome4. Newborn affected by maternal complications of pregnancy5. Accidents (unintentional injuries)6. Newborn affected by complications of placenta, cord andmembranes7.8.9.10.Bacterial sepsis of newbornRespiratory distress of newbornDiseases of the circulatory systemNeonatal hemorrhageThere were no differences in ranking among the leading causesof infant death between 2008 (22) and 2009 (Table 8).The infant mortality rate decreased for 2 of 10 leading causes ofdeath from 2008 to 2009 (Tables 5 and 8). The infant mortality rate forNewborn affected by maternal complications of pregnancy —the fourthleading cause of death—decreased by 7.5 percent (Tables 5 and 8).The infant mortality rate for Accidents (unintentional injuries)—the fifthleading cause of death— decreased by 8.5 percent.Deaths due to SIDS, currently the third leading cause of infantdeath, have been declining since 1988 (4,22). The observed decreasein SIDS from 53.9 to 52.5 is not statistically significant. Because SIDSdeaths often involve lengthy investigations, the mortality rate due toSIDS is typically lower based on preliminary data than that based onthe final data. Recent declines in mortality due to SIDS also may reflectprimarily a change in the way SIDS is diagnosed and reported bymedical examiners and coroners (33).References1.2.3.4.5.6.7.8.9.Anderson RN, Kochanek KD, Murphy SL. Report of final mortalitystatistics, 1995. Monthly vital statistics report; vol 45 no 11 suppl 2.Hyattsville, MD: National Center for Health Statistics. 1997. Availablefrom: http:/
such as for Assault (homicide), Intentional self-harm. U.S. DEPARTMENT OF HEALTH AND HUMAN SERVICES. Centers for Disease Control and Prevention National Center for Health Statistics National Vital Statistics System