Transcription
UWL Employee Engagement SurveySpring 2018 Survey ReportDriving positive change in the UWL work experiencePrepared by Dr. Christa Kiersch, Associate Professor of Management, UWL,with the support of the Investing in Our People Strategic Action Team
Executive SummaryThe UWL Employee Engagement Survey was conducted as part of the ‘Investing in Our People’ strategicinitiative with the purpose of assessing current employee perceptions and informing ways UWL couldimprove as an employer. The survey was administered to all current employees in March, 2018. 456employees took the survey, yielding a 32% response rate.What was measured?The survey captured employee perceptions regarding engagement (how connected and involvedemployees are with their work), satisfaction, and 6 ‘drivers of engagement’: work itself, recognition &value, support from supervisor/chair/division head, opportunities for growth & development,communication & decision-making, and well-being. In addition, the survey collected ideas regardingsolutions for increasing employee engagement. Survey results are analyzed for all employees togetheras well as by work-role and college/division. Results are also explored by demographic characteristics.Results and InsightsAn average employee engagement score of 6.10 (on a scale of 1-7) and an average general satisfactionscore of 5.45 indicate employees are engaged in and generally satisfied with their work. Yet, results onthe 6 ‘drivers of engagement’ dimensions suggest the current levels of engagement and satisfaction arenot sustainable in the long term without targeted changes to the work experience and employeetreatment. Many people are feeling overworked and undervalued, with insufficient opportunities togrow and develop professionally. This combination is likely to lead to burnout and increased turnover.Additionally, there are commonly held negative perceptions regarding communication and decisionmaking across the university, which if left unaddressed could lead to a climate of cynicism and lowerlevels of employee commitment to UWL.Recommendations for ConsiderationThese data suggest the following areas should be targeted for positive change: Fairness in communication & decision-making – especially in consistency of decisions andpolicies across employees, communication across ‘siloed’ groups and work roles, and in aligningresources with declared UWL prioritiesSupport for employee well-being – especially addressing perceived work ‘overload’ andsupporting employees in pursuing work-life balanceEnhanced professional development and growth opportunities –including both employeeskills/knowledge development initiatives (e.g., workshops, access to courses, and mentorship)and avenues for expanding one’s current role or being promoted within one’s currentunit/division2
Table of ContentsEXECUTIVE SUMMARY2ABOUT THE SURVEY4WHO PARTICIPATED?WORK ROLESCOLLEGE/DIVISIONYEARS AT UWLPERSONAL DEMOGRAPHICS55677GUIDANCE ON INTERPRETATION OF RESULTS8ENGAGEMENT RESULTS: ALL EMPLOYEESCURRENT LEVELS OF ENGAGEMENT & SATISFACTIONDRIVERS OF ENGAGEMENTDRIVERS OF ENGAGEMENT: DIMENSION LEVEL RESULTSDRIVERS OF ENGAGEMENT: ITEM LEVEL RESULTS99101112ENGAGEMENT RESULTS: COMPARISONS BY WORK ROLE AND DIVISION/COLLEGEWORK ROLE COMPARISONFACULTY/IAS APPOINTMENT COMPARISONUNIVERSITY STAFF DIVISION COMPARISON: RESULTS BY DIMENSIONDIMENSION SCORES BY COLLEGE/DIVISION1414151718ENGAGEMENT RESULTS: COMPARISONS BY DEMOGRAPHIC CHARACTERISTICSRESULTS BY YEARS AT UWLRESULTS BY SUPERVISOR DESIGNATIONADDITIONAL DEMOGRAPHIC COMPARISONS19192021ENGAGING SOLUTIONSSOLUTION RANKINGS: ALL EMPLOYEESSOLUTION RANKINGS BY WORK ROLEEMPLOYEE CONFIDENCE IN POSITIVE ACTION POST-SURVEY22222424KEY TAKEAWAYSWHAT IS THE CURRENT STATE OF EMPLOYEE ENGAGEMENT AND WORK-RELATED ATTITUDES?WHAT DO RESULTS SUGGEST REGARDING WHAT TO DO NEXT?242425CONCLUSION25CONTACT INFORMATION26REFERENCES27ADDITIONAL RESOURCES27APPENDIX A: EMPLOYEE GROUPS WITHIN EACH COLLEGE/DIVISION28APPENDIX B: RESULTS BY ITEM, WORK ROLE COMPARISON293
About the SurveyAs part of the UWL strategic initiative to ‘Invest in our People’, a survey of employee satisfaction andengagement was conducted in March 2018. The purpose of this survey was two-fold:1. To assess the current state of employee engagement and work-related attitudes2. To inform actionable change that positively impacts employees’ experiences, engagement,and job satisfactionEmployee engagement refers to the connection employees feel with their jobs; how investedemployees feel in the success of their work teams and UWL more broadly. Research has found thatengaged employees get more satisfaction and fulfillment from their work, are less likely to quit, and aremore likely to ‘give their all’ at their jobs (see Byrne et al., 2011; Cook, 2008; Harter et al., 2009; Rich etal., 2010).In addition to asking questions in order to evaluate current levels of engagement and satisfaction ofUWL employees, we also asked questions about 6 ‘drivers of engagement’ (perceptions andexperiences that research has shown to impact engagement) and ideal ‘engagement solutions’(employee ideas on programs or initiatives that they believed would positively impact their ownengagement at work).The survey was built based on a review of the existing employee engagement research and publiclyavailable survey measures related to employee engagement. The systematic survey developmentprocess and initial analysis of the item/dimension properties support the internal reliability andconstruct validity of the survey measure (Devellis, 2003). A copy of the original survey as well as moreinformation about the psychometric properties of the survey, including preliminary reliability andvalidity support, are available upon request.The survey consisted of 68 total items: 14 items assessing employee engagement and satisfaction, 41items assessing the 6 drivers of engagement, 5 items assessing employee ideas for engagementsolutions, and 8 demographic items. The survey took about 10 minutes to complete. The survey wasadministered online within Qualtrics, with a unique link to the survey emailed to each UWL employee(preventing any employee from taking the survey more than once). The survey was open March 6-23,and 1 reminder email was sent to employees who had not yet completed the survey 1 week prior to theclose date. Distribution of the survey was approved by the UWL Institutional Review Board for theProtection of Human Subjects.4
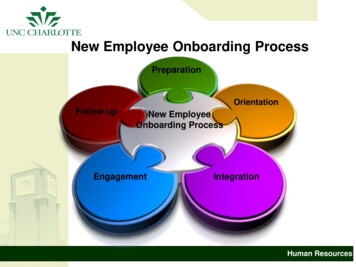
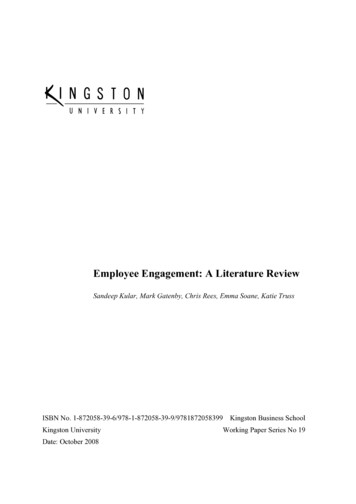
Who Participated?The survey was sent to all 1419 UWL employees (current as of March 1, 2018). 456 employees took thesurvey, yielding a 32% participation rate.Work Roles421 participants provided information on their work roles. Distribution of work roles across participantsclosely resembles the distribution of all employees at UWL, with the exception of graduate/teachingassistants (who are underrepresented in the survey). Across all work role categories, 25% of participantshold a supervisor position.Work Role# ParticipantsAcademic StaffFaculty/IASUniversity StaffGraduate/Teaching Assistants1148171957# 7%29.7%7.1%Participants by Work RoleAcademic StaffFaculty/IASUniversity StaffGraduate/Teaching Assitant2%22%35%41%Faculty/IAS byAppointmentUniversity Staff byDivisionIAS23%50%127%18% pport67%TenuredAs this participant group was under 10, it was not included in work role comparisons.5Facilities/Maintenance
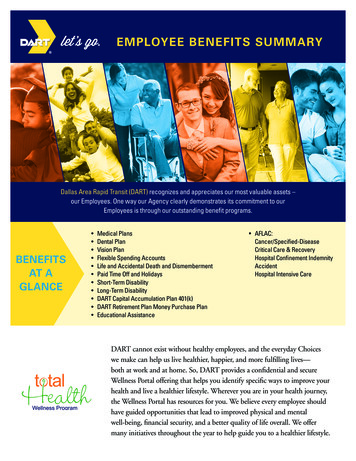
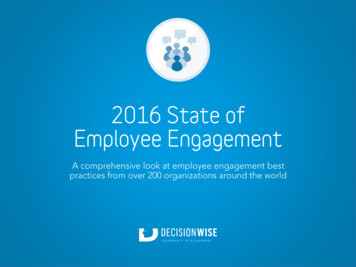
College/Division392 participants indicated their college or division. Additional information regarding which employeegroups are represented by each college/division title is provided in Appendix A. CLS (including the Schoolof Arts and Communication) had the most employees participate, followed by CSH and Student Affairs.CBACLS, with School of Arts & CommunicationCSHSchool of EducationAcademic Affairs & Provost UnitsAdministration & FinanceUniversity AdvancementStudent AffairsDiversity & InclusionOther0102030405060708090# ParticipantsThe distribution of participants across college/division somewhat resembles the distribution of allemployees (keeping in mind that not all participants indicated their college/division). Specific groupswho are relatively under-represented in the survey data are School of Education and Administration &Finance. Specific groups who are relatively over-represented in the survey are Academic Affairs &Provost Units, Diversity & Inclusion, and University Advancement.College/Division# ParticipantsCBACLS, with School of Arts & CommunicationCSHSchool of EducationAcademic Affairs & Provost UnitsAdministration & FinanceUniversity AdvancementStudent AffairsDiversity & InclusionOther2224837811484214581618# %--Chancellor’s division is included in the ‘Other’ category as the number of employees in this group is under 10.6
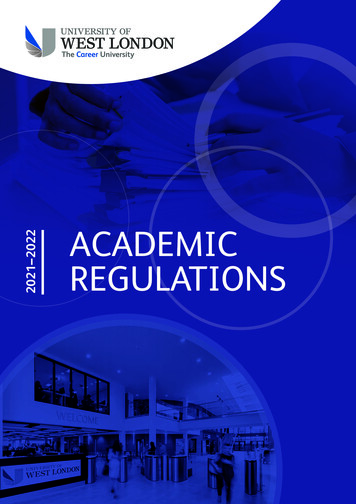
Years at UWL406 participants indicated how many years they had worked at UWL. The majority (67%) of participantswho provided this information have worked at UWL for 10 years or less.14032%# Participants12026%100806012%10%11%16-20 years21 or moreyears8%40200less than 1 year1-4 years5-10 years11-15 yearsPersonal Demographics356 participants indicated their age category, 353 indicated gender, and 375 indicated racial/ethnicidentity. Based on this data, participants represent a wide range of ages, the majority (67%) identify asfemale, and the overwhelming majority (95%) identify as White.Participant Age12027%# Participants10028%Participant Gender30%14%806014%14%28%4058%20021-3031-4041-5051 Prefer notto answerFemaleMalePrefer not to answer or provided other answer7
Guidance on Interpretation of ResultsFor all engagement, satisfaction, and drivers of engagement items and dimensions, scores are providedon a scale of 1 to 7, where 7 is highest/most positive rating, 1 is the lowest/most negative rating, and 4indicates a neutral rating. Any alternative response scales are noted within the SomewhatDisagreeNeitherAgree norDisagreeSomewhatAgreeAgreeStronglyAgreeIn all results sections, mean scores are provided along with a standard deviation (SD) for that meanscore. Mean scores represent the mathematical average response. Standard deviations are an indicationof the amount of variation in responses, with higher values indicating more individual-level variation andlower values indicating more agreement across employees. A general rule of thumb suggestsapproximately 66% of responses fall within 1 SD above and below the mean response for eachitem/dimension.When color coding is used in results tables, red shading indicates negative perceptions ( 4.0), yellowindicates somewhat neutral perceptions (4-4.9), white/gray shading indicates moderately positiveperceptions (5-5.9) and green shading indicates more strongly positive perceptions ( ly PositivePerceptions8Strongly PositivePerceptions
Engagement Results: All EmployeesIn this initial section of survey results, data for all employees are examined holistically and provideinsight into employee perceptions campus-wide. Mean scores for all employees on each dimension andalso on each item indicate areas of strength and opportunities for improvement for UWL as anemployer, regardless of employee work role, college, or division. Results are presented first forengagement and satisfaction, and then for the 6 drivers of engagement examined in the survey.Current Levels of Engagement & SatisfactionAcross all employees who completed the survey, the average engagement score is 6.10 and the averagesatisfaction score is 5.45. This indicates that generally speaking UWL employees are engaged in theirwork and have moderately high levels of overall satisfaction. UWL employees are more engaged intheir work than they are satisfied with their jobs and UWL as an employer. There is also considerablymore variation in employee satisfaction than there is with Neutral4.6%11.5%Positive94.1%76.7%Mean (SD)6.10 (.74)5.45 (1.21)Engagement ItemsThe following item-level results provide more depth into current employee engagement levels. Theseitems are meant to capture the more emotional aspects of engagement (feeling inspired and excitedabout one’s work), the more physical aspects of engagement (putting a lot of effort and energy intoone’s work), and the more cognitive aspects of engagement (being completely focused and attentive toone’s work).Item TextMy job inspires me.I am excited about my job.I am proud of the work I do.I find my work interesting.I try my hardest to perform my job well.I devote a lot of energy to my job.I put my full effort into my job.At work, I focus a great deal of attention on my job.At work, my mind is focused on my job.At work, I am absorbed by my D1.371.390.911.060.760.820.780.830.951.17
Satisfaction ItemsThe following item-level results provide more depth into current employee satisfaction levels. Theseitems are meant to capture employees’ general satisfaction with their jobs and with UWL as anemployer. While all items indicate moderate levels of satisfaction, it is noteworthy that these resultsindicate not all employees would recommend UWL to others as a good place to work.Item TextOverall, I am very satisfied with my job.In general, I don't like my job. (reverse-coded)In general, I like working at UWL.I would recommend UWL to others as a good place to work.Mean5.325.685.595.22SD1.471.411.281.49Drivers of EngagementIn addition to assessing overall employee engagement and satisfaction, this survey captured employeeperceptions regarding 6 established precursors of engagement and satisfaction – 6 ‘drivers ofengagement’. These 6 dimensions, and the items within them, allow us to have a more accurate andfine-grained understanding of employee experiences at UWL and ultimately can inform opportunitiesfor positive change.1. The Work Itself Having work that is clear, interesting, and autonomous2. Recognition & Value Feeling appreciated and valued by UWL as an employer3. Support from Feeling appreciated and supported by one's directSupervisor/Chair/ Division Head supervisor, chair, or division head4. Growth & Development Seeing adequate opportunities for professional growth5. Communication & DecisionMaking Perceiving fair processes for decision-making across UWLand in one's 'unit'6. Well-Being Believing that UWL supports employee well-being in policyand daily practice10
Drivers of Engagement: Dimension Level ResultsDimensionWork ItselfRecognition & ValueSupport from Supervisor/Chair/Division HeadOpportunities for Growth & DevelopmentCommunication & .57SD1.141.161.471.421.351.32Scores on the drivers of engagement are noticeably lower than scores on engagement and satisfaction,with 4 of the 6 dimensions yielding mean scores considered to be in the ‘neutral’ range and nodimensions yielding a mean score considered ‘strongly positive’. The standard deviations across all 6dimensions are also fairly high given the 7-point scale, indicating there is considerable variation acrossemployees for each driver of engagement.Dimension Scores: All EmployeesWork tion/DMWell-Being123114567
Drivers of Engagement: Item Level Results‘Drivers of Engagement’ scores for all employees, by item, are presented in the following tables. Thecolored shading of scores may serve to indicate current areas of relative strength and potential problemareas, campus-wide. Following the patterns apparent in dimension-level results, the majority of negativeand neutral item-level responses occur within communication & decision-making, well-being, andgrowth & development. In addition, one item within the recognition & value dimension yieldedmarkedly negative responses (on average).The Work ItselfItem TextWorking at UWL, I have the opportunity to do what I do best every day.I have appropriately stimulating and challenging work.I know what is expected of me at work.I have the authority to do my job as I see fit.I have freedom in how I accomplish my work objectives.Recognition & ValueItem TextThe mission of UWL makes me feel my job is important.I feel very useful in my job.Doing my job well really makes a difference.I feel like a key member of UWL.The work I do is very valuable to UWL.I rarely feel my work is taken for granted.UWL recognizes the significance of the contributions I make.In the past month, I have received praise and recognition for a job D1.471.621.571.501.56Support from Supervisor/Chair/Division HeadItem TextMy [supervisor] generally appreciates the way I do my job.My [supervisor] makes me feel my contributions are valued.My [supervisor] is supportive of my ideas and ways of getting things done.My [supervisor] backs me up on decisions I make at work.My [supervisor] recognizes the value of my work.12
Growth & DevelopmentItem TextIn the last 6 months, someone at work has talked to me about my owndevelopment.I have opportunities to learn and grow at work.I feel that UWL encourages my development.I receive appropriate training and development to help me do my jobwell.There are sufficient opportunities to network and learn from one anotherat UWL.I am excited about the opportunities for professional growth I have 731.671.811.711.531.713.881.703.811.66Item TextUWL promotes the health and well-being of employees.I am happy with my work-life balance.UWL has appropriate family-friendly policies.UWL really cares about my well-being.I am not overloaded with work to do.I have the appropriate resources to do my job well.I feel supported by others at 41.572.011.761.52I rarely feel required to do tasks that fall outside of my formal jobresponsibilities.4.351.93Communication & Decision-MakingItem TextAt UWL, my opinions seem to count.I feel appropriately involved in decision making at work.I feel comfortable voicing my ideas in meetings.Decisions and policies at UWL are applied consistently across employees.Explanations for decisions and policies at UWL seem reasonable.I am treated with respect at work.There is good communication between faculty, staff, and administrationat UWL.UWL allocates appropriate budgetary resources toward achievingimportant objectives.UWL allocates appropriate staff resources toward achieving importantobjectives.Well-Being13
Engagement Results: Comparisons by Work Role and Division/CollegeIn this section, dimension scores for engagement, satisfaction, and the 6 drivers of engagement areexamined by work role and then by division/college3. In the work role comparison for all employees, thethree groups compared are Faculty/Instructional Academic Staff (IAS), Academic Staff, and UniversityStaff. Faculty/IAS are then further divided into 3 appointments: IAS, Tenure-Track Faculty, and TenuredFaculty. University Staff are then also divided into 3 divisions: Facilities/Maintenance Staff, ProfessionalStaff, and Administrative Support Staff. Finally, all employees are examined by comparing across 10divisions and colleges.Work Role ComparisonA comparison of dimension scores for all employees by work role categorization reveals statisticallysignificant differences for all dimensions except ‘Support from Supervisor/Chair/Division head’ indicatingthat there may be fundamentally different employee experiences based on work role. Across alldimensions, Academic Staff reported the most positive employee perceptions, most often followed byFaculty/IAS, with University Staff reporting the most negative employee perceptions in all dimensionsexcept ‘Well-Being’. These results are presented in the table below and graph on the following page.DimensionEngagement*Satisfaction*Work Itself*Recognition & Value*Support from Supervisor/Chair/Division HeadOpportunities for Growth & Development*Communication & Decision-Making*Well-Being**differences between group scores are statistically significant3Faculty/IAS6.18 (.65)5.26 (1.34)5.38 (1.21)4.58 (1.19)5.54 (1.45)4.71 (1.36)4.12 (1.35)4.10 (1.32)Please refer to Appendix B for a comparison of item-level scores by work role.14AcademicStaff6.24 (.60)5.78 (.99)5.74 (.94)5.28 (1.00)5.76 (1.47)4.82 (1.32)4.54 (1.24)4.94 (1.20)UniversityStaff5.85 (.71)5.42 (1.12)5.21 (1.08)4.82 (1.13)5.69 (1.36)4.22 (1.52)4.08 (1.35)4.86 (1.22)
The following graph provides another visualization of the differences in dimension scores by work role.Dimension Scores by Work RoleEngagementSatisfactionWork tion/DMWell-Being12University Staff34Academic Staff567Faculty/IASFaculty/IAS Appointment ComparisonWithin the Faculty/IAS work role category, dimension scores for the 3 appointments are compared.While there are noticeable patterns in the data, please note that none of the differences werestatistically significant (indicating that while scores vary by position, they vary at least as much at anindividual level, within a given position). Still, tenured faculty tend to have the lowest scores in terms ofengagement and satisfaction, as well as the lowest average scores on 4 of the 6 drivers of engagement(the work itself, value/recognition, opportunities for development, communication and decisionmaking). IAS had the lowest average score in terms of perceived support from department chairs, andtenure-track faculty had the lowest average score in terms of well-being. These results are presented inthe table and graph on the following page.15
DimensionIASEngagementSatisfactionWork ItselfRecognition & ValueSupport from Supervisor/Chair/Division HeadOpportunities for Growth & DevelopmentCommunication & Decision-MakingWell-BeingTenureTrack6.27 (.51)5.22 (1.45)5.37 (1.24)4.59 (1.08)5.70 (1.30)4.92 (1.37)4.13 (1.29)3.91 (1.31)6.28 (.54)5.48 (1.30)5.54 (1.25)4.73 (1.13)5.36 (1.65)4.71 (1.48)4.24 (1.34)4.48 (1.40)Tenured6.09 (.76)5.15 (1.32)5.31 (1.21)4.49 (1.30)5.51 (1.44)4.63 (1.31)4.05 (1.42)4.01 (1.27)differences between group scores are not statistically significant for any dimensionDimension Scores by Faculty/IAS AppointmentEngagementSatisfactionWork tion/DMWell-Being012Tenured34Tenure-TrackIAS16567
University Staff Division Comparison: Results by DimensionWithin the University Staff work role category, dimension scores for the 3 divisions are compared.Interpretation of this data should include the caveat that the strong majority of University Staffparticipants were Administrative Support Staff, with noticeably lower numbers of Professional ServicesStaff and Facilities/Maintenance Staff. Still, even with such discrepancy of sample size, there arenoteworthy patterns in the results and some group differences are statistically significant. Specifically,Administrative Support Staff have the most negative experiences across dimensions, followed byFacilities/Maintenance Staff (with the exception of well-being, for which Facilities/Maintenance Staffhave the most positive responses.) Professional Services Staff seem to have the highest levels ofengagement and satisfaction and also the most positive experiences regarding the drivers ofengagement and satisfaction (with the exception of well-being).DimensionProfessionalServices6.08 (.76)5.87 (.54)5.71 (.96)5.15 (.97)5.86 (.73)EngagementSatisfactionWork ItselfRecognition & ValueSupport from Supervisor/Chair/Division HeadOpportunities for Growth & Development*5.14 (1.09)Communication & Decision-Making*4.95 (1.05)Well-Being5.00 (1.27)*differences between group scores are statistically significantAdmin.Support5.89 (.67)5.30 (1.09)5.03 (1.08)4.72 (1.07)5.65 (1.46)FacilitiesMaint.5.84 (.89)5.45 (1.57)5.34 (1.12)4.80 (1.47)5.73 (1.49)3.94 (1.52)3.85 (1.23)4.72 (1.19)4.47 (1.74)4.11 (1.78)5.17 (1.25)Dimension Scores by University Staff DivisionEngagementSatisfactionWork tion/DMWell-Being12Facilities Maintenance34Administrative Support1756Professional Services7
Dimension Scores by College/DivisionResults for all employees are compared according to participant college/division. Noteworthy patterns from this analysis include the relativelynegative perceptions held by employees working in the CBA, School of Education, and Diversity & Inclusion as well as the relatively positiveperceptions held by employees in Academic Affairs & Provost Units, Administration & Finance, and University Advancement.DimensionCBACLSCSHSchool ofEd.Admin. &FinanceUniv.AdvancementStudentAffairsDiversity &InclusionOther6.04 (.79)AcademicAffairs &ProvostUnits6.03 (.76)Engagement6.06 (.62)6.19 (.70)6.24 (.54)6.07 (.57)6.14 (.65)6.19 (.66)5.83 (.69)6.13 (.70)Satisfaction4.76 (1.55)5.51 (1.15)5.43 (1.25)4.73 (1.76)5.85 (.76)5.83 (1.06)5.73 (1.11)5.63 (1.11)5.37 (.80)5.29 (1.34)Work Itself5.03 (1.35)5.46 (1.24)5.51 (1.04)4.75 (1.78)5.79 (.79)5.55 (.87)5.41 (1.15)5.56 (1.06)5.18 (1.08)5.58 (1.12)Recognition & Value4.30 (1.07)4.79 (1.24)4.73 (1.06)4.26 (1.53)5.47 (1.04)5.23 (.97)5.22 (1.10)4.92 (1.19)4.60 (.85)5.07 (1.12)Support fromSupervisor/Chair/Division HeadOpportunities forGrowth &DevelopmentCommunication &Decision-Making5.36 (1.70)5.82 (1.26)5.63 (1.39)4.29 (2.46)6.15 (.93)5.61 (1.18)5.66 (1.67)5.64 (1.51)5.44 (1.70)4.61 (2.18)4.20 (1.48)4.70 (1.46)4.80 (1.18)4.05 (2.01)4.89 (1.23)4.88 (1.32)5.12 (1.18)4.66 (1.28)3.67 (1.48)4.31 (1.93)3.30 (1.39)4.35 (1.33)4.32 (1.25)3.89 (1.68)4.66 (1.07)4.62 (1.38)4.62 (1.40)4.42 (1.15)3.52 (1.24)4.06 (1.74)Well-Being3.88 (1.30)4.25 (1.27)4.50 (1.38)3.74 (1.90)5.09 (1.10)5.20 (1.11)4.77 (1.26)4.67 (1.10)4.41 (1.22)4.99 (1.31)18
Engagement Results: Comparisons by Demographic CharacteristicsIn the following section dimension scores for engagement, satisfaction, and drivers of engagement areexplored according to additional employee demographics including years at UWL, supervisordesignation, age, and gender. Although the survey collected information on racial/ethnic identity, therewas insufficient representation of non-white respondents to allow for confidential analysis. Similarly,although participants indicated if they were full-time or part-time there was not sufficientrepresentation of part-time employees to allow for accurate and meaningful comparison of scoresacross the two groups. Approximately 10%-20% of participants elected not to answer each of thedemographic questions (and were thus excluded from these results).Results by Years at UWLPlotting engagement and satisfaction scores by years at UWL, the results suggest that while there arenot statistically significant differences, generally speaking the newest employees are among the mostsatisfied and among the least engaged. Employees with 21 years at UWL report the highest levels ofengagement.Engagement & Satisfaciton by Years at UWL6.565.554.543.5 1 yr1-4 yrs5-10 yrsengagement11-15 yrs16-20 yrs21 yrssatisfactionAn examination of the drivers of engagement by years at UWL highlights a fairly consistent pattern, inthat the newest employees often have among the most positive perceptions, perceptions tend to getmore negative through the 5-10-year mark, and then more positive for employees who have been atUWL for more than 10 years. The differences by group were statistically significant forcommunication/decision-making and well-being.19
Drivers of Engagement by Years at UWL6.565.554.543.5 1 yr1-4 yrs5-10 yrs11-15 yrs16-20 yrs21 yrsWork tion/DMWell-BeingResults by Supervisor DesignationIn comparing dimension scores for supervisors and non-supervisors, a very clear trend emerges from thedata. Generally speaking, supervisors are more engaged and satisfied than non-supervisors andsupervisors have more positive experiences regarding the drivers of engagement than non-supervisorswith one noteworthy exception of well-being. Supervisors actually tend to have lower levels of wellbeing perceptions than non-supervisors (although this difference is not statistically significant).Dimension Scores by Supervisor DesignationEngagementSatisfactionWork tion/DMWell-Being1234Non-Supervisor20Supervisor567
DimensionSupervisorEngagementSatisfactionWork ItselfRecognition & Value*Support from Supervisor/Chair/Division HeadOpportunities for Growth & DevelopmentCommunication & Decision-Making*Well-Being*differences between group scores are statistically significant6.22 (.64)5.63 (1.02)5.62 (1.03)5.13 (1.20)5.84 (1.19)4.65 (1.26)4.50 (1.21)4.54 (1.24)NonSupervisor6.09 (.67)5.46 (1.22)5.42 (1.13)4.81 (1.12)5.57 (1.53)4.64 (1.45)4.20 (1.34)4.62 (1.31)Additional Demographic ComparisonsA comparison of scores for participants who identified as male and female revealed no difference basedon gender, with scores differing by close to 0.1 for most dimensions and no differences evenapproaching statistical significance. It is worth considering in the gender-based results, though, that alarge number of participants did not identify as male or female (most indicating they preferred not toanswer the question) and thus the results are limited to only those who provided this information.While there does seem to be some difference in perceptions by age, the pattern of results varies bydimension and differences are largely not statistically significant. The two dimensions that do yieldstatistically significant differences by age are opportunities for development and well-being. Generallyspeaking, younger employees have mo
The survey captured employee perceptions regarding engagement (how connected and involved employees are with their work), satisfaction, and 6 'drivers of engagement': work itself, recognition & value, support from supervisor/chair/division head, opportunities for growth & development, communication & decision-making, and well-being. In .