Transcription
Investor UpdateJuly 2022
Contents01Overview021Q2022 Performance03Strategy04Outlook05Supplementary Information1
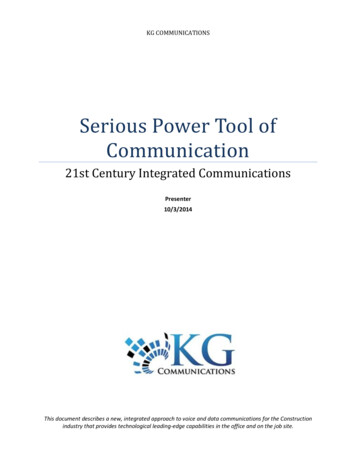
Oil Balance Thailand: Jan – Mar 2022Adequate refining capacity maintains the stability of country supplyDemandProductionSupplyDomesticImport (88%)1032 KBDImported Refined Petroleum Products 60 KBDCrude/Condensate972 KBDIndigenous (12%)146 KBDCrude/Condensate130 KBDTotal Refining Capacity in Thailand:1,242 KBDRefinedProducts1,054 KBD*957 KBDPTT’s Associated Refineries : 770 KBD(TOP, PTTGC, IRPC)RefinedProducts165 KBD(**)ExportOther Refineries : 472 KBD(SPRC, ESSO, BCP)Crude Export 16 KBDSource: PTITRemark :181 KBD(*)Refined product from refineries 971 KBD, including domestic supply of LPG from GSPs and Petrochemical Plants 83 KBD(**) Included InventoryKBD Thousand Barrels per day2
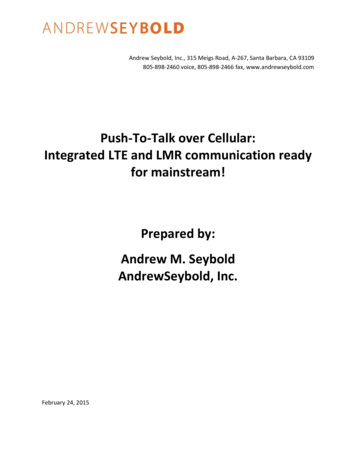
Natural Gas Balance: Jan – Mar 2022Main driver of the Thai Gulf of Thailand CFDGas Separation Plant846 MMSCFD(19%)PTTEP,49%6 GSPsTotal Capacity2,870 MMSCFD @ Actual HeatOnshore (2%)LPG/NGLIndustryHouseholdTransportation(7%)108 MMSCFDBypass Gas171 MMSCFDImport (45%)Myanmar,37%1,950 MMSCFDMethane1,329 MMSCFDPower (60%)Industry(18%)NGV (3%)LNG,63%Remark: MMSCFD Million Cubic Feet @ Heating Value 1,000 Btu/ft33
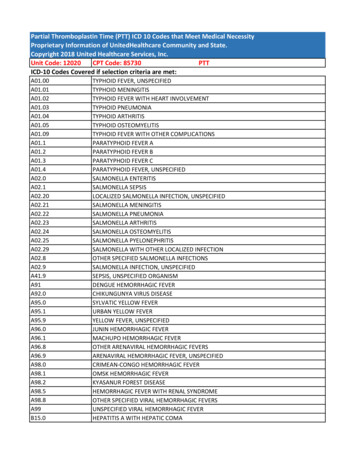
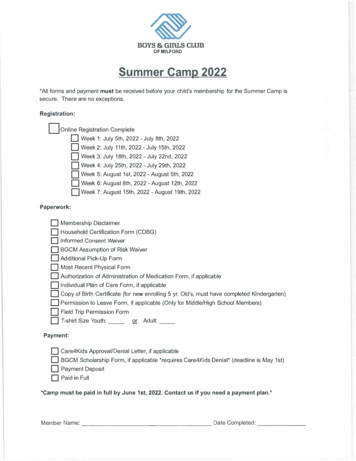
PTT’s Strategic Importance to ThailandMarket Cap : SET & PTT GroupSET market Cap:Bt 18,735 bn (USD 528 Bn*)PTT Group13%87%Note: As of Mar 4, 2022PTT Group: Note: As of Jun 30, 2022Bt 2,484 bn (USD 70 Bn*)GPSCIRPC 3%7%TOP 4%PTTGCOthersMinistry of Finance holds majority stake in PTTORGGC1%Public 37% Foreign 9% Thai28%PTT39%8%12%Vayupak Fund12%26%*As of Jun 30, 2022, BOT selling rate USD/THB of 35.46 (End rate)PTTEPRobust revenue and net income growth since IPO (MMUSD) 170,2593,371RevenueNet Income81%20012021 Annual, BOT selling rate USD/THB of 32.15 (Avg. rate)200131% PTT 2020International E&P business: 1,350 mmboe proved reserves or 7.5 years in 2021Sole operator & owner of gas transmission pipelines and Gas Separation Plants(GSPs) in ThailandLargest refinery group in Thailand : 3 of 6 refineriesLargest petrochemical producer group in Thailand : total capacity of olefins, aromaticsand styrenics production of more than 16 mtpaLeading oil marketing business in Thailand : 2,085 retail stations2 and 44%2 ofmarket share by sales volumeInternational oil trading business having traded 79.1 bn litters in 2021Power Plant flagship with equity power capacity of 7,168 MW22As of Mar 2022BBB BBB BBB PTT – LCBaa1BBB BBB 2021International and local recognitionFully integrated & highly diversified over entire O&G value chain BBB PTT – FCBaa1Baa1FC69% Affiliate70219%1PTT ratings at Thai sovereign level19%12,553Thai Ministry of Finance51%234th in 2021170th in 2020165th in 2019156th in 2018190th in 2017337th in 2016Platts Top 250 GlobalEnergy Company45rd in 202123rd in 202021st in 201910th in 201812th in 201763th in 2016Fortune Global 500206th in 2021140th in 2020130th in 2019163th in 2018192th in 2017146th in 201693th in 2015Dow Jones SustainabilityIndex (DJSI)DJSI Member 2011-2021(10th consecutive years)4
PTT Group Businesses and ActivitiesPTT Own Businesses(PTT’s own operation)Upward Integration(PTT Operate through our subsidiaries)Downward Integration(PTT Operate through our subsidiaries)Natural GasE&P- Oil, Gas, Condensate- 40 Projects in 15Countries- 1,350 mmboe provedreserves or 7.5 years in2021(100%)1 (75%) 4 gas pipelines 6 Gas Separation Plants Procurement &Marketing NGV(65.29%)LNGOil & RetailMarket Share 44%2Refineries( 48%)TradingMarket Share 50%-Largest refinery group inThailand : 3 of 6 refineriesCrude ProcurementImport/ExportCommodity HedgingInt’l Office: China/Singapore/ Abu Dhabi/London/ USA/ Thailand Traded 79.1 bn liters (100%)LNG Value ChainLNG Receiving FacilitiesCoalPetrochemicals( 48%)Market Share 50%- Integrated Refineries &PetrochemicalNew Business and InfrastructureCoal Mine inIndonesiaNew Business(In process for divestment) Renewable Energy EV ChainBeyond Energy Life Sciences AI RoboticsPower( 75%3) Innovation & New business Engineering & Infrastructure Innovation Institute(100%)Future Energy(100%)(100%) - Oil (2,085 stations in Thailand1)- Non-oil Retail- Lubricants- International Oil & Retail(100%)7,168 MW1 (equity portion)- Electricity- Steam & Chill Water- Energy StoragePTT Group’s renewable energy portfolio is 2.75 GW2(50%)(100%)PharmaceuticalMedical deviceNutrition( 75%)(60%)(51%)(75%)- EV Service platform & Electric Vehicles/ Batteries- 104 EV Charging stations( 75%)Direct & indirect target 37%4JV with IRPC (PTT 40 : IRPC 60)JV with NRF (50:50) AI / Robotics(50%) Cloud service, Data center(100%) Digital platform(100%)Remark: Percentage holding as of Mar 20221Increasestakes to 100% in June 2022 / 2 As of Mar 2022 /3Holding portion of PTT Group (direct & indirect) / 4 Target stakes (start to recognize income since Apr 2022)(100%)5
Contents01Overview021Q2022 Performance03Strategy04Outlook05Supplementary Information6
Key Activities in 1Q2022Core BusinessesRestructuring of Power Business byacquiring additional stakes fromTOP ( 10.78%)Restructuring PTTGL to be 100%owned by PTT’s subsidiary (SMH)A cap of NGV price at 15.59 baht/kg forprivate and other vehicles and 13.62 baht/kgfor taxi until 15 Sep 22PTTEP-Signing of Gas, Condensateand Crude Sale Agreement of G1/61and G2/61 ProjectsChanging of the Operator of YadanaProject in Myanmar to PTTEP(37.0842% participating interest)Awarding of Malaysia exploration block SB412Future Energy & BeyondArun Plus JV (51%) with GPSC to establish“Nuovo Plus” to support batterybusiness value chainJV (60%) with FOXCONN to establish“Horizon Plus” to operate the electricvehicle manufacturing business(FID in April 2022)Arun Plus and Contemporary AmperexTechnology (CATL) announced a strategiccollaboration in battery businessCompleted to acquire additional stakes in LotusPharmaceutical and investment in Adalvo,stakes increased to 37% and 60%, respectively.Profit contribution started in 2Q22Divestment of shares in Ichinoseki Solar Power 1 GKAcquisition of 25% stakes in the ConcessionArea C exploration block in UAEIssuance and Offering of 275,120,000 Newly Issued Shares7
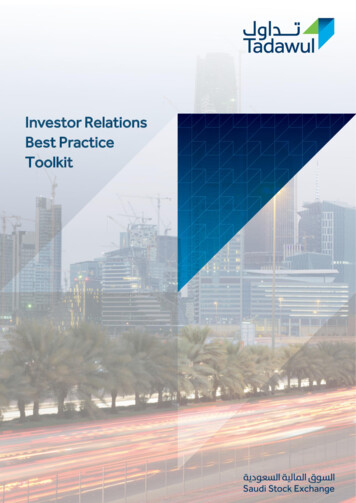
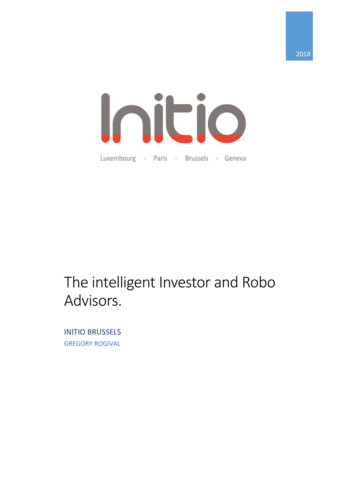
Key Business Drivers:Most of petroleum and petrochemical prices escalated due to demand recovery and impact from Russia-Ukraine tensionAVG. Petroleum Prices ( /bbl)AVG. NG Prices ( /MMBTU)DubaiQoQYoY120FO 0.628.92056.644.140.461.1111.1FO (3.5%) 40102.8 33676% 100%85%30.728.0 JKM 510.25.896.366.8410.908.14JLC-LNG**Avg. Pooledgas price* JKM Japan Korea Marker **JLC Japan LNG Cocktail : Landed LNG price in JapanJan-211Q21Apr-212Q21Jul-213Q21 Oct-214Q21Jan-22Apr-221Q22 Apr’221,3359669939459198936764Q21 (end FX 33.6)End: Baht Appre.Bt 0.5 or 1.5%351,2501,138606YoYAVG. FX 36513001000PX22%42%13%2071.52021 Dubai avg.: 69.2HDPE6%16%10%18.6AVG. Petrochemical Prices ( /ton)PP4%2%QoQ87.268.3Avg. Pool30Jan-201Q20 Apr-202Q20 Jul-203Q20 Oct-20 4Q20Jan-211Q21 Apr-212Q21 Jul-21 3Q21 Oct-214Q21 Jan-221Q22 Apr-22Apr’22QoQYoYJKM*35.1102020 Dubai avg.: 42.2066.9JLC-LNG**501,2527451,3871,3301,0871,420 HDPE1,418 PP341,180 PX1,147 BZ33321,0738771Q21 (end FX 31.5)End: Baht Depre.Bt 1.3 or 4.3%Jan-201Q20 Apr-202Q20 Jul-203Q20 Oct-204Q20 Jan-211Q21 Apr-212Q21 Jul-213Q21 Oct-214Q21 Jan-221Q22 Apr-22Apr’2234.033.232.131.531.5903 Naphtha397274Note: Figures are average & Naphtha (MOP’J)33.133.61Q22 (end FX 33.5)End: Baht Appre.Bt 0.1 or 214Q211Q22 Apr’2288
PTT Consolidated Performance: 1Q2022 & 2021QoQ: Soften NI mainly from higher loss on derivatives despite strong operating performance resulted from demand and product prices’ recovery2021 vs 2020: Robust performance as a result of global petroleum & petrochemical prices and demands recoveryREVENUE40%10% QoQUnit: MB2,258,81859% YoYEBITDA41% QoQUnit: MB39% YoY90%1Q21225,672102,997 101,2711Q2220202021Others4/NBI3/ 1% E & POil & Retail15%2% 6%1Q214Q21Oil & I5/EBITDA28%E&POil ,363 MBP&R3%Trading2/Remark:1/ PTT Gas business and affiliates2/ PTT Trading business and affiliates3/ New Business and Infrastructure mainly contributed from power business4/ Others business mainly contributed from coal business38%13%427,956 MB33%2020Others6/1%13%P&R37,7662021NBI3/ Others4/2,258,818 MBP&R142,7015% 5%Gas1/REVENUE30%108,363427,956688,837 758,4654Q21 100%7% QoQ22% YoYUnit: MB1,615,665477,837NI21%31%PTT(GAS & Trading)Remark:5/ New Business and Infrastructure mainly contributed from power business6/ Others business mainly contributed from PTT LNG, PTT NGD, PTTT and PTTGM etc.9
1Q22 vs 4Q21 PTT Consolidated Performance (QoQ):Extra Items*NI decreased from higher loss on derivatives despite improved margin and higherstock gain27,54434,475MMTHB25,571(*PTT’s portion net tax amount)1Q22 : PTT’s discounted benefit from gas production shortfall 700MB and gain from Ichinoiseki share divestment of GPSC 350 MB4Q21 : Impairment loss -7,000 MB (PTTEP’s Mozambique andYetagun projects, PTT’s NGV, and GC’s US project): Other items 100MB mainly from PTT: Take or pay of Myanmar gas returned to gov. -2,700 MBoffset with gas discount from production shortfall 1,700 MB Gain on disposal of gas pipeline in Egypt 1,400 MBOthers- Coal: Decreased in sales volume and higher loss on derivatives PTTT: Increased from higher spread marginNBI (mainly from power)- Lower GPSC’s performance from increased gas and coal cost24,642Oil & Retail Oil: Increased from both of sales volume and margin due to easingof lockdown- Non-oil: Performance dropped from soften food and beverage salesPetrochemical & Refining- Higher derivatives loss despite improved operating profitExtra 100%ItemsOthers/1 44% 99%NBI/2Oil &Retails 70% 11%P&RPTTEPPTT1Q224Q21Remark:1/ Others business mainly contributed from PTT LNG, PTT NGD, PTTT and PTTGM etc.2/ New Business and Infrastructure business mainly contributed from power businessRefinery Higher stock gain and Mkt GRM due to improved product pricesand spreadsPetrochemical- Feed cost increased more than selling pricesPTTEP 38%- Loss from oil price hedging following upward oil price trend Higher avg. selling prices from higher liquid prices Sales volume increased from Arthit and Zawtika project 35%PTT- Higher loss on DerivativesGas GSP: Higher avg. selling prices and sales vol.- S&M: Higher pooled gas cost despite higher overall gas salesvolume- NGV: Higher gas cost while selling prices were capped-TradingMargin dropped from mark-to market loss Sales volume increased10
(*PTT’s portion net tax amount)Extra Items*1Q22 : PTT’s discounted benefit from production shortfall 700 MB and GPSC’s gain on Ichinoseki SolarPower 1 GK divestment 350 MB1Q22 vs 1Q21 PTT Consolidated Performance (YoY):Lower NI from higher loss on derivative despite better margin and stock gain1Q21 : EP’s gain on bargain purchase of Oman Block 61 7,000 MB offset with write-off assets in Brazil -2,900 MBMMTHB32,58827,714OthersCoal: Higher hedging loss from escalated Newcastle priceand lower sales vol. despite avg. selling prices improved25,571NBI (mainly from power)- Lower profit margin of electricity sales to industrial customersas natural gas and coal costs significantly increased24,642Oil & Retail- Lower oil margin; especially diesel from a cap on retail price Higher oil sales volume from easing of lockdown measures Non-oil: better sales vol. due to the recovery of economicactivities and stores expansion-Petrochemical & RefiningHigher derivative loss despite improved operating profitRefinery Higher Acc. GRM from higher stock gain and productspreadsPetrochemical- Olefins & Aromatics: Lower product spreadsPTTEPExtra Items 81%Others/1 35%NBI/2 99%Oil & Retails 16%P&R 39%PTTEP 100%PTT1Q21Remark:* Included impairment1/ Others business mainly contributed from PTT LNG, PTT NGD, PTTT and PTTGM etc.2/ New Business and Infrastructure mainly contributed from power business1Q22 8% Higher avg. selling prices from liquid price increased Higher avg. sales vol. from Oman Block 61 acquisition,Malaysia Block H, and Arthit projects.-PTTGasS&M: Higher pooled gas cost and lower overall gas salesvol. due to lower gas supply GSP: Higher selling prices despite lower sales volume due tolower gas supply and higher feed gas costTrading Higher sales volume- Decreased margin from MTM loss despite higherdomestic condensate margin11
PTT EBITDA Breakdown by BusinessUnit: MMTHB1Q214Q211Q22QoQYoY202020212021 5 100%NGV(221)(1,252)(2,303)84% 20,64920,7399%57,96691,93359%GASTradingTotal12
Financial PositionStrong Balance Sheets maintained credit ratingsConsolidated Balance SheetsMMTHB8%3,078,019Cash &ST InvestAR & 3,315,950426,068725,852655,254AP & OtherLiabilities669,177491,769799,199Key Financial Ratios1,089,407949,825799,587InterestBearing Debt(IBD)1.371.420.400.4420211Q22Net Debt/EBITDA 2.0Net Debt/Equity 1.0PTT Ratings at Sovereign Level1,425,41411,472,940231 Dec 211,421,118341,500,691TotalEquityForeign CurrencyBaa1BBB BBB Local CurrencyBaa1BBB BBB 531 Mar 22 Increase in Inventories and Account Receivables from higher product prices and inventory volume Increase in Cash & Short-term Investment mainly from the increase in long term borrowings primarily from GC PTT and TOP Increase in IBD from short-term and long-term loans as well as bonds issuances from GC Increase in AP & Other Liabilities from commodity derivatives following higher prices and volume13
Dividend Policy & Historical Payments2021 Dividend payout at 52.8%Avg. since IPO46%90.0080.0010-Year Avg.61%148.6%Dividend %52.8%0.00%70.0060.0025% PTT’s min. payout ratio PolicyBaht / shareSplit 34.0020032004200520062007* Split par value from 10 to 1 Baht/share since 24 April 1920202021-900.00%14
Contents01Overview021Q2022 Performance03Strategy04Outlook05Supplementary Information15
PTT’s vision is revised to set aspirationsalong with future trendsPowering Lifewith Future Energy and Beyond16
Powering LifePurposewith future energy and beyondto empower and better lifeTechnology &InnovationPartnership &PlatformGrowth along the way of lifePositive Contribution toenhance livelihoodLow Carbon SocietyDeliver inclusive growth to create economic growth whileenhance quality of life – people, society, community, and environment17
Powering life withFuture Energy and BeyondStrategic Positioningfocus more on future energy trendand new businesses that have potentials to growFutureEnergyRenewableEV ValueChainEnergy Storage &System RelatedHydrogenLifeScienceLogistics &InfrastructureMobility &LifestyleAI, RoboticsdigitalizationHigh ValueBusinessBeyondReady toexplore Moving toward future energy and energy technologies which are clean and environmental friendly aswell as stepping into new potential businesses that support people live and drive people well-being18
Directing energy business in line with future trendReimagineAcceleration intoReinforcePoweringReignite new businessat speed and scaleExpedite executionLNG value chainDownstreamNew Energy & EVFully integrated player ingas and LNG value chainalong with Future Energy& integrate RenewableEnergy Value Chain withPTT Group Business Collaboratively build LNG valuechain platform Accelerate LNG portfoliodevelopment through partnershipFocus onLower-carbon portfolio Coal business divestment Downstream Business PortfolioRebalancing Resilience for Refinery Business To be Global Player with DigitalForefront Synchronized Upstream &Downstream Optimization Renewable Energy Energy StorageSystem EV Value Chain Energy Platform Other potential(e.g. H2)19
Growing along the way of life beyond energyReignite New Business at Speed and ScalePharmaceuticalthrough M&AInvestment in Generics / BiopharmaCompanyCoating and AdhesiveMedical Technology(e.g. Covid-19 Test Kit, Meltblown, MED.GLOVES and MED. DEVICE)Nutrition Accelerating growth in attractivesegments(e.g. composites & UPR, coating additives)Next HVB segment with interest in 2nd Party Logistics (2PL)Rail & TerminalRail-based intermodal logistics services providerModern Logistics Solution & Platform Seeking more opportunities in HPPand CompositeFocus on 3rd Party Logistics (3PL) Explore opportunities inAI, Robotics & DigitalizationSeamless logistic solution providerRobotic / AIDigital platformCloud service provider, Data centerco-locationPTT Group’s Marketing PlatformMobilityStrengthen energy solution forSeamless leStrive one-stop solution forAll LifestyleF&BEcosystemOne-stopSolutionEcosystem20
Overall Strategic Direction to achieve purpose of New VisionBusinessNew growth1NI from Future Energy and Beyond 30%Business growthLNG*9 MTAPower (Conventional)8 GWRenewable energy 12 GW2Clean growth315% GHG reduction fromFutureEnergy&Beyond32%Newbusiness202017%PTT GroupFuture Energy 15% CAPEX(RE, ESS, EV)68%(2021 – 2030)HydrocarbonBusiness(E&P, Gas, LNG,Power, P&R, Oil)E&P Expand growth for high return asset& mainly invest in gas assetsGas Build global LNG portfolioP&R Supply chain integrationMove to high value businessOil &Retail Grow in retail with customerorientedMove to mobility & lifestylePower Accelerate growth in Thailand ®ionNew Expedite growth in new energy e.g.renewable, energy storage & systemrelated and EV value chainNew Scale up potential business e.g. lifescience, logistics & infrastructure Energybusiness* LNG Equity and controlling of portfolio volumeDirection21
PTT: Committed CAPEX (PTT and Wholly Owned Subsidiaries)PTT 5-Years (2022-2026) Committed CAPEX Plan totaling Baht 146,755 million or USD 4.6 bn1/LNG Terminal business16,512 MBLNG Terminal 2 (Nong-Fab) (PTT LNG)Map Ta Phut Phase#3 (PTT Tank)New Business & Infrastructure (NBI) 56,347 MBi.e. Arun plus, Innobic, Laem Chabang Port#3 (PTT Tank),Venture Capital, EECi, PTT group’s business restructuring, etc.Transmission 18,780 MB11%13%38%Bang Pakong– South Bangkok Pipeline5th onshore PipelineGas business group78,757 MB54%30%8%Gas43,465 MBGSP #7 (To replace GSP#1) and GSP #8 (LNG Extraction for Ethaneand LPG with Ethane Storage & Receiving Facilities)Trading and Others 11,651 MBRestructure of PTTGLUnit: MMTHBNatural GasPTT group’s business restructuring (GPSC & PTTGL)and the investments of Arun plus (EV Manufacturing)and Innobic (in Pharmaceutical business)TransmissionLNG Terminal businessNBI96%46,58991,17931,274Trading and Others14,643Future Energy & beyondNote: 2022 budget revision approved by BOD on 16 Jun 22*Revised 2022 only1/ FX2022202320247,0722,58720252026rate (avg.) 32.1Baht/USDThe Provisional uncommitted CAPEX Bt 199 bn mainly focus on Future Energy and New Businesses including Life sciences (Pharmaceutical, Nutrition,Medical devices), Renewable energy, Electricity value chain, Logistics & Infrastructure as well as new pipelines network and LNG value chain.22
Committed CAPEX: PTT GroupTotal committed CAPEX during 2022-2026* : Bt 988 bn or USD 31 bnPower BusinessUnit: MMTHBKey Projects Renewable Energy (Solar/Wind) ERUDownstream BusinessKey Projects GC: Acquired Allnex TOP: Clean Fuel Project (CFP) OR: Oil & Retail Expansion in domestic &international IRPC: Ultra Clean Fuel Project (UCF)4%PTT BusinessKey Projects 2nd LNG Regasification Terminal5th onshore pipelineGSP#7 & GSP#8Bang Pakong– South Bangkok Pipeline15%Upstream Business30%Key Projects51% Onshore and Offshore Exploration and Production inThailand (Bongkot, Erawan etc.) SK410B Mozambique LNG Algeria HBR Southwest VietnamPTT Group’s Provisional CAPEX for 2022 – 2026* Bt 708 bn*Revised of PTT for 20226323
Contents01Overview024Q2021 & YE2021 Performance03Strategy04Outlook05Supplementary Information24
2022 Petroleum and Gas OutlookDubai apore 32-137122-127HSFO (3.5%S)64.487.2106-11195-100VLSFO (0.5%S)75.4107.4116-121110-115Singapore GRM3.48.014.7-15.710.5-11.5Source: PTT, PRISM Petroleum Rolling as of April 2022Gas/LNG Other outages such as Libya shutting its largest oil field amid anti-government protests Recovered demand following the easing of lockdowns however market still concernedabout uncertainties of economic growth- Coordinated Strategic Petroleum Reserves Release from IEA member countries tohelp ease the supply shortage- Increasing supply from OPEC (as planned), expect more supply from U.S. Shale oil, andIran (if sanction lifted)Mogas Asian mobility levels continue to improve amid the easing travel restrictions Restocking demand for U.S. summer driving season in 3Q2022- Rising supply due to increasing refinery runs after maintenance ended and new additionalcapacities in ChinaGasoil Strong demand recovery in Asia & low global inventory levels Supply concern over the Russia-Ukraine conflict- Low seasonal demand during monsoon season in China and India during 3Q2022- Rising supply due to increasing refinery runs as mentionedFuel OilHSFO: Rising seasonal power demand in the Middle East during 3Q2022 Continued high NG prices will encourage the use of fuel oil in the power sector /MMBTU4035302520151050 Deepening crisis in Ukraine as the U.S., Canada, the U.K., Australia, and Switzerland havebanned imports of Russian oil- Rising supply from OPEC , higher refinery utilization rate and Iran (if sanction lifted)Asian Spot LNGVLSFO: Refiner tends to shift to produce more gasoil with better crack spread than VLSFOHenry Hub- Rising supply from higher refinery utilization rateSingapore GRM Improve following the strong gasoline and middle distillates crack an Spot LNG: Geopolitical tensions between Russia and Ukraine4Q22 European imported more LNG in 2022 to substitute for gas imports from RussiaY20211Q20222Q2022(E)2022(E)Asian Spot LNG18.531.234.033.8Henry Hub (HH)3.74.66.86.6Source: EA (Apr.’22) Russian LNG Supply projects delayed- COVID-19 outbreak and Lockdown in ChinaHenry Hub: Low U.S. Storage Level- U.S. gas production expected to increase from gas support for acceleratinginvestment25
2022 Petrochemical OutlookOlefins 1,3301,420 – 1,4401,355 – 1,405PP Film1,3211,3871,430 – 1,4501,375 – 1,4251,4001,200HDPE CFR SEA1,000PP Film CFR SEA8001Q21Aromatics (E)2022(E)BZ9141,0731,160 – 1,1801,118 – 1,168PX8591,0871,180 – 1,2001,132 – 1,1821,2001,000800BZ FOB KoreaPX CFR eY20211Q20222Q2022(E)2022(E)Naphtha MOPJ646877922-942890-940 /TonNaphtha4Q22Olefins Strong feedstock cost to support prices amid ongoing geopolitical tensionbetween Russia-Ukraine Tighten Asian supply from production cuts according to squeezed marginsat standalone units and seasonal turnarounds in 2Q22 Expected downstream demand recovery from easing lockdowns acrossmajor cities in China within late 2Q22- Competitively-priced Chinese cargoes to dampen SEA sentiment- Incoming additional Asian capacities from SEA and NEA, especially China,throughout 2022Aromatics Strong feedstock cost to support prices and Lower Asian supply asmentioned Expected SM/PTA downstream demand recovery from easing lockdownsas mentioned Opened benzene Asia-US arbitrage opportunities and Low Chineseinventories to boost up sentiment- Elevated Chinese PX inventories and uneconomical downstream PTAmargins pressure on markets- Incoming additional Asian capacities as mentionedNaphtha Expected petrochemical demand recovery due to lower cracker maintenanceand easing lockdowns Improved naphtha blending demand ahead of the US driving season in 3Q22 Additional demand from petrochemical plants expected to start throughout20228006004001Q21Source: PTT, PRISM2Q213Q21Petrochemical Rolling as of April 20224Q211Q222Q223Q224Q2226
PTT Group 2022 GuidanceBusiness outlook 2022UpstreamE&P: Vol. 12%Unit costGAS:Domestic gas demandslightly decline and highergas costGSP’s U-Rate 80 -85% in 2022DownstreamOil: Resuming domestic demandP&R:Refinery: Improving Singapore GRM- Lower PTT Group U-Rate 91–95%Petchem:Upcoming project in 2022Future Energy& BeyondFuture Energy: Expansion of EV charger(Arun plus 1,350 units &OR 200 inside PTT stations, 150 outside PTT stations )5th PipelineCODPower:- Higher feed costPhase IIIDec‘2299.6%91.0%39.8%Non-Woven Fabric products: 5.6 KTAin 3Q22High-quality Circular Plastic Resin Plant: 45 KTAin 2Q22Beyond:Lotus: starting torecognize NIcontribution in 2Q2022Avaada Solar Power Platform in India : 4,608 MWGPSC hold 42.9% (2,413 MW in operating / 2,195 MWin progress) COD: 4Q2021-2023 Recovering domestic electricityconsumptionGas Separation PlantsPhase IIOct‘22FID - EV Platform(JV with Foxconn)LNG Terminal#2in April’2297.8%Fully COD Dec‘221st phase : mid year 2.5 MTA Better petrochemical prices- More capacities additionPhase IMar‘22Maintenance schedule in 20222Q: ESP Major SD & GSP#2&3 TD : 23 days3Q: GSP#4 Major SD :20 days4Q: GSP#5 SD : 15 daysPetrochemical & Refinery Plants2Q: Ole 3 & ARO I Major TA : 1 month4Q: Ole 2/2 & HDPE Major TA : 1 monthRefinery Plant Major TA : 50 days4Q: Refinery Plant Major TA : 1 month27
Contents01Overview021Q2022 Performance03Strategy04Outlook05Supplementary Information28
Supplementary InformationPTT Group PerformanceP.30-32Cash FlowP.33-34Debt ProfileP.35PTT Group Accounting StructureP.36Financial Performance by businessPTT Group : Upcoming ProjectsP.37-47P.48Gas Roadmap & PDPP.49-51Natural Gas Price Structure & Pipeline BusinessP.52-53ESG StrategyP.54-579829
PTT Group Performance : 1Q2022 (QoQ & YoY)% PTTholdingPerformance 100%Unit : MMTHB1Q21PTT Net Operating 230%-57%833188 100%8,9417,2288,684- TOP3,3605,033- IRPC5,581Oil- ORNBI- GPSC/TP/DCAP/PTTES/PTTDIGITAL/ENCOE&P- PTTEPPetrochemical- GC- OtherRefiningOthers BusinessInter- PTTER/PTTGMGas- PTTLNG/PTTNGD/PTTGL/TTM(T)/TTM(M)Other- PTTT/Others1/Shared of Net Income from AffiliatesTax Adjustment for Gain on Disposal of Investment and AssetPTT Consolidated Net IncomeEquity Method % 0%-57%6%833188 100%6%20%-3%4,1924,0703,453-15%-18%7,18343% -58%-29%5313,298738-78%39%4933,348 -100% 91808 100%16%699104810 100.00%(377)1/Including PTTGE,BSA, and PTT TCC30
PTT Group Performance : 2021 vs 2020% PTTholdingPerformance 100%Unit : MMTHB2020202120202021PTT Net Operating 471%14,78325,36972%47745,253 100%37410,753 100%- GC20044,982 100%9710,482 100%- Other277271-2%277271-2%(9,453)27,083 100%(7,457)12,170 100%- TOP(3,301)12,578 100%48.03%(4,540)5,284 100%- IRPC(6,152)14,505 100%48.05%(2,917)6,886 100%8,79111,47431%75.00%8,8848,9871%10,42323,536 100%2,6663,30724%2,86915,358 100%1,96213,441 100%(6,318)4,712 100%(7,026)3,880 ,404-31%Shared of Net Income from Affiliates35,771161,568 100%21,21274,027 100%Tax Adjustment for Gain on Disposal of Investment and Asset(1,077)312 100%(1,077)312 100%PTT Consolidated Net Income52,325195,904 100%37,766108,363 100%- PTTEPPetrochemicalRefiningOil- ORNBI- GPSC/TP/DCAP/PTTES/PTTDIGITAL/ENCOOthers BusinessInter- PTTER/PTTGMGas- PTTLNG/PTTNGD/PTTGL/TTM(T)/TTM(M)Other- PTTT/Others1/1/Including PTTGE,BSA, and PTT TCC2021 VS 2020Equity Method % PTT65.29%48.18%100.00%2021 VS 202031
Others2021 vs 2020 PTT Consolidated Performance:Coal: Higher margin due to increased selling pricesfollowing Newcastle price despite lower sales vol.Escalated performance driven by most of PTT Group BusinessesMMTHBNBI (mainly from power) Increased in shareholding of GPSC despite GPSC’s softenperformance due to higher fuel costs108,363Oil & Retail Improved oil margin; especially gasoline & diesel- Lower oil sales volume due to Covid-19 impact- Non-oil was pressured by higher promotion expenses37,766Petrochemical & RefiningRefinery115,308 Higher stock gain in 2021 Higher Mkt GRM mainly from gasoline spreadPetrochemical Olefins & Aromatics: Improved product spreads47,244PTTEP Higher sales vol. from Oman Block 61 acquisition, MalaysiaBlock H projects, Bongkot, Contract4, and Arthit. Higher
Robust revenue and net income growth since IPO (MMUSD) 1 12,553 70,259 2001 2021 Note: As of Jun 30, 2022 Others PTT Group PTT PTTEP PTTGC TOP IRPC GPSC 702 International and local recognition GGC Platts Top 250 Global Energy Company 45rd in 2021 23rd in 2020 21st in 2019 10th in 2018 12th in . LNG Terminal#2 97.8% Avaada Solar Power Platform .