Transcription
Network Management SystemiMonitor User GuideRelease 6.0.9November 30, 2005
Copyright 2005, iDirect, Inc. All rights reserved. This manual may not be reproduced, in partor in whole, without the permission of iDirect, Inc.The specifications and information regarding the products in this manual are subject to changewithout notice. All statements, information, and recommendations in this manual are believed tobe accurate, but are presented without warranty of any kind, express, or implied. Users must takefull responsibility for their application of any products.Trademarks, brand names and products mentioned in this manual are the property of theirrespective owners. All such references are used strictly in an editorial fashion with no intent toconvey any affiliation with the name or the product’s rightful owner.iDirect, Inc.International Headquarters13865 Sunrise Valley DriveHerndon, VA 20171www.iDirect.netHQ: 1.703.648.8000Toll free from within the US 1.888.362.5475iiNetwork Management System iMonitor User Guide, Release 6.0
ContentsFiguresviiiTablesix1 Using this Guide11.1 Intended Audience11.2 Document Conventions11.2.1 Typographical and Navigational Conventions11.2.2 Informational Conventions12 Overview of the NMS for iMonitor32.1 Introduction32.2 Components of the Network Management System32.2.1 NMS Applications3iBuilder3iMonitor4iSite42.2.2 Server Components4Configuration Server4Real-time Data Server5Event Server5Latency Server5PP Controller Server5NMS Monitor Script5Consolidation Script5Database Backup Script5Database Restore Script52.3 Installing iBuilder, iMonitor, and iSite52.3.1 System Requirements62.3.2 Installation Procedure62.4 Launching iMonitor7Logging On To Additional Servers8Multiple Users or PCs Accessing the NMS8Accepting Changes82.5 Overview of iMonitor Usage and Displays92.5.1 iMonitor Time Frames in Requests92.5.2 Saving Historical Time Ranges across Multiple Displays92.5.3 Historical “Save to File” Capability102.5.4 Types of iMonitor Displays102.5.5 Multicolumn Details Displays10iiiNetwork Management System iMonitor User Guide, Release 6.0
2.5.6 Multiple vs. Grouped Display Results2.6 Using iMonitor’s Interface2.6.1 Clicking on Elements: What Happens?111112Right-Clicking12Single-Clicking vs. Double-Clicking122.6.2 Globe Functions13Using the Docking Feature13Hiding Elements13Expanding Tree14Collapsing Tree14Sorting Columns15Sorting the Tree152.6.3 Network Tree172.6.4 Using the Interface Toolbars and Menu Options17Title Bar17Menu Bar18Toolbar18Audio Notification19View Menu20Find Toolbar20Workspace Toolbar22Operational Toolbar23Status Bar24Connection Details on Status Bar Icon24Conditions Pane24Legend Pane25Configuration Changes Pane25Monitor Menu263 Monitoring Conditions and Events3.1 Conditions27273.1.1 Representing State of Element via Icons273.1.2 Conditions View Tabs283.1.3 Elements with Multiple Conditions283.1.4 Offline State293.1.5 Alarms and Warnings on Elements293.2 Putting an Element under Observation for Conditions3.2.1 Viewing Conditions or Events3034Viewing Conditions34Viewing Events353.2.2 Interpreting Conditions ResultsivNetwork Management System iMonitor User Guide, Release 6.042
3.3 Interpreting System Events443.4 Snapshots443.4.1 Network Condition SnapshotMultiple Selection Options in Condition Snapshot View3.4.2 Network Data Snapshot4 Obtaining Performance and Status Information444850554.1 Monitoring Blades in iMonitor554.2 Retrieving Information on Remotes using Probe574.2.1 CPU Usage (Blades Only)624.2.2 Time Plan64Pausing the Time Plan Graph and Highlighting Individual Entries4.2.3 Inroute Distribution6767Networks68Inroute Groups69Performing ACQ Bounce694.2.4 Latency4.3 SAT Link Info69734.3.1 Line Card Statistics734.3.2 SATCOM Graph76Remote Status and UCP Info76Display76Procedure for Viewing SATCOM Graph, Remote Status and UCP Info76Remote Status and UCP Info Tabs804.3.3 Control Panel4.4 Telnet80835 IP and SAT Traffic Graphs855.1 IP Statistics855.2 IP Statistics Changes855.3 SAT Statistics865.3.1 SAT Traffic Graph875.3.2 IP Traffic Graph905.3.3 Viewing Options935.3.4 Bandwidth Usage946 Reporting on Networks976.1 Reports976.1.1 Long-Term Bandwidth Usage Report976.1.2 IP and SAT Long Term Bandwidth Usage Reports97Results100Totals Tab100vNetwork Management System iMonitor User Guide, Release 6.0
Averages Tab6.1.2.1 Interpreting the ReportPercentage of Channel Capacity6.2 Remote Availability ReportAppendix A Accessing the NMS Statistics Archive100102102103105A.1 Improved NMS Statistics Archive Storage105A.2 Improved NMS Statistics Archive Lookup105A.3 Archive Consolidation105A.4 NMS Database Overview106Connecting to the NMS Archive Database with ODBC106Obtaining the ODBC Connection Library106Setting up a Simple ODBC Access Account106A.5 Basic Archive Database Information107Types of NMS Databases and Supported Access107Structure Changes between Releases107Accessing Remote and Network Names from Configuration Database107Timestamps108Archive Consolidation108Overview of the Archive Database Tables108A.6 Database Table Details109IP Stats Tables109New Fields Beginning with Release 4.0.0110IP Stats Consolidation111Latency Measurements112Hub Line Card Statistics113Remote Status113Uplink Control Adjustments114Event Messages115Hub and Remote State Changes116Protocol Processor State Changes118Hub Chassis State Changes119Appendix B Alarms and Warnings121B.1 Alarms121B.2 Warnings122B.3 Acronyms124B.4 Warning Limit Ranges125Appendix C SNMP Proxy Agent127C.1 How the Proxy Agent Works127C.1.1 Installing and Running the SNMP Proxy127C.1.2 The iDirect Management Information Base (MIB)128C.1.3 iDirect MIB SNMP Traps129viNetwork Management System iMonitor User Guide, Release 6.0
C.1.4 Setting up SNMP TrapsC.2 Working with HP OpenViewC.2.1 Linux SNMP ToolsIndex130131131133viiNetwork Management System iMonitor User Guide, Release 6.0
FiguresFigure 2-1: Windows Start Menu Entries for NMS GUI Clients6Figure 2-2: Expand Tree Selection14Figure 2-3: Expanded Tree with Child Elements14Figure 2-4: Collapse Tree Selection14Figure 2-5: Collapsed Tree14Figure 2-6: The Workspace Toolbar in Action22Figure 3-1: Conditions Time Range37Figure 3-2: Events Time Range with Text Filter38Figure 3-3: Conditions Results in Multicolumn Format39Figure 3-4: Conditions Time Line Results in Graphical Format40Figure 3-5: Event Results42Figure 3-6: List View of Network Condition Snapshot45Figure 3-7: Remote Submenu in Condition Snapshot46Figure 4-1: Remote Status Raw Data80Figure 4-2: UCP Info Raw Data80Figure 5-1: Collection Points for IP Usage Statistics86Figure 5-2: Real-Time Bandwidth Usage Display95Figure 6-1: SAT Long Term Bandwidth Usage Report101Figure 6-2: IP Long Term Bandwidth Usage Report102Figure C-1: SNMP Proxy Architecture127viiiNetwork Management System iMonitor User Guide, Release 6.0
TablesTable 2-1: Toolbar Icons and Functions18Table 2-2: Operational Toolbar Icons and Functions23Table 3-1: Elements and Types of Information Provided27Table 3-2: Real-Time States and Icons27Table 3-3: Explanation of Alarms by Element29Table 3-4: Explanation of Warnings by Element29Table 3-5: Explanation of Alarms and Warnings on Hub Chassis30Table A-1: Archive Database Tables108Table A-2: IP Stats Record Format109Table A-3: Additional Consolidated IP Stats Table Fields111Table A-4: lat stats Record Format112Table A-5: nms hub stats Table Format113Table A-6: nms remote status Record Format114Table A-7: nms ucp info Record Format115Table A-8: event msg Record Format115Table A-9: state change log Record Format116Table A-10: pp state change log Record Format118Table A-11: chassis state change log Record Format119Table B-1: Alarms121Table B-2: Warnings122Table B-3: Warning Limit Ranges125Table C-1: iDirect MIB Contents128Table C-2: iDIRECT MIB Traps129Table C-3: SNMP Command Line Utilities131ixNetwork Management System iMonitor User Guide, Release 6.0
xNetwork Management System iMonitor User Guide, Release 6.0
1Using this Guide1.1Intended AudienceThis user guide is intended for all network operators using the iDirect iDS system, as well asnetwork architects and any other personnel who may operate or monitor the networks from timeto time. It is not intended for end users or field installers.Some basic knowledge of TCP/IP concepts, satellite communications, and Windows operatingsystems is expected. Prior experience operating an iDS network, although desirable, is not arequirement.1.2Document ConventionsThis section illustrates and describes the conventions used throughout the manual. Take a looknow, before you begin using this manual, so that you’ll know how to interpret the informationpresented.1.2.11.2.2Typographical and Navigational Conventions Information you type directly into data fields or at command prompts is in courierfont. Windows menu selections are represented as Menu J Command, or in the case ofcascading menus, Menu J SubMenu J Command. Menu selections made from items in the Tree View are represented as level in tree J Command. For example, the Tree menu item to modify a line card is shown as LineCard J Modify. Names of commands, menus, folders, tabs, dialog boxes, list boxes, and options arein bold font. Procedures begin with a feature description, followed by step-by-step, numberedinstructions.Informational ConventionsNOTEWARNINGWhen you see the NOTE symbol, the corresponding text containshelpful suggestions or references to material not contained in thismanual.When you see this alert symbol with a WARNING or CAUTION heading,strictly follow the warning instructions to avoid personal injury,equipment damage or loss of data.1Network Management System iMonitor User Guide, Release 6.0
2Network Management System iMonitor User Guide, Release 6.0
2Overview of the NMS for iMonitoriDirect’s Network Management System (NMS) is a powerful suite of applications and servers thatprovide complete control and visibility to all components of your iDirect networks. The NMS client/server system architecture consists of three series of components:2.1 Three NMS applications with Graphical User Interfaces (GUIs) that allow you toconfigure and monitor your network A database that stores the data entered by and displayed to users A middleware tier that manages access to the database on behalf of user operationsIntroductionThis chapter provides some of the most important information you will need to understand howiMonitor works and how to use it as effectively as possible. This chapter discusses how to preparefor installation, what you will see when you first launch iMonitor, how to use the many powerfultools available in iMonitor, how to create, customize, and print reports, and how to determine theconfiguration status of network elements.iMonitor provides complete visibility to real-time status and operational characteristics of networkelements. Status refers to the real-time state of network elements (such as OK, Warning, Alarm).iMonitor notifies you asynchronously of warnings and alarms for all network elements,which are collectively called conditions. Operational characteristics are captured in a variety of network statistical data, suchas IP traffic statistics, satellite link quality, and hardware component operating values.You can also obtain and view data stored in the historical archive, which allows you to analyzeanomaly conditions and perform trend analysis.2.2Components of the Network Management SystemThe NMS consists of several client/server components that work together to provide the functionsand views necessary to control your network. These components are briefly discussed below.2.2.1NMS ApplicationsThe iDirect NMS provides three GUI clients, each of which performs specific functions fornetworks operators, field installers, and end users.iBuilderThe iBuilder application provides all configuration and control functions to network operators.Configuration options consist of creating network elements (e.g. networks, line cards, remotes)and specifying their operational parameters, such as QoS profiles or IP addresses. Controloptions consist of applying the specified configurations to the actual network elements, retrieving3Network Management System iMonitor User Guide, Release 6.0
active configurations, resetting elements, and upgrading element software and firmware. Refer toNetwork Management System iBuilder User Guide for more information.iMonitorThe iMonitor application provides complete visibility to the real-time status and operational data ofnetwork elements. “Status” refers to the real-time state of network elements, such as OK, warning,or alarm. Operational data are captured in a variety of network statistical data tables and displays,revealing, for example, IP traffic statistics, satellite link quality, and hardware component operatingvalues.In addition to real-time visibility, iMonitor allows you to access state and statistics from thehistorical archive in order to analyze anomaly conditions and perform trend analyses. This guidehas a complete list of real-time and historical data available through iMonitor.iSiteThe iSite application is used primarily for commissioning new sites and monitoring TDMA remotesfrom the local LAN side. It contains functions to help installers calculate antenna azimuth/elevation, perform antenna pointing, and put up a continuous wave (CW) carrier for antennapeaking, cross-polarization and 1db compression tests. It also provides configuration and realtime state/statistical information for one or more remote units. Instead of interacting with the NMSmiddleware, it connects directly to each remote to perform all of its operations. iSite does notprovide access to historical information.iSite also allows monitor-only capability to end-users, should you decide to provide it to them. Formore information About iSite, see the book Using iSite to Commission Equipment.2.2.2NOTEEnd-users do not need iSite in order to receive or transmit IP dataover the iDS system.NOTEBeginning with release 5.0.0, iSite replaces NetManager.Server ComponentsThe NMS server processes run on your NMS Linux Server machines. There are a number of NMSservers processes, each of which performs a specific set of back-end functions.Configuration ServerThe configuration server is the core component of the NMS server family. It manages access tothe configuration database, which contains all the element definitions for your networks and their4Network Management System iMonitor User Guide, Release 6.0
operational parameters. Additionally, the configuration server provides most network controlfunctions (configuration apply, firmware download, resetting, etc.). The other servers also use thisserver to determine what the network components are.Real-time Data ServerThe real-time data server collects most of the network statistics produced by your networkelements. These statistics include IP stats for each remote, remote status messages, timeplan slotassignments, line card statistics, etc. Additionally, the real-time data server provides thesestatistics to the GUI clients for real-time and historical display.Event ServerThe event server’s primary job is to generate warnings and alarms and send them to iMonitor fordisplay. Warnings and alarms are collectively known as “conditions”. The event server alsocollects and archives all system events and provides them to iMonitor for display.Latency ServerThe latency server measures round-trip time, or latency, for every active remote in your networks.These measurements are stored in the archive and provided to iMonitor for display.PP Controller ServerThe control server manages the PP Controller processes running on the NMS server.NMS Monitor ScriptThis simple script monitors all other servers and restarts them automatically if they terminateabnormally. It records a log file of its activities and can be configured to send e-mail to designatedrecipients when it restarts any of the other servers.Consolidation ScriptThe consolidation process periodically consolidates records in the statistics archive to preservedisk space on the server machine. Default consolidation parameters are already entered into yourconfiguration database; they can be tuned to your particular storage requirements if necessary.Database Backup ScriptThis daemon runs nightly to back up the data in your primary databases and copy it to your backupNMS server. The database backup daemon must be custom-configured for each customer site.Database Restore ScriptThis daemon runs nightly on your backup NMS server. It restores your primary NMS database intothe backup database for NMS failover purposes.2.3Installing iBuilder, iMonitor, and iSiteThis section provides the system requirements and procedures for installing your NetworkManagement System components.5Network Management System iMonitor User Guide, Release 6.0
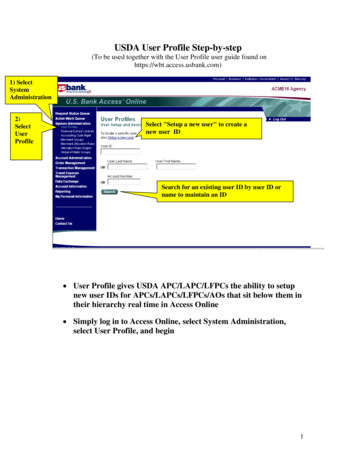
2.3.1System RequirementsThe NMS GUI clients are Windows PC-based applications that run under the following versionsof Windows: Windows 2000 Service Pack 3 or later Windows XPWindows NT, Windows 98 and Windows 95 are NOT supported. We do NOT support serverbased versions of Windows.2.3.2Installation ProcedureA single client installer .exe file, nms clients setup.exe, installs all three GUI clients andassociated library files for you.To install, copy the .exe file to the target PC, double-click it, and follow the prompts.By default, the clients are installed in the directory C:\Program Files\iDIRECT. The installerautomatically places a shortcut to each GUI application on your desktop and adds the appropriateentries in the Windows Start menu. Click Start J All Programs J iDirect J NMS Clients 6.0. TheiBuilder, iMonitor, and iSite clients are displayed, along with an Uninstall selection.Figure 6: Desktop Shortcuts for NMS GUI ClientsFigure 2-1: Windows Start Menu Entries for NMS GUI ClientsNOTEThe server portion of the NMS is installed on the primary andbackup NMS servers. For more information About installing and/or upgrading these components, see the iDirect Technical Notetitled Installing iDS Software.6Network Management System iMonitor User Guide, Release 6.0
2.4Launching iMonitoriMonitor is initially installed with two default accounts: “admin” and “guest”. The admin user hasfull access privileges to all iMonitor functionality, while the guest account has read-only access.The passwords for these two accounts are identical to their associated user names. Forinformation on setting up user accounts, see Appendix Appendix C, Creating and Managing UserAccounts in Network Management System iBuilder User Guide.iDirect strongly recommends that you modify the admin user password as soon as possible afterthe installation. This is especially important if your NMS Server is accessible via the publicInternet.Step 1To launch iMonitor, double-click the desktop shortcut or select it from theWindows Start menu.Step 2Enter your user name and password in the Login Information dialog box.Step 3Click Server and select the IP address or host name of your primary NMSServer machine. The Server box holds up to three IP addresses. If yoursdoes not exist, enter the IP Address in the Server box.Step 4Click OK to complete the login process.NOTEThe NMS server version must match the iMonitor version in order foryou to log in. For example, version 6.0.0 of iMonitor may connect only toversion 6.0.0 of the NMS servers.The iMonitor application automatically connects to the NMS server processes that are required toperform the NMS’s functions. If this connection is lost for any reason, iMonitor automaticallyreconnects to the servers when they become available.7Network Management System iMonitor User Guide, Release 6.0
Logging On To Additional ServersIn the event that there are multiple NMS servers in the same teleport or multiple teleports underthe network operator’s control, you may need to log out of one NMS server and log in to anotherone. You can do this without exiting iMonitor. From the Main Menu, select File J Log Off to logout of your current session and File J Log On to open the Login Information dialog box again.Multiple Users or PCs Accessing the NMSMultiple users or multiple sessions may run simultaneously on the NMS database. For example,the NMS offers the following capabilities:1. You may run multiple simultaneous sessions of iMonitor on a single PC. Theseversions may be connected to different servers or the same server.2. Multiple PCs may run the same session of iMonitor at any given time and connect tothe same server at the same time.Accepting ChangesWhen two iMonitor users are connected to the same server, and one of them modifies the networkconfiguration, the other user cannot modify the configuration suite until he accepts the changes,which will automatically refresh his configuration view to reflect the latest changes.When the other user changes the configuration, the Accept Changes button on your toolbarchanges color from gray to red (For more information, see Table 2-1, “Toolbar Icons andFunctions,” on page 18.8Network Management System iMonitor User Guide, Release 6.0
Before you accept the changes, you may view the other user’s changes by selecting View JConfiguration Changes (see Section “Configuration Changes Pane” on page 25). To accept thechanges and update your view of iMonitor, click Accept Changes. Any modifications the other userhas made are now displayed in your copy of iMonitor.2.5Overview of iMonitor Usage and Displays2.5.1iMonitor Time Frames in RequestsiMonitor provides three basic time periods for requesting data: real-time, historical, and Get Past.2.5.2 Real-time requests display data as it arrives into the NMS back-end in real-time.These requests have no ending time period—they continue displaying data as long asyou keep the display running. Closing either the specific display or the iMonitorapplication automatically cancels real-time requests. Historical requests retrieve data purely from the historical archive based on the startand end times you specify. These requests are active in the back-end only until thedata is completely delivered to iMonitor. Get Past requests represent a hybrid of real-time and historical: when you request GetPast data, iMonitor retrieves the most recent data from the archive, and then continuesto give you real-time data until you cancel the request.Saving Historical Time Ranges across Multiple DisplaysOccasionally you are faced with a situation that requires you to launch multiple different displaysfor the same time range. iMonitor makes this task much simpler by allowing you to save a specifiedtime range and re-use it in as many displays as necessary. You may save purely historical timeranges and Get Past ranges independently.To save a specified time range, use the following procedure:1. Launch the first display and specify the time range for the time period you areinvestigating. Notice the pushpin located next to the Time Range button (or the Get Pastdrop-down list for Get Past requests).2. Next, press the pushpin located next to the Time Range button (or the Get Past dropdown list for Get Past requests). The pushpin will change to appear undepressed.9Network Management System iMonitor User Guide, Release 6.0
3. All future requests will automatically use the time range you just saved, until you “takedown” the time range by clicking on the pushpin again.2.5.3Historical “Save to File” CapabilityYou may specify a disk file name for iMonitor to save historical or real-time results into. Thisfeature is useful if you have requested a large amount of data for a large number of remotes. Youmay specify a file name in the following parameters dialogs: Latency Line card statistics Events Conditions Remote Status/UCP2.5.4Types of iMonitor DisplaysThe two data display types used in iMonitor are graphical displays and multicolumn lists.Conditions are shown only in multicolumn lists. Network statistical data may be displayed in bothgraphical format and/or multicolumn lists, depending on the type of data you are viewing. Graphical displays represent data in graphical charts. Multicolumn lists represent data arranged in tabular format with rows and columns.2.5.5Multicolumn Details DisplaysAll of iMonitor’s multicolumn lists share certain characteristics in common. Among them are: Data in multicolumn lists can be sorted in ascending or descending order by clickingon the column heading containing the data you want to sort by. The default sort order is normally “ascending by time stamp.” All scrollbars function identically: If the slider is at the bottom of the pane, the pane scrolls to continually show younew data as it’s added to the display. If the slider is positioned somewhere other than the bottom of the display, datacontinues to be added at the bottom, but the display position remains constant atthe current point. This is based on the assumption that you’re viewing data in themiddle of the display and you don’t want the pane scrolling away from that data. Multiple rows of data may be selected and copied/pasted into another application suchas Excel for offline viewing and analysis. Multicolumn lists may be printed to any printer you have configured on your PC. SelectFilePrint to print the contents of a list. By using your mouse button inside the multicolumn list, you may select either theExpand All or Fit to Window options. These options work as follows:10Network Management System iMonitor User Guide, Release 6.0
2.5.6 Expand All resizes each column to be the width of either the widest data in thatcolumn, or the width of the column heading, whichever is wider. Fit to Pane resizes all columns to fit inside the current width of the pane (so that noscroll bar is required). copy this data to a file copy it without the headers to a fileMultiple vs. Grouped Display ResultsWhen you request element data from a higher node level, iMonitor provides you with an interimdialog where you can select which remotes for which to request data. How the data is displayeddepends on the type of data you are requesting. Two different behaviors are possible:2.6 When the data makes sense only for a single network element, iMonitor launchesmultiple displays, one for each element. When the data from multiple elements can be shown together, iMonitor launches asingle pane and displays all data in that pane.Using iMonitor’s InterfaceiMonitor’s main window is comprised of several toolbars and panes which are described below.11Network Management System iMonitor User Guide, Release 6.0
2.6.1Clicking on Elements: What Happens?Right-ClickingIn general, you must right-click on your mouse or use the task bar to display any list of options insubmenus that can be performed on the element you currently have selected.Single-Clicking vs. Double-ClickingYou can single-click a plus ( ) or minus (-) sign next to an element in the Tree to expand orcontract the branches to the next level down in the tree for that element. Once an element has noplus ( ) signs next to it, you can double-click any element to view the Properties for that elementin read-only mode.12Network Management System iMonitor User Guide, Release 6.0
You can double-click any element in the Tree that has been expanded to automatically contractthe branches below that node.2.6.2Globe FunctionsRight-clicking the Globe allows you to move dockable panes, sort columns hide elements, expandthe Tree and Contract the Tree.Using the Docking FeatureDocking refer to the ability to move a window pane of the NMS interface to another location on thescreen or to detach it from the screen entirely and place it somewhere else on your monitor. IniDirect’s NMS, the dockable panes have double-ridge lines at the top of the pane.To dock a window pane somewhere else on the NMS interface or on your monitor, follow theprocedure below:Step 1Point to and right-click the double-ridge lines of the pane you want to moveand select Allow Docking.Step 2Place the pointer (mouse arrow) on the double-ridge lines and drag thepane wherever you want it. Depending on where you drag it, the pane maychange shape (for example, from a vertical display to a horizontal display).Step 3If you want to move the pane back into its original place or to anotherlocation, start by grabbing the double-ridge lines with your pointer. Then,you can click the Name toolbar at the top of the pane to move it around, andyou can place your pointer at the edges of the pane to resize the pane.Step 4To detach the pane completely, double-click the double-ridge lines. Thepane becomes separately parented and you may move it independentlyfrom the main iMonitor window. This feature is useful if you have twodisplays on a single PC and want to move this pane to the second display.Hiding ElementsYou can click Hide to remove Tree from view.13Network Management System iMonitor User Guide, Release 6.0
Expanding TreeTo expand the Tree to view all of the children elements, select Expand Tree. The Tree will expandto show all of the child elements.Figure 2-2: Expand Tree SelectionFigure 2-3: Expanded Tree with Child ElementsCollapsing TreeTo collapse the Tree to view only the top level elements, select Collapse Tree. The Tree willcontract to show only the top level elements.Figure 2-4: Collapse Tree SelectionFigure 2-5: Collapsed Tree14Network Management System iMonitor User Guide, Release 6.0
Sorting ColumnsIn any pane with columns, or list controls, you can sort the entries in the pane by clicking on theheading of the given column.Sorting the TreeTo sort the Tree, follow the steps below:Step 1Right-click the double-ridge lines above the Tree pane and select Sort Tree.You can also select Edit J Sort Tree.lStep 2The Sort Preferences dialog box is displayed.Step 3Click the Sort items in drop-down list and select either Ascending orDescending.Step 4Click the Sort items by drop-down list and select one of the options.Depending on what you select in this field, your ch
Network Management System iMonitor User Guide, Release 6.0 1 Using this Guide 1.1 Intended Audience This user guide is intended for all network operators using the iDirect iDS system, as well as network architects and any other personnel who may operate or monitor the networks from time to time. It is not intended for end users or field installers.