Transcription
Web AnalyticsAbout the TutorialWeb Analytics is a technique that you can employ to collect, measure, report, and analyze yourwebsite data. It is normally carried out to analyze the performance of a website and optimize itsweb usage.Web Analytics is an indispensable technique for all those people who run their business online.This is a comprehensive tutorial that covers all the basics of web analytics.AudienceThis tutorial is designed for SEO professionals as well as beginners who would like to learn thebasics of Web Analytics and its techniques.PrerequisitesBefore proceeding with this tutorial, it is expected that you have a basic understanding of howto develop professional websites and how to attract web traffic.Copyright & Disclaimer Copyright 2015 by Tutorials Point (I) Pvt. Ltd.All the content and graphics published in this e-book are the property of Tutorials Point (I) Pvt.Ltd. The user of this e-book is prohibited to reuse, retain, copy, distribute or republish anycontents or a part of the contents of this e-book in any manner without written consent of thepublisher.We strive to update the contents of our website and tutorials as timely and as precisely aspossible, however, the contents may contain inaccuracies or errors. Tutorials Point (I) Pvt. Ltd.provides no guarantee regarding the accuracy, timeliness, or completeness of our website or itscontents including this tutorial. If you discover any errors on our website or in this tutorial,please notify us at contact@tutorialspoint.comi
Web AnalyticsTable of ContentsAbout the Tutorial. iAudience . iPrerequisites . iTable of Contents . ii1.INTRODUCTION . 1What is Web Analytics? . 1Importance of Web Analytics . 1Web Analytics Process . 12.GOOGLE ANALYTICS . 3Google Analytics . 3Audience Analysis . 4Acquisition Analysis . 4Behavior Analysis . 5Conversion Analysis . 53.OPTIMIZELY . 64.KISSMETRICS. 85.CRAZY EGG . 106.KEY METRICS . 12What to Measure .127.DATA SOURCES . 14Server Logs .14Visitors' Data.14Search Engine Statistics .14Conversion Funnels .15ii
Web Analytics8.SEGMENTATION . 17Data Segmentation .17Analysis Using Segmentation .189.DASHBOARDS . 20Dashboard Implementation .20Types of Dashboards .20Metrics for Every Dashboard .2110. CONVERSION . 22Goals .22Funnels .2311. EMERGING ANALYTICS . 25Social Media Analytics .25E-commerce Analytics .26Mobile Analytics .2712. A/B TESTING . 2913. AUTOMATED REPORTING AND ANNOTATION . 31Annotation .3114. ACTIONABLE REPORTING. 32How to Prepare Actionable Report? .3215. WEB ANALYTICS TERMINOLOGY . 33iii
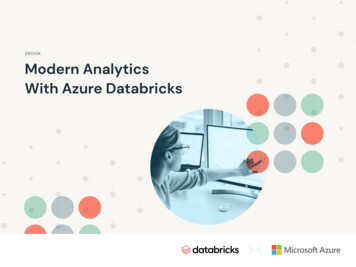
1. INTRODUCTIONWhat is Web Analytics?Web Analytics is the methodological study of online/offline patterns and trends. It is atechnique that you can employ to collect, measure, report, and analyze your website data. It isnormally carried out to analyze the performance of a website and optimize its web usage.We use web analytics to track key metrics and analyze visitors’ activity and traffic flow. It is atactical approach to collect data and generate reports.Importance of Web AnalyticsWe need Web Analytics to assess the success rate of a website and its associated business. UsingWeb Analytics, we can: Assess web content problems so that they can be rectified Have a clear perspective of website trends Monitor web traffic and user flow Demonstrate goals acquisition Figure out potential keywords Identify segments for improvement Find out referring sourcesWeb Analytics ProcessThe primary objective of carrying out Web Analytics is to optimize the website in order to providebetter user experience. It provides a data-driven report to measure visitors’ flow throughout thewebsite.Take a look at the following illustration. It depicts the process of web analytics. Set the business goals. To track the goal achievement, set the Key Performance Indicators (KPI). Collect correct and suitable data. To extract insights, Analyze data. Based on assumptions learned from the data analysis, Test alternatives. Based on either data analysis or website testing, Implement insights.1
Web AnalyticsDefineGoalsBuild KPIsImplementWeb DataWeb Analytics is an ongoing process that helps in attracting more traffic to a site and thereby,increasing the Return on Investment.2
2.GOOGLE ANALYTICSWeb AnalyticsAnalytics Tools offer an insight into the performance of your website, visitors’ behavior, and dataflow. These tools are inexpensive and easy to use. Sometimes, they are even free.Google AnalyticsGoogle Analytics is a freemium analytic tool that provides a detailed statistics of the web traffic.It is used by more than 60% of website owners.Google analytics helps you to track and measure visitors, traffic sources, goals, conversion, andother metrics (as shown in the above image). It basically generates reports on: Audience Analysis Acquisition Analysis Behavior Analysis Conversion AnalysisLet us discuss each one of them in detail.3
Web AnalyticsAudience AnalysisAs the name suggests, audience analysis gives you an overview of the audience who visit yoursite along with their session history, page-views, bounce rate, etc. You can trace the new as wellas the returning users along with their geographical locations. You can track: The age and gender of your audience under Demographics. The affinity reach and market segmentation under Interests. Language and location under Geo. New and returning visitors, their frequency, and engagement under Behavior. Browsers, Operating systems, and network of your audience in Technology. Mobile device info under Mobile. Custom variable report under Custom. This report shows the activity by custom modulesthat you created to capture the selections. Benchmarking channels, locations, and devices under Benchmarking. Benchmarkingallows you to compare your metrics with other related industries. So, you can plot whatyou need to incur in order to overtake the market. Flow of user activity under Users flow to see the path they took on your website.Acquisition AnalysisAcquisition means ‘to acquire.’ Acquisition analysis is carried out to find out the sources fromwhere your web traffic originates. Using acquisition analysis, you can: Capture traffic from all channels, particular source/medium, and from referrals. Trace traffic from AdWords (paid search). See traffic from search engines. Here, you can see Queries, triggered landing pages,and geographical summary. Track social media traffic. It helps you to identify networks where your users areengaged. You can see referrals from where your traffic originates. You can also have aview of your hub activity, bookmarking sites follow-up, etc. In the same tab, you canhave a look at your endorsements in details. It helps you measure the impact of socialmedia on your website. See which plug-ins gave you traffic. Have a look at all the campaigns you built throughout your website with detailed statisticsof paid/organic keywords and the cost incurred on it.4
Web AnalyticsBehavior AnalysisBehavior analysis monitors users’ activities on a website. You can find behavioral data under thefollowing four segments: Site Content: It shows how many pages were viewed. You can see the detailedinteraction of data across all pages or in segments like content drill-down, landing pages,and exit pages. Content drill-down is breaking up of data into sub-folders. Landingpage is the page where the user lands, and exit page is where the user exits your site.You can measure the behavioral flow in terms of content. Site Speed: Here, you can capture page load time, execution speed, and performancedata. You can see how quickly the browser can parse through the page. Further, you canmeasure page timings, user timings, and get speed suggestion. It helps you to knowwhere you are lagging. Site Search: It gives you a full picture of how the users search across your site, whatthey normally look for, and how they arrive at a particular landing page. You can analyzewhat they search for before landing on your website. Events: Events are visitors’ actions with content, which can be traced independently.Example: downloads, sign up, log-in, etc.Conversion AnalysisConversion is a goal completion or a transaction by a user on your website. For example,download, checkout, buy, etc. To track conversions in analytics, you need to define a goal andset a URL that is traceable. Goals – Metrics that measure a profitable activity that you want the user to complete.You can set them to track the actions. Each time a goal is achieved, a conversion is addedto your data. You can observe goal completion, value, reverse path, and goal flow. Ecommerce – You can set ecommerce tracking to know what the users buy from yourwebsite. It helps you to find product performance, sale performance, transactions, andpurchase time. Based on these data, you can analyze what can be beneficial and whatcan incur you loss. Multi-channel funnels – Multi-channel funnels or MCF reports the source of conversion;what roles the website plays, referrals’ role in that conversion; and what all slabs didwhen users pass through landing page to conversion. For example, a user searched for aquery on Google search page, he visited the website, but did not convert. Later on, hedirectly typed your website name and made a purchase. All these activities can be tracedon MCF. Attribution – Attribution modeling credits sales and conversions to touch points inconversion tracking. It lets you decide what platforms or strategy or module is the bestfor your business. Suppose a person visited your website through AdWords ad and madeno purchase. A month later, he visits via a social platform and again does not buy. Thirdtime, he visited directly and converted. Here, the last interaction model will credit directfor the conversion, whereas first interaction model will assign credit to paid medium. Thisway, you can analyze what module should be credited for a conversion.5
3. OPTIMIZELYWeb AnalyticsOptimizely is an optimization platform to test and validate changes and the present look ofyour webpage. It also determines which layout to finally go with. It uses A/B Testing, Multipage, and Multivariate Testing to improve and analyze your website.A wonderful feature of Optimizely is that you do not need to be a technical expert. You just needto insert a deployed code provided by Optimizely in your HTML. After putting it, you can traceanything, take any action, and make any changes in your website.Optimizely provides you administrative and management functionality to let you create account,organize projects, and experiment. This facility helps you in tracking clicks, conversions, signups, etc.You are allowed to run tests and use custom integrations with Optimizely interface. All you needis: Set up an account on Optimizely and add a generated script. Once you are done with it, select your test pages. It implies the factors you want to runtest on. Set Goals. To set goals, click on the flag icon at the top right of the page and follow upthe instructions. Check metrics you are looking for. Click Save.6
Web Analytics You can create variations with the usual editor like changing text and images. Next step is monitoring your tests. You need to test which landing pages are performingwell. What is attracting the visitors? What is the bounce rate? Understand the statistics,filter the non-performing areas, and conclude the test. You can run multipage tests using javascript editors.Optimizely gives you a better understanding of conversion rate optimization and running tests.7
4. KISSMETRICSWeb AnalyticsKISSmetrics is a powerful web analytics tool that delivers key insights and user interaction onyour website. It defines a clear picture of users’ activities on your website and collects acquisitiondata of every visitor.You can use this service free for a month. After that, you can switch on to a paid plan that suitsyou. KISSmetrics helps in improving sales by knowing cart-abandoned products. It helps you toknow exactly when to follow up your customers by tracking the repeat buyers activity slot.KISSmetrics helps you identify the following: Cart size Landing page conversion rate Customer activity on your portal Customer bounce points Cart abandoned products Customer occurrence before making a purchase Customer lifetime value, etc.8
Web AnalyticsSummarizing KISSmetrics It gets you more customers by not letting you lose potential customers and maintainingbrand loyalty. It lets you to judge your decisions where you are playing right. It helps you identify data and trends, which contribute in customer acquisition.Best Features of KISSmetrics Ability to track effective marketing channels. Figure out how much time a user takes to convert. Determine a degree of which user was engaged with your site. A convenient dashboard. You do not need to run around searching for figures.InstallationJust sign-up for an account and customize accordingly.TrackingAdd a java snippet under head tag of the source code of your website.Event SettingBy default, KISSmetrics sets two events for you: visited site and search engine hit. To addmore events, click on new event, add an attribute and record an event name.Setting up MetricsClick on create a new metric. Select your metric type from the list. Give metric name, description,and event. Save metric.Define ConversionsDefine your conversion and track them. Select number of times event happened. Give metricname and description and select event. Save metric again.KISSmetrics can track web pages, mobile apps, mobile web, facebook apps, and can blend alldata into one. You don’t need the multiple analytics platforms.9
5. CRAZY EGGWeb AnalyticsCrazy Egg is an online analytics application that provides you eye-tracking tools. It generatesheatmaps based on where people clicked on your website. Thus, it gives you an idea on whereto focus. It lets you filter data on top 15 referrers, search terms, operating systems, etc.To use Crazy Egg, a small piece of JavaScript code needs to be placed on your site pages.Once the code is on your site, Crazy Egg will track user behavior. Your servers will create areport that shows you the clicks on the pages you are tracking. You can review the reports inthe dashboard within the member’s area of the Crazy Egg site. Setting up Crazy Egg is a quickand easy task.It offers you insights in four different ways: Heatmaps: It gives you a defined picture of where visitors who clicked on your page.Where you need to make changes so as to improve conversions. Scrollmaps: It gives you insights of to what length people scroll down on your page.With Crazy Egg, you can ensure where people leave your page and where to hold themexactly and where to add more to hold them for longer. Overlay Tool: It gives you overlay report of the number of clicks occurring on yourwebsite. You may be able to get more on it.Confetti: Confetti distinguishes clicks for you segmented by referral sources, searchterms, etc. Now, you know the origin of your clicks, so you uncover the traffic sources.Put extra efforts there and you will earn more traffic and revenue. 10
Web AnalyticsInstallationInsert JavaScript code on source code of your website. Crazy Egg will by default track the userbehavior. The servers generate reports providing you the view. Set dashboard to review thereports.11
6. KEY METRICSWeb AnalyticsYou need to find a few key metrics for your business. You have a website and it has a trackingcode in it. Now, you need to make sure what are you going to measure. Analyzing may help youretain your customer and hold them.What to MeasureAudience Pageviews - Pageviews is the number of views of a page. Multiple pageviews arepossible in a single session. If pageviews is improved, it will directly influence AdSenserevenue and average time on website. Bounce rate – Bounce rate reflects the percentage of visitors returning back only aftervisiting one page of your website. It helps you to know how many visitors do so. If thebounce rate of a website increases, its webmaster should be worried. Pages per session – Pages/session is the number of pages surfed in a single session.For example, a user landed on your website and surfed 3 pages, then the websitepages/session is 3. Demographic info – Demographic data shows Age and Gender. With the help ofDemographic Info, you can find the percentage of Male/Female visitors coming to yourwebsite. Analyzing the ratio of this data, you can make a strategy according to genders.Age group data help you find what percentage of age group visiting your website. So,you can make a strategy for highest percentage of age group visitors. Devices – This data shows the devices info. In devices info, you can easily find howmany percentage of visitors come from mobile, how many come from desktop, how manycome from tablets, etc. If mobile traffic is high, then you need to make your websiteresponsive.Acquisition Traffic sources – In the acquisition, you have to check all your sources of the traffic.Major sources of the traffic are:oOrganic traffic is the traffic coming through all search engines (Google, Yahoo,Bing.)oSocial traffic is the traffic coming through all social media platforms (like- Facebook,Twitter, Google , .)oReferral traffic is the traffic coming through where your website is linked.oDirect traffic is the traffic coming directly to your website. For example, typing theurl of your website, clicking on the link of your website given in emails, etc.12
Web AnalyticsOrganicDirectTrafficSourcesSocialReferral Source/Medium – This metrics gives you an idea of the sources from where you aregetting traffic (Google, Yahoo, Bing, Direct, Facebook.).Site Content Landing pages – Landing pages are the pages where the visitors land first (normally,home pages of the websites are the landing pages). With the help of this metrics, youcan find the top pages of the website. Using this metrics, you can analyze how manypages are getting 50% or more traffic of the website. So, you can easily find which typeof content is working for you. Further, based on this analysis, you can plan the nextcontent strategy. Site speed – Site speed is the metrics used for checking page timing (average page loadtime). Using this metrics, you can find which page is taking more time to load, how manypages have high load time, etc.13
7. DATA SOURCESWeb AnalyticsData sources are simply the files created on DBM or feed. The objective of keeping a data sourceis to encapsulate all information in one stack and hide it from the users, e.g., payroll, inventory,etc.Server LogsLog files list actions that take place. They maintain files for every request invoked, for example,the source of visitor, their next action, etc.Server logs is a simple text file that records activity on the server. It is created automaticallyand maintained by server’s data. With the help of a server log file, you can find the activity detailof the website/pages. In activity sheet, you can find the data with IP address, Time/Date, andpages. It gives you insight on the type of browser, country, and origin. These files are only forthe webmasters, not for the website users. The statistics provided by server log is used toexamine traffic patterns segmented by day, week, or a referrer.Visitors' DataVisitors’ data shows the total traffic of the website. It can be calculated by any web analyticstool. With the help of visitors’ data, you can analyze your website improvement and can updateyour servers accordingly. It may comprise of: A top-level view of metricsAge and Gender of visitorsUser behavior, their location and interestsTechnology they are using, e.g., browsers and operating systemsBreakdown of your website on devices other than desktopsUser FlowSearch Engine StatisticsSearch engine statistics show the data that is acquired by organic traffic (as shown in the imagegiven below). If the search engine traffic of a website has improved, then it means the websitesearch ranking for the main keywords has improved. This data also helps you to: Find the revenue generating keywords and the keywords those are typed in search engineby visitors. How different Search Engines affect your data. Where you are lagging and where you need to focus.14
Web AnalyticsConversion FunnelsConversion funnels is the path by which a goal (Product purchase, Lead form done, Servicecontact form submitted, etc.) is completed. It is a series of steps covered by the visitors tobecome customers. It is explained in the “Bertus Engelbrecht’s” image, given below. If morenumbers of visitors are leaving the website without any purchase, then you can use conversionfunnels to analyze the following: Why are they leaving the website? Is there any problem with the conversion path? Is there any broken link in the conversion path or any other feature that is not workingin the conversion path?15
Web AnalyticsConversion funnels help you visualize the following aspects in the form of graphics: The hurdles the users are facing before converting Where the emotional behaviors of the users alter Where the technical bugs become nuisance for the customers16
8. SEGMENTATIONWeb AnalyticsSegmentation is the process that segregates the data to find the actionable items. For example,you can categorize your entire website traffic data as one segment for a “Country,” and one fora specific City.For the users, you can make the segments as one who purchased your products; one who onlyvisited your website, and likewise. During the remarketing, you can target those audiences withthe help of this segment.Data SegmentationData segmentation is very useful to analyze website traffic. In analytics, you can analyze trafficinsight with the help of segmentation. The following image shows how to add segments in Googleanalytics.17
Web AnalyticsFor a website, you can segment total traffic according to Acquisition, Goals, and Channels.Following are the types of acquisition segmentation: Organic Traffic – It shows only the organic traffic of the website. You can find whichsearch engine (Google, Yahoo, Bing, Baidu, Aol, etc.) is working for you. With the help oforganic traffic, you can also find the top keywords that send traffic to your website. Referrals Traffic – This segment shows the total referrals traffic of the website. Withthe help of this segment, you can find the top referrals website that send traffic to yourwebsite. Direct Traffic – This segment helps you find the traffic that visit your website directly. Social Traffic – With the help of social segment, you can analyze social traffic. Howmuch traffic you are getting from social media? In social media, which platform(Facebook, G , Twitter, Pinterest, Stumbleupon, Reddit, etc.) is sending traffic to yourwebsite. With the help of this segment, you can make future social media strategy. Forexample, if Facebook is sending the highest traffic to your website, then you can improveyour Facebook post frequency. Paid Traffic – Paid traffic segment captures traffic through paid channels (GoogleAdWords, Twitter ads.).Analysis Using SegmentationWhen you are done with your segments (collected the data from segments), then the next stepis analysis. Analysis is all about finding the actionable item from the data.ExampleLet’s map a table for ic40k42k40k43k45k47k57k54k60k18
Web 2k3k5k5k4kAnalysis From the above table, you can see that your organic traffic is growing (improved 20k in9 months). Referrals traffic is going down. Social traffic has also improved (1k to 4k). Find out the pages that send traffic in organic traffic. Analyze them. Find out which social platform is working for you.Actionable Add new pages according to organic traffic sender pages. Focus on the social media platform that is sending the highest traffic. Find why your referrals traffic is going down. Is any link removed from the website, whichwas sending traffic earlier?19
9. DASHBOARDSWeb AnalyticsDashboard is an interface showing graphical status of the trends of your business keype
Google Analytics Google Analytics is a freemium analytic tool that provides a detailed statistics of the web traffic. It is used by more than 60% of website owners. Google analytics helps you to track and measure visitors, traffic sources, goals, conversion, and other metrics (as show