Transcription
Trading the Hidden DivergencePresented by Sunil Mangwaniwww.fibforex123.com
Indicators in technical analysis.Indicators along with chart patterns, trend lines,resistance / support levels etc., are an essential part oftechnical analysis.But there is a common misconception, that the use ofindicators can predict the future price action.Logically, if one looks at the calculations of the technicalindicators, they are based on the price movement, sothey would obviously mirror the price movement.When price rallies, the underlying momentum in the pricecauses the indicator to rally as well, and the same applieswhen price starts falling.So why would one expect the indicator to predict thesubsequent price moves, when it would mirror the price?Hence, very few indicators have characteristics which canbe defined as leading.Presented by Sunil Mangwaniwww.fibforex123.com
DivergenceOne such characteristic is the “Divergence” set-up which isoften considered to be an effective and leading indicatorof price movement.Divergences occur when there is a discrepancy between theprice and a technical indicator.We can define it as the failure of the indicator to confirmthe higher high or lower low of the price. This discrepancyor divergence is usually observed on the oscillator type ofindicators, such as the RSI, MACD, CCI, Slow Stochasticetc.(In fact, these oscillators give their most valid signals whentheir readings diverge from the price.)Hence an early indication of the change in momentum isgiven by the divergence set-up, and a change inmomentum is often the primary indication for a shift intrend.Presented by Sunil Mangwaniwww.fibforex123.com
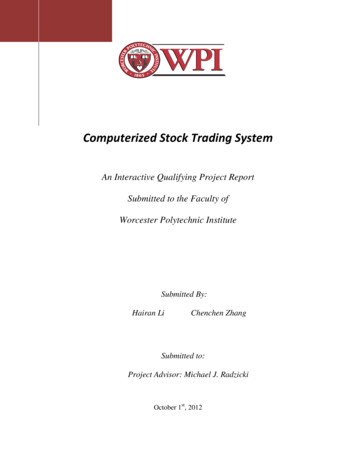
Regular DivergenceThe most common type is the Classic or Regular Divergencewhich is a reversal pattern.It can be defined as –Higher highs in price and lower highs in the oscillator whichindicates a trend reversal from up to down. This is knownas the Bearish Divergence.Lower lows in price and higher lows in the oscillator whichindicates a trend reversal from down to up. This is knownas the Bullish Divergence.The Regular Divergence indicates that the underlyingmomentum in the price may be decreasing and that abottom or top could be near.Presented by Sunil Mangwaniwww.fibforex123.com
Regular DivergenceChart image of regular divergencePresented by Sunil Mangwaniwww.fibforex123.com
Regular DivergenceChart of regular divergencePresented by Sunil Mangwaniwww.fibforex123.com
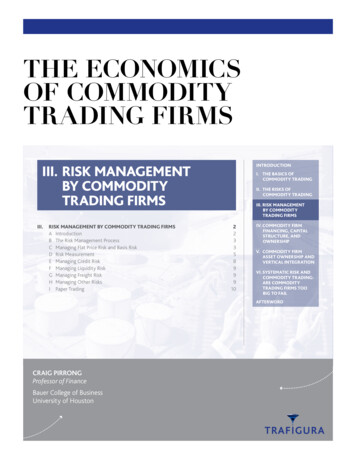
Hidden DivergenceWhile the Regular Divergence is more commonly used,there is another type of divergence which is not used asregularly, but is far more effective.It is called a Hidden Divergence, which is also a discrepancybetween the price and an indicator, except that this is acontinuation pattern.It can be defined as –Bearish Hidden Divergence - Lower highs in price andhigher highs in the oscillator which indicate aconfirmation of the price trend which is down.Bullish Hidden Divergence - Higher lows in price and lowerlows in the oscillator which indicates a confirmation of theprice trend which is up.Presented by Sunil Mangwaniwww.fibforex123.com
Hidden DivergenceChart image of hidden divergencePresented by Sunil Mangwaniwww.fibforex123.com
Hidden DivergenceHidden Divergences are the opposite of RegularDivergences, but offer a greater trade potential, sincethey pinpoint entries which are in the direction of thetrend.Since this is a pattern which gets a trader into a prevailingtrend, it has a higher probability of success.The advantage of this set-up is that it gives the trader theprecise entry, stop and exit levels within a continuingtrend, which is a far better proposition than “catching afalling knife”.And the trader is following the Golden Rule – “The trend isyour friend.”Presented by Sunil Mangwaniwww.fibforex123.com
Hidden DivergencePresented by Sunil Mangwaniwww.fibforex123.com
Hidden DivergenceHidden divergences are often found in a trend, and one cancall it the “Rubber band” or the “Catapult” effect of theindicator.In an existing trend, price makes a pull-back, but theindicator makes a larger pull-back, thus stretchingbeyond the mean. We would expect the indicator torevert back to its mean, which it does with strongmomentum.In the process, price snaps back to its original trend, whichgive way to strong moves.Getting a proper entry into such moves can give excellentprofit targets.We can say that we have the wind in our sails, for suchtrades.Presented by Sunil Mangwaniwww.fibforex123.com
The effectiveness of divergencesPresented by Sunil Mangwaniwww.fibforex123.com
Trading the hidden divergenceIdentifying a valid divergence pattern is one thing, buttrading the set-ups is another.The trader has to have a proper entry, manage the tradeand identify a correct exit point.The only way to survive in the business of trading is to havean iron clad trade plan, with precisely defined entries,exits and stops.Further one must have pre-defined money managementrules, the patience to wait for the set-up, and thediscipline to follow it to the “T”.Let us use some other tools to effectively trade this set-upPresented by Sunil Mangwaniwww.fibforex123.com
Fibonacci ratiosFibonacci ratios are a very popular tool among technicaltraders and are based on a particular series of numbersidentified by mathematician Leonardo Fibonacci in thethirteenth century.The Fibonacci sequence of numbers is as follows:0, 1, 1, 2, 3, 5, 8, 13, 21, 34, 55, 89, 144, etc.Each term in this sequence is simply the sum of thetwo preceding terms and sequence continues infinitely.The remarkable characteristic of this numerical sequence isthat each number is approximately 1.618 times greaterthan the preceding number.This common relationship between every number in theseries is the foundation of the common ratios used in theFibonacci studies.Presented by Sunil Mangwaniwww.fibforex123.com
Applying the Fibonacci ratiosFor some reason, these ratios seem to play an importantrole in the financial markets, just as they do in nature,and can be used to determine critical points that causeprice to reverse.Price has an uncanny way of respecting Fibonacci ratio’s,often quite precisely. Hence one can use the Fib ratios toascertain the correct technical levels.Price action is never random, and every wave leaves behindthe clues for the next move. We can thus, use theprevious price action to determine the anticipated pricemovement.Presented by Sunil Mangwaniwww.fibforex123.com
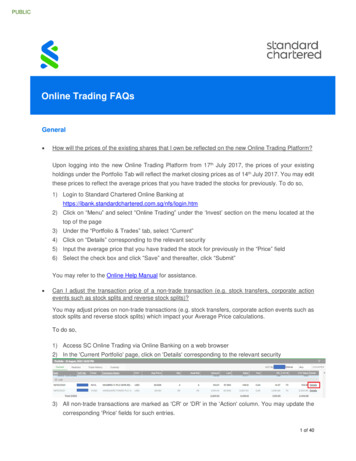
Fibonacci FansThe Fibonacci fans are a charting technique consisting ofdiagonal lines that use Fibonacci ratios to help identifykey levels of support and resistance.Fibonacci fans are created by first drawing a trend linethrough two points (usually the high and low), and thenby dividing the vertical distance between the two pointsby the key Fibonacci ratios.The result of these divisions each represents a point withinthe vertical distance. The 'fan' lines are then created bydrawing a line from the leftmost point to each of thenumbers representing a Fibonacci ratio.Presented by Sunil Mangwaniwww.fibforex123.com
Fibonacci FansPresented by Sunil Mangwaniwww.fibforex123.com
Applying Fibonacci FansThe fan ratios that we use have 5 Fibonacci levels –38.2%; 50.0%; 61.8%; 76.4% and 88.6%.Of all the ratios, the 88.6 level holds a lot of importance.This is the level, from where price has a very highprobability of retracement.We can thus call the 88.6 fan fib level as “The BarrierLevel of the Fib Fans.”In case of an up trend, we plot the Fib fans on the existingup trend from the swing low to the swing high (fromwhere price started the pull-back down)If the pull-back is held within the Fib fans - and specificallyas mentioned before - if price does not break the 88.6fan level or finds support at that level, then the indicationis that price should resume the up move again.Presented by Sunil Mangwaniwww.fibforex123.com
Applying Fibonacci FansPresented by Sunil Mangwaniwww.fibforex123.com
Applying the fans to the hidden divg.In case of a hidden divergence, we first confirm themaximum level of retracement.In an ideal set-up, the fans offer strong support levels, fromwhere price should continue with the existing up trend.The maximum level of the pull-back should be containedwithin the 88.6 fan level.In case of a strong trend, the 76.4 or the 61.8 level wouldalso hold the price move.But the 88.6 level becomes an important level.If price breaks this level to the downside, then the hiddendivergence is negatedPresented by Sunil Mangwaniwww.fibforex123.com
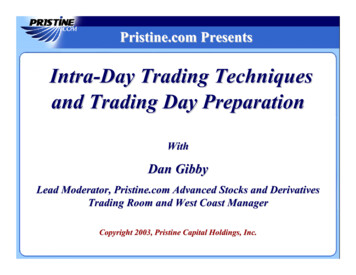
Trading the hidden divergence setup.The first and the most important point is to determine if thepull-back has been completed.Here the support levels of the Fibonacci fans becomeimportant, and we can also use candlestick charts to seeif we get some reversal signs.As we can see in this chart example, price found support atthe 76.4 fan level, which gave us a strong indication ofthe resumption of the trend.We then apply the following rules for the trade set-upEntry into a long trade – On the break of the trend line, oron the high of the reversal bar.Stop to be placed – below the D3 level, which is a strongsupport zone.Presented by Sunil Mangwaniwww.fibforex123.com
Trading the hidden divergence setup.Presented by Sunil Mangwaniwww.fibforex123.com
Price targetsWhile an entry into a trade is the initial step of a trade, it isthe exit which is more important.One must have the exit levels pre-defined, to avoid thesituation of a winning trade turn into a losing one.The most effective way is to determine a target zone, whichcan be derived by a confluence of different factors.Let us have a look at two different ways to determine theprice objectives –1.) Measured moves.2.) Fibonacci Expansions.Presented by Sunil Mangwaniwww.fibforex123.com
Measured movesAs we mentioned earlier, price moves are never random andprice does have a definite pattern in its movement. Thereis always a method behind the madness.Measured moves are a very simple yet effective way todetermine further price movements.In this case, we measure the vertical distance of the pullback (from D2 to D3) and add this distance to the high ofD2.Price has a very probability of achieving this objective,which becomes our minimum target level.Presented by Sunil Mangwaniwww.fibforex123.com
Measured movesPresented by Sunil Mangwaniwww.fibforex123.com
Fibonacci ExpansionsFibonacci levels can be used effectively to determine thetarget objectives.But a trader must know which ratio to use for whichparticular situation.Just like the different tools in a carpenter’s tool box, whereevery instrument has a specific purpose, the fib ratios toohave a specific use for different situations.For Hidden divergences, the Fibonacci expansions are idealfor calculating the price targets, since the pull-back givesus 3 points to plot the Fibonacci ratios on.As we can see in the chart, the Fib Expansion level of 127.2coincided precisely with the earlier ‘measured move’target.Presented by Sunil Mangwaniwww.fibforex123.com
Fibonacci ExpansionsPresented by Sunil Mangwaniwww.fibforex123.com
Trade Plan“Plan Your Trade and Trade Your Plan.“There are absolutely no guarantees in trading, and you willnever be correct all of the time.But you must have a Trading plan, which is often thedividing line between success and failure.Traders who carefully plan each trade, have a much betterchance of making money than those who don't.In fact, the simple act of drafting a plan can significantlyincrease the odds that your trade will be profitable.An ideal Trading Plan must incorporate the concept of 3M’sPresented by Sunil Mangwaniwww.fibforex123.com
The 3 M’s – Money, Mind & MethodThese are the holy trinity of trading, and it's important thattraders recognize all three before they can achieveconsistent success.If one were to distribute the 3M’s on a scale of 1 to 10, thenMoney - The Money Management would account for 50%;Mind - Psychology of trading would account for 30%;Method - Technical analysis would account for only 20%.Hence it is imperative, that besides the Method, one mustgive more importance to Money & Mind.Presented by Sunil Mangwaniwww.fibforex123.com
Money ManagementThe first priority of a trader is the preservation of capital,which is the trader’s bloodline.Traders Golden Rule No.1 - “No capital, no trading”.Preservation of capital comes from controlling the lossesand letting the profits run.Secondly one must accept the fact, that one cannot predictor control the market. Once you have entered a trade,you have absolutely no control over it.But you can control what is within your limits – the amountof capital that you risk on a trade.Traders Golden Rule No.2 - “Take care of your losses, and the profits will take care of themselves”Always maintain the correct position size and the do notrisk higher amounts of capital and keep a proper Risk-toReward ratio.Presented by Sunil Mangwaniwww.fibforex123.com
Money ManagementA trader is in this profession to make money, so one musthave some compensation for putting in the time andeffort.If one takes a small amount of profit from every trade, notonly does it increase your capital, but it also reduces thepsychological pressure.Hence one must take initial profits from a trade as soon asit goes in your favourTraders Golden Rule No.3 - “Never let a winning trade turn into a losing trade”Presented by Sunil Mangwaniwww.fibforex123.com
MindDefine the exact conditions that you will get you in a trade.If price does not fulfil those conditions, do not trade.Don’t enter a trade only because price is moving.You must ask yourself whether it satisfies the conditions inyour trade plan.Have the patience to wait for your set-up to occur, and onceit does, have the discipline to follow your trading plan tothe “T”Presented by Sunil Mangwaniwww.fibforex123.com
ConclusionFinally, if you don’t have a plan, it simply means that youare gambling & not treating this as a business.And if you do have a plan, this factor alone puts you in thetop 20% of the profitable tradersI hope this presentation can help you gain that extra ‘Edge’over the market.Visit my website for more educational and practicalinformation on the correct use of technical analysis.We don’t just teach, but also implement the knowledge inthe live market.www.fibforex123.comPlease feel free to contact me about further information at:sunil@fibforex123.comshellcon@eth.netPresented by Sunil Mangwaniwww.fibforex123.com
Trading the hidden divergence Identifying a valid divergence pattern is one thing, but trading the set-ups is another. The trader has to have a proper entry, manage the trade and identify a correct exit point. The only way to survive in the business of trading is to have an iron clad trade plan, with precisely defined entries, exits and stops.