Transcription
2020 Home Buyers andSellers Generational TrendsReportNational Association of REALTORS Research GroupMarch, 2020
VINCE MALTAPresidentCHARLIE OPPLERPresident-ElectLESLIE ROUDA SMITH, ABR, CRS, PMN, CRB, EPRO, CIPS,AHWD, C2EXFirst Vice PresidentJOHN FLOR, ABR, CRS, GRI, EPRO, RSPS, RSSTreasurerJOHN SMABY, CRB, GRIImmediate Past President2020 NAR LeadershipTeamMABEL GUZMÁNVice President of Association AffairsCHRISTINE E. HANSEN, GRIVice President of AdvocacyBOB GOLDBERGChief Executive Officer2020 NAR Home Buyer and Seller Generational Trends2
Lawrence Yun, Ph.D.Chief Economist and Senior Vice PresidentJessica Lautz, Dr. of Real EstateVice President, Demographics and Behavioral InsightsBrandi SnowdenDirector, Member and Consumer Survey ResearchMeredith DunnResearch ManagerNAR Research StaffMatt ChristophersonResearch Survey Analyst2020 NAR Home Buyer and Seller Generational Trends3
2020 Home Buyers and SellersGenerational Trends ReportTable of ContentsIntroduction5Chapter 1: Characteristics of Home Buyers10Chapter 2: Characteristics of Homes Purchased31Chapter 3: The Home Search Process50Chapter 4: Home Buying and Real Estate Professionals63Chapter 5: Financing the Home Purchase81Chapter 6: Home Sellers and Their Selling Experience97Chapter 7: Home Selling and Real Estate Professionals126Methodology1412020 NAR Home Buyer and Seller Generational Trends4
Introduction2020 Home Buyers and SellersGenerational Trends Report2020 NAR Home Buyer and Seller Generational Trends5
AGE OF HOME BUYERSSilent GenerationYounger BoomersOlder Gen Y /Millennials:1925-19451955-19641980-1989Gen Z1999 to Present19202020Older BoomersGen X1946-19541965-1979Younger Gen Y /Millennials1990-19982020 NAR Home Buyer and Seller Generational Trends6
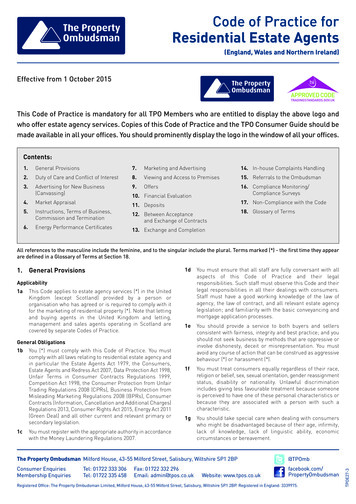
SHARE OF BUYERS AND SELLERS BY GENERATIONBuyersSellers**Gen Zers:13%Younger Gen Y/Millennials:3%25%Older Gen Y/Millennials:19%23%22%Gen Xers:18%Younger Boomers:22%15%Older Boomers:23%6%Silent Generation:8%%5%10%15%20%25%30%*Less than 1 percent2020 NAR Home Buyer and Seller Generational Trends7
IntroductionSince 2013, the National Association of REALTORS has written theHome Buyers and Sellers Generational Trends Report. This reportprovides insights into differences and similarities across generations ofhome buyers and sellers. The home buyer and seller data is taken fromthe annual Profile of Home Buyers and Sellers.Continuing from last year, in this year’s report is the segmentation of theMillennial generation: buyers 22 to 29 years (Younger Millennials/GenYers) and buyers 30 to 39 years (Older Millennials/Gen Yers). Millennialsstill made up the largest share of home buyers at 38 percent: OlderMillennials at 25 percent and Younger Millennials at 13 percent of theshare of home buyers. Eighty-six percent of Younger Millennials and 52percent of Older Millennials were first-time home buyers, more thanother age groups. Older Millennials had the highest share of marriedcouples (67 percent), while Younger Millennials had the highest share ofunmarried couples (21 percent) buying homes. Older Millennials werethe most educated age group, with 79 percent holding at least abachelor’s degree, followed by Younger Millennials. They were mostlikely to purchase a previously-owned home and a townhouse.Convenience to their job and commuting costs were both moreimportant to this group, and they were most likely to find their homeonline and to use internetin their home search.Buyers 40 to 54 (Gen Xers) consisted of 23 percent of recent homebuyers. This group continues to be the highest earning home buyers2020 NAR Home Buyer and Seller Generational Trendswith a median income of 110,900 in 2018. Correspondingly, buyers 40 to54 purchased the second-most expensive homes at a median homeprice of 278,000. They also bought the largest homes in size at amedian of 2,000 square feet. They came in as a close second behindOlder Millennials as being most likely to be married and to havechildren under the age of 18 in their home. Gen Xers moved the shortestdistance, along with Older Millennials, at a median of 10 miles. Buyers 40to 54 years were also the most racially and ethnically diverse populationof home buyers, with 24 percent identifying they were a race other thanWhite/Caucasian.For the report, buyers 55 to 64 (Younger Baby Boomers) and buyers 65to 73 (Older Baby Boomers) were broken into two separate categoriesas they have differing demographics and buying behaviors. Buyers 55to 64 consisted of 18 percent of recent buyers and buyers 65 to 73consisted of 15 percent of recent buyers. Buyers 55 to 64 purchased foran array of reasons such as the desire to own a home of their own, thedesire to be closer to friends and family, and the desire to live in abetter area. Younger Boomers were also the least educated homebuyer age group. They searched the longest for their homes at amedian of 12 weeks and viewed a median of 10 homes. Buyers 65 to 73were the age group with the highest share of single females at 22percent, and were the least likely to have children under 18 in theirhome. They purchased newly constructed homes more often than anyother age group. Buyers 65 to 73 typically moved the furthest distanceat a median of 40 miles.8
IntroductionBuyers 74 to 94 (The Silent Generation) represented the smallest share ofbuyers at six percent. As most of these buyers were likely to have retiredor scaled back their work demands, they had the lowest medianhousehold incomes. They were most likely to purchase to be closer tofriends and family and for a smaller home. Buyers 74 to 94 were leastlikely to purchase a detached single-family home and most likely topurchase a multi-generational home or senior-related housing and theytended to purchase new homes. They were the least likely tocompromise in their home search. This age group also had the highestpercentage of military veterans at 49 percent.Buyers continue to finance their home purchase similar to years past.Eighty-six percent of home buyers financed their home purchase—ashare that decreases as the age of the buyer increases. Younger buyerscontinue to depend on savings for their downpayment, while olderbuyers use proceeds from the sale of their previous residence. Amongthose who did have debt, debt hindered their ability to save for adownpayment by a median of four years and came primarily fromstudent loan debt. In fact, 46 percent of Younger Millennials reportedhaving student loan debt with a median loan balance of 26,000,compared to 38 percent of Older Millennials with a median of 34,000.While only 23 percent of buyers 40 to 54 had student loan debt, theyhad a median balance of 30,000. This may be due to not only theirpersonal educational loans, but accumulating debt from their children’s2020 NAR Home Buyer and Seller Generational Trendseducation loans. It was most common for buyers to cut spending onluxury/non-essential items, and on entertainment to save for their homepurchase.Among home sellers, Older Boomers (sellers 65 to 73 years) made upthe largest shares of sellers at 23 percent. Sellers 54 years and youngercontinue to trade up to a larger and more expensive home whilestaying relatively close by. Sellers 55 years and older often purchased asimilarly-sized, but less expensive home than they sold by movingfurther away. Sellers stayed in their previous home for a median of 10years before selling, with a median of five years among sellers 30 to 39years and a median of 19 years among sellers 74 and older. Recentlysold homes were typically on the market for a median of three weeksand sellers made a median of 60,000 in equity from their sale.All generations of buyers continued to utilize a real estate agent orbroker as their top resource to help them buy and sell their home. Whilethe internet is increasingly incorporated as an important tool in theprocess, buyers needed the help of a real estate professional to helpthem find the right home, negotiate terms of sale, and help with pricenegotiations. Sellers, as well, turned to professionals to help markettheir home to potential buyers, sell within a specific timeframe, andprice their home competitively.9
Chapter 1Characteristics of Home Buyers2020 NAR Home Buyer and Seller Generational Trends10
Characteristics of Home Buyers First-time buyers made up 33 percent of all home buyers, the same aslast year. Fifty-two percent of buyers 30 to 39 years and 88 percent ofbuyers 29 years and younger were first-time home buyers. Following,23 percent of buyers 40 to 54 years were also first-time home buyers. At 25 percent, buyers 30 to 39 continue to be the largest generationalgroup of buyers with a median age of 34, followed by buyers 40 to 54at 23 percent with a median age of 47. Buyers between the ages of 40 to 54 had the highest householdincomes of any generation at 110,900 in 2018, followed by buyersbetween 30 to 39 that had a median income of 102,800. Sixty-one percent of recent buyers were married couples, 17 percentwere single females, nine percent were single males, and nine percentwere unmarried couples. The highest percentage of single femalebuyers was found in the 65 to 73 age group at 22 percent. The highestshare of unmarried couples were found in the 22 to 29 age group at 21percent.Thirty-five percent of all buyers had children under the age of 18 livingat home. Sixty-one percent of buyers between 30 to 39 years had atleast one child under the age of 18 residing in the home.2020 NAR Home Buyer and Seller Generational Trends Twelve percent of home buyers purchased a multi-generational hometo take care of aging parents, because children over the age of 18 weremoving back, and for cost savings. Eighteen percent of buyers aged74 to 94 purchased a multi-generational home. Buyers 55 to 64 yearscomprised the second largest share at 16 percent. The 40 to 54 age group continues to be the most racially diversegroup of buyers in 2019. Twenty-one percent of this group of buyersidentified as Hispanic / Latino, Black / African American, or Asian /Pacific Islander. The 30 to 39 age group was the most educated group, with 79percent holding at least a bachelor’s degree or higher. The next mosteducated was the 22 to 29 age group. The most common reasons for recently purchasing a home differedbetween the generations. For all three groups under the age of 65years, the main reason for purchasing was the desire to own a homeof their own. Among the 63 and older age groups, the desire to becloser to friends and family was the top reason to purchase. Buyersbetween 74 and 94 years also purchased for the desire for a smallerhome.11
Characteristics of Home BuyersExhibit 1-1 AGE OF HOME BUYERSExhibit 1-2 HOUSEHOLD INCOME OF HOME BUYERSExhibit 1-3 ADULT COMPOSITION OF HOME BUYER HOUSEHOLDSExhibit 1-4 NUMBER OF CHILDREN UNDER THE AGE OF 18 RESIDING IN HOUSEHOLDExhibit 1-5 HOME PURCHASED WAS A MULTI-GENERATIONAL HOME (WILL HOME ADULT SIBLINGS, ADULT CHILDREN,PARENTS, AND/OR GRANDPARENTS)Exhibit 1-6 HOME BUYER GENDERExhibit 1-7 HOME BUYER IDENTIFY AS TRANSGENDERExhibit 1-8 HOME BUYER SEXUAL ORIENTATIONExhibit 1-9 RACE/ETHNICITY OF HOME BUYERSExhibit 1-10 HOME BUYER EDUCATIONExhibit 1-11 PRIMARY LANGUAGE SPOKEN IN HOME BUYER HOUSEHOLDExhibit 1-12 NATIONAL ORIGIN OF HOME BUYERSExhibit 1-13 SELF OR SPOUSE/PARTNER IS ACTIVE MILITARY OR VETERANExhibit 1-14 FIRST-TIME HOME BUYERS IN AGE GROUPExhibit 1-15 PRIOR LIVING ARRANGEMENTExhibit 1-16 PRIMARY REASON FOR PURCHASING A HOMEExhibit 1-17 PRIMARY REASON FOR THE TIMING OF HOME PURCHASEExhibit 1-18 OTHER HOMES OWNED2020 NAR Home Buyer and Seller Generational Trends12
AGE OF HOME BUYERSExhibit 1-1Median Agein Group(Percentage Distribution)Gen Zers: 21 years and younger21*Younger Gen Y/Millennials: 22 to 29 years2713%Older Gen Y/Millennials: 30 to 39 years3425%Gen Xers: 40 to 54 years4723%Younger Boomers: 55 to 64 years6018%Older Boomers: 65 to 73 years6815%Silent Generation: 74 to 94 years776%%5%10%15%20%25%30%*Less than 1 percent2020 NAR Home Buyer and Seller Generational Trends13
HOUSEHOLD INCOME OF HOME BUYERSExhibit 1-2(Percentage Distribution)AGE OF HOME BUYERAll Buyers22 to 2930 to 3940 to 5455 to 6465 to 7374 to 94Less than 25,0003%5%1%1%5%5%4% 25,000 to 34,99943324613 35,000 to 44,99969447610 45,000 to 54,999887771011 55,000 to 64,99971165899 65,000 to 74,9998977896 75,000 to 84,99981087689 85,000 to 99,9991115121081010 100,000 to 124,99915171816131312 125,000 to 149,999961011976 150,000 to 174,9996377655 175,000 to 199,9994156521 200,000 or more11113151285 93,200 80,000 102,800 110,900 94,400 81,200 70,000Median income(2018)2020 NAR Home Buyer and Seller Generational Trends14
ADULT COMPOSITION OF HOME BUYER HOUSEHOLDSExhibit 1-3(Percentage Distribution)Married couple80%Single female67%60%Single male64%61%Unmarried coupleOther65%63%61%50%40%20%21%17%14%9% 9%0%All Buyers22 to 292%1%30 to 392020 NAR Home Buyer and Seller Generational Trends11%9% 8%6%5%3%17%13%12%11%22%21%40 to 5421%10%4% 3%55 to 643% 2%65 to 737%3% 4%74 to 9415
NUMBER OF CHILDREN UNDER THE AGE OF 18 RESIDINGIN HOUSEHOLDExhibit 1-4(Percentage Distribution of Households)NoneOneTwoThree or more100%95%90%94%80%67%65%60%47%39%40%20%0%15% 13%22% 24%20%7%All Buyers9%22 to 2915%22% 20%11%3%30 to 392020 NAR Home Buyer and Seller Generational Trends40 to 546%3% 1%55 to 642% 1% 2%65 to 731%4%1%74 to 9416
HOME PURCHASED WAS A MULTI-GENERATIONAL HOME(WILL HOME ADULT SIBLINGS, ADULT CHILDREN,PARENTS, AND/OR GRANDPARENTS)Exhibit 1-5(Percent of Respondents)AGE OF HOME BUYERAll Buyers22 to 2930 to 3940 to 5455 to 6465 to 7374 to /relatives over 18 moving back into thehouse209152334215Cost savings18302518141710To spend more time with aging parents161330181457Children/relatives over 18 never left home14615221672Wanted a larger home that multiple incomescould afford together112811118816Other106108101614None of the above25242217223945Multi-generational householdReasons for purchase:Health/Caretaking of aging parents2020 NAR Home Buyer and Seller Generational Trends17
HOME BUYER GENDERExhibit 1-6(Percentage Distribution)FemaleMaleNon-binary/third genderPrefer to self-describePrefer not to %44%40%37%30%20%10%0%1% * 2%All Buyers2%*22 to 292%**30 to 392%** 1%40 to 54** 1%55 to 641% * 1%65 to 732%* 1%74 to 94*Less than 1 percent2020 NAR Home Buyer and Seller Generational Trends18
HOME BUYER IDENTIFY AS TRANSGENDERExhibit 1-7(Percentage Distribution)Identify as transgender98%100%Do not identify as transgender98%98%Prefer not to %All Buyers1%*22 to 292%*30 to 39*2%40 to 541%*55 to 64*3%65 to 73**74 to 94*Less than 1 percent2020 NAR Home Buyer and Seller Generational Trends19
HOME BUYER SEXUAL ORIENTATIONExhibit 1-8(Percentage Distribution)AGE OF HOME BUYERAll Buyers22 to 2930 to 3940 to 5455 to 6465 to 7374 to 9491%89%90%92%92%92%95%Gay or lesbian3233321Bisexual1421***Prefer to self-describe121*111Prefer not to answer5354452Heterosexual or straight*Less than 1 percent2020 NAR Home Buyer and Seller Generational Trends20
RACE / ETHNICITY OF HOME BUYERSExhibit 1-9(Percent of Respondents)AGE OF HOME BUYERAll Buyers22 to 2930 to 3940 to 5455 to 6465 to 7374 to /Pacific 433223White/CaucasianNote: Respondents were permitted to select as many races and ethnicities as they feltapplicable.The percentage distribution may therefore sum to more than 100 percent.2020 NAR Home Buyer and Seller Generational Trends21
HOME BUYER EDUCATIONExhibit 1-10(Percentage Distribution)AGE OF HOME BUYERAll Buyers22 to 2930 to 3940 to 5455 to 6465 to 7374 to 94Less than high school1%1%1%2%**2%High school diploma19181220262022Associate's degree1210813151312Bachelor's degree31443530262419Some graduate work875491213Master's degree/MBA/lawdegree23172925202423Doctoral degree741065610*Less than 1 percent2020 NAR Home Buyer and Seller Generational Trends22
PRIMARY LANGUAGE SPOKEN IN HOME BUYERHOUSEHOLDExhibit 1-11(Percentage %80%60%40%20%4%0%All Buyers5%4%22 to 2930 to 396%40 to 541%55 to 642%65 to 73*74 to 94*Less than 1 percent2020 NAR Home Buyer and Seller Generational Trends23
NATIONAL ORIGIN OF HOME BUYERSExhibit 1-12(Percentage Distribution)Born in U.S.100%93%91%Not born in U.S.93%91%97%93%87%80%60%40%20%9%0%All Buyers9%7%22 to 2930 to 392020 NAR Home Buyer and Seller Generational Trends13%7%40 to 5455 to 647%65 to 733%74 to 9424
ACTIVE MILITARY/VETERANSExhibit 1-13(Percentage Distribution)Active in the Armed %60%49%50%51%40%31%30%20%20%10%0%13%3%All Buyers5%7%22 to 294%30 to 3922%18%4%40 to 54**55 to 64*65 to 7374 to 94*Less than 1 percent2020 NAR Home Buyer and Seller Generational Trends25
FIRST-TIME HOME BUYERS IN AGE GROUPExhibit 1-14(Percentage Distribution)100%88%80%60%40%52%33%23%20%0%13%All Buyers22 to 2930 to 392020 NAR Home Buyer and Seller Generational Trends40 to 5455 to 646%5%65 to 7374 to 9426
PRIOR LIVING ARRANGEMENTExhibit 1-15(Percentage Distribution)AGE OF HOME BUYERAll Buyers22 to 2930 to 3940 to 5455 to 6465 to 7374 to 9448%12%34%50%62%76%81%Rented an apartment or house38555139291812Lived with parents/relatives/friends, paidrent61374423Lived with parents/relatives/friends, didnot pay rent62064333Rented the home ultimately purchased2123212Owned previous homeNote: After selling their previous home, buyers may have rented a home or apartment before purchasing their next home.A first-time buyer could have acquired ownership of their previous home (as an inheritance or gift, for example) withouthaving been the buyer of the home. Thus, a first-time buyer could have owned a home prior to their first home purchase.2020 NAR Home Buyer and Seller Generational Trends27
PRIMARY REASON FOR PURCHASING A HOMEExhibit 1-16AGE OF HOME BUYER(Percentage Distribution)All Buyers22 to 2930 to 3940 to 5455 to 6465 to 7374 to 9429%60%40%26%17%7%6%Desire for larger home951413553Desire to be closer to family/friends/relativesChange in family situation (e.g. marriage, birth ofchild, divorce, etc.)Desire for a home in a better area9225142224898976472671095Job-related relocation or move7481161*Desire for smaller home6*1391124Retirement5**191410Establish a household36511**Desire to be closer to job/school/transit32463*1Desire for a newly built or custom-built home2*12224Affordability of homes2221222Financial security2223222Desire for better home for pet(s)1221111Purchased home for family member or relative11*1121Tax benefits1**1111Desire for vacation home/investment propertyGreater number of homes on the market forsale/better choiceOther (Specify):*11111******1*815891213Desire to own a home of my own*Less than 1 percent2020 NAR Home Buyer and Seller Generational Trends28
PRIMARY REASON FOR THE TIMING OF HOME PURCHASEExhibit 1-17(Percentage Distribution)AGE OF HOME BUYERAll Buyers22 to 2930 to 3940 to 5455 to 6465 to 7374 to 9450%58%53%46%51%47%45%Did not have much choice, had topurchase when did17151721161316It was the best time for because ofavailability of homes for sale12121114111411It was the best time for because ofimproved affordability of homes5564453It was the best time for because ofmortgage financing options available3323323Wish had waited3233223Other114710131820It was just the right time, was ready tobuy a home2020 NAR Home Buyer and Seller Generational Trends29
OTHER HOMES OWNEDExhibit 1-18(Percent of Respondents)AGE OF HOME BUYERAll Buyers22 to 2930 to 3940 to 5455 to 6465 to 7374 to 9483%94%88%79%71%76%74%One or more investment properties838101189Previous homes that buyer is trying tosell3*13446Primary residence3334955One or more vacation homes3*12777Other2**2332Recently purchased home only*Less than 1 percent2020 NAR Home Buyer and Seller Generational Trends30
Chapter 2Characteristics of HomesPurchased2020 NAR Home Buyer and Seller Generational Trends31
Characteristics of Homes Purchased Buyers of new homes made up a 13 percent share and buyers ofpreviously owned homes made up 87 percent. Eighteen percentof buyers 65 to 76 years bought new homes, followed by buyers74 to 94 years at 16 percent. Most recent buyers who purchased new homes were looking toavoid renovations and problems with plumbing or electricity at39 percent. Buyers who purchased previously owned homeswere most often considering a better value at 33 percent. Theoldest and youngest age groups (74 to 94, and 22 to 29) weremost likely to purchase a new home for the amenities of newconstruction communities, though a small percentage of buyersaged 22 to 29 purchased new homes. The most common type of home purchase continued to be thedetached single-family home, which made up 83 percent of allhomes bought. It was most common among all generations.Buyers 22 to 29 purchased townhomes at higher shares thanother age groups. Senior-related housing accounted for 12 percent of buyers overthe age of 50; that number was 10 percent for buyers 55 to 64years and 26 percent for buyers 74 years and older.2020 NAR Home Buyer and Seller Generational Trends There was only a median of 15 miles from the homes that recentbuyers previously resided in and the homes that they purchased.The median distance moved was highest among buyers 65 to 73at 40 miles, while the lowest was among those 30 to 54 at 10miles. The typical home recently purchased was 1,850 square feet, hadthree bedrooms and two bathrooms, and was built in 1990. Thesize of homes for buyers 40 to 54 years was typically larger at2,000 square feet, compared to buyers 22 to 29 at 1,600 and 74years and older at a median of 1,750. For buyers 54 and younger,the median home was built before 1990; for ages 55 and older,the median was 1992 or newer. Heating and cooling costs were the most importantenvironmental features for recent home buyers, with 35 percentfinding these features very important. For buyers 22 to 29 years, commuting costs were very importantat 45 percent. Compared to buyers 65 to 73, windows, doors, andsiding were also very important at 38 percent. Overall, buyers expected to live in their homes for a median of 15years. For buyers 39 years and younger, the expected length oftime was only 10 years compared to 20 years for buyers 40 to 73years.32
Characteristics of Homes PurchasedExhibit 2-1 NEW AND PREVIOUSLY OWNED HOMES PURCHASEDExhibit 2-2 WHY NEW AND PREVIOUSLY OWNED HOMES PURCHASEDExhibit 2-3 TYPE OF HOME PURCHASEDExhibit 2-4 LOCATION OF HOME PURCHASEDExhibit 2-5 SENIOR-RELATED HOUSING BY TYPE OF HOME PURCHASED AND LOCATIONExhibit 2-6 DISTANCE BETWEEN HOME PURCHASED AND PREVIOUS RESIDENCEExhibit 2-7 FACTORS INFLUENCING NEIGHBORHOOD CHOICEExhibit 2-8 PRICE OF HOME PURCHASEDExhibit 2-9 PURCHASE PRICE COMPARED WITH ASKING PRICEExhibit 2-10 SIZE OF HOME PURCHASEDExhibit 2-11 NUMBER OF BEDROOMS AND BATHROOMSExhibit 2-12 YEAR HOME BUILTExhibit 2-13 ENVIRONMENTALLY FRIENDLY FEATURES CONSIDERED "VERY IMPORTANT"Exhibit 2-14 CHARACTERISTICS OF HOME ON WHICH BUYER COMPROMISEDExhibit 2-15 EXPECTED LENGTH OF TENURE IN HOME PURCHASEDExhibit 2-16 FACTORS THAT COULD CAUSE BUYER TO MOVE2020 NAR Home Buyer and Seller Generational Trends33
NEW AND PREVIOUSLY OWNED HOMES PURCHASEDExhibit 2-1(Percentage Distribution)New100%91%87%Previously Owned90%86%85%84%82%80%60%40%20%0%13%All Buyers9%10%22 to 292020 NAR Home Buyer and Seller Generational Trends30 to 3914%40 to 5415%55 to 6418%65 to 7316%74 to 9434
WHY NEW AND PREVIOUSLY OWNED HOMESPURCHASEDExhibit 2-2(Percent of Respondents)New Home:Avoid renovations or problems withplumbing or electricityAbility to choose and customizedesign featuresAmenities of new home constructioncommunitiesGreen/energy efficiencyLack of inventory of previously ownedhomeSmart home featuresOtherAGE OF HOME BUYERAll Buyers22 to 2930 to 3940 to 5455 to 6465 to 7374 to 62433%1522329Previously Owned Home:Better overall valueBetter priceMore charm and characterLack of inventory of new homesOther*Less than 1 percent2020 NAR Home Buyer and Seller Generational Trends35
TYPE OF HOME PURCHASEDExhibit 2-3(Percentage Distribution)Detached single-family homeTownhouse/row houseApartment/condo in building with 5 or more unitsDuplex/apartment/condo in 2 to 4 unit 6%0%1%4% 6%All Buyers9%1% 3%22 to 296%6%1% 1%30 to 392020 NAR Home Buyer and Seller Generational Trends4%6%1% 2%40 to 546%6%2% 4%55 to 648%6%9% 7%1%65 to 734% 3%10% 9%74 to 9436
LOCATION OF HOME PURCHASEDExhibit 2-4(Percentage 3%19%20%14%13%13%0%All Buyers14%13%10%2%Suburb/Subdivision30 to 39Small town16%14%13%12%40 to 54Urban area/Central city9%12%55 to 64Rural area12% 11%6%5%4%3%1%*22 to 2918%23%65 to 7374 to 94Resort/Recreation area*Less than 1 percent2020 NAR Home Buyer and Seller Generational Trends37
SENIOR-RELATED HOUSING BY TYPE OF HOMEPURCHASED AND LOCATIONExhibit 2-5AGE OF HOME BUYER(Percentage Distribution)All buyers over5055 to 6465 to 7374 to 9412%10%17%26%60%80%76%73%Townhouse/row house9664Duplex/apartment/condo in 2 to 4 unit building3213Apartment/condo in building with 5 or more units174911Other1187953%41%51%47%Small town21272323Resort/ Recreation area612912Urban/ Central city9161211Rural area12456Share who purchased a home in senior-related housingBuyers over 50 who purchased senior-related housing:Type of home purchasedDetached single-family homeLocationSuburb/ Subdivision2020 NAR Home Buyer and Seller Generational Trends38
DISTANCE BETWEEN HOME PURCHASED AND PREVIOUSRESIDENCEExhibit 2-6(Median Miles)6040402220015All Buyers1222 to 29101030 to 3940 to 542020 NAR Home Buyer and Seller Generational Trends55 to 642065 to 7374 to 9439
FACTORS INFLUENCING NEIGHBORHOOD CHOICEExhibit 2-7(Percent of Respondents)AGE OF HOME BUYERQuality of the neighborhoodConvenient to jobOverall affordability of homesConvenient to friends/familyConvenient to shoppingDesign of neighborhoodQuality of the school districtConvenient to entertainment/leisure activitiesConvenient to schoolsConvenient to parks/recreational facilitiesAvailability of larger lots or acreageWalkabilityConvenient to vet/outdoor space for petConvenient to health facilitiesAccess to bike pathsHome in a planned communityConvenient to airportConvenient to public transportationOtherAll Buyers22 to 2930 to 3940 to 5455 to 6465 to 7374 to 299139410330533930415212102214366185472020 NAR Home Buyer and Seller Generational Trends40
PRICE OF HOME PURCHASEDExhibit 2-8(Percentage Distribution)AGE OF HOME BUYERAll Buyers22 to 2930 to 3940 to 5455 to 6465 to 7374 to 94Less than 75,0004%5%2%4%5%4%5% 75,000 to 99,9993523442 100,000 to 124,9995745445 125,000 to 149,99961045773 150,000 to 174,99979567810 175,000 to 199,99981186859 200,000 to 249,99915181415131612 250,000 to 299,9991291411111213 300,000 to 349,999101291071114 350,000 to 399,99973978811 400,000 to 499,999104111011107 500,000 or more1371618141110 257,000 206,300 282,000 278,000 250,500 255,900 264,000Median price2020 NAR Home Buyer and Seller Generational Trends41
PURCHASE PRICE COMPARED WITH ASKING PRICEExhibit 2-9(Percentage Distribution)AGE OF HOME BUYERPercent of asking price:All Buyers22 to 2930 to 3940 to 5455 to 6465 to 7374 to 94Less than 90%8%7%7%11%11%7%8%90% to 94%1312121413151595% to 99%35333631373835100%30302731282931101% to 110%121615121099More than 110%212122298%99%99%99%98%98%98%Median (purchase price as apercent of asking price)2020 NAR Home Buyer and Seller Generational Trends42
SIZE OF HOME PURCHASEDExhibit 2-10(Percentage Distribution)AGE OF HOME BUYERAll Buyers22 to 2930 to 3940 to 5455 to 6465 to 7374 to 941,000 sq ft or less***1%1%**1,001 to 1,500 sq ft162715121914131,501 to 2,000 sq ft283126252929382,001 to 2,500 sq ft252526232229222,501 to 3,000 sq ft13915131313103,001 to 3,500 sq ft95101398123,501 sq ft or ian (sq ft)*Less than 1 percent2020 NAR Home Buyer and Seller Generational Trends43
NUMBER OF BEDROOMS AND BATHROOMSExhibit 2-11(Percentage Distribution)AGE OF HOME BUYERAll Buyers22 to 2930 to 3940 to 5455 to 6465 to 7374 to 94One bedroom1%1%**1%1%1%Two bedrooms1616913212326Three bedrooms or more83849187777673Median number of bedrooms3333333One full bathroom18301916171212Two full bathrooms61596154616869Three full bathrooms or more21112029222019Median number of full bathrooms2222222*Less than 1 percent2020 NAR Home Buyer and Seller Generational Trends44
YEAR HOME BUILTExhibit 2-12(Median)AGE OF HOME BUYERAll Buyers22 to 2930 to 3940 to 5455 to 6465 to 7374 to 9420195%4%4%4%3%6%8%20188%46881382017 through 201263587772011 through 2006866811882005 through 2000121012101214231999 through 1984201619192023211983 through 1958243025242319171957 through 19151522191613981914 and older35432211990197819861989199219982001Median2020 NAR Home Buyer and Seller Generational Trends45
ENVIRONMENTALLY FRIENDLY FEATURES CONSIDERED“ VERY IMPORTANT ”Exhibit 2-13(Percent of Respondents)Heating and cooling costsWindows/Doors/Siding (Installation)Energy efficient appliancesLandscaping for energy conservation50%Commuting CostsEnergy efficient lightingEnvironmentally friendly community featuresSolar panels installed on home45%41%40%30%35%33%32%26%22%22%29%12%11%All Buyers24%10%9%5%28% 29%26%2020 NAR Home Buyer and Seller Generational Trends36
student loan debt. In fact, 46 percent of Younger Millennials reported having student loan debt with a median loan balance of 26,000, compared to 38 percent of Older Millennials with a median of 34,000. While only 23 percent of buyers 40 to 54 had student loan debt, they had a median balance of 30,000. This may be due to not only their