Transcription
Chapter 14Proposed Systems14.1. IntroductionThe preceding two chapters have discussed the parameterization ofqueueing network models of existing systems and evolving systems. Inthis chapter we consider models of proposed systems: major new systemsand subsystems that are undergoing design and implementation.The process of design and implementation involves continual tradeoffsbetween cost and performance. Quantifying the performance implicationsof various alternatives is central to this process. It also is extremely challenging. In the case of existing systems, measurement data is available.In the case of evolving systems, contemplated modifications often arestraightforward (e.g., a new CPU within a product line), and limitedexperimentation may be possible in validating a baseline model. In thecase of proposed systems, these advantages do not exist. For this reason,it is tempting to rely on seat-of-the-pants performance projections, whichall too often prove to be significantly in error. The consequences can beserious, for performance, like reliability, is best designed in, rather thanadded on.Recently, progress has been made in evolving a general framework forprojecting the performance of proposed systems. There has been aconfluence of ideas from software engineering and performance evaluation, with queueing network models playing a central role. The purposeof this chapter is to present the elements of this framework. In Section14.2 we review some early efforts. In Section 14.3 we discuss, in a general setting, some of the components necessary to achieve a good understanding of the performance of a proposed system. In Section 14.4 wedescribe two specific approaches.320
14.2. Background32114.2. BackgroundUser satisfaction with a new application system depends to a significantextent on the system’s ability to deliver performance that is acceptableand consistent. In this section we describe several early attempts atassessing the performance of large systems during the design stage. Somecommon themes will be evident; these will be discussed in the next section.In the mid 1960s GECOS III was being designed by General Electricas an integrated batch and timesharing system. After the initial designwas complete, two activities began in parallel: one team began the implementation, while another developed a simulation model to project theeffects of subsequent design and implementation decisions.The simulation modelling team came out second best. The model wasnot debugged until several months after a skeletal version of the actualsystem was operational. Thus, many of the design questions that mighthave been answered by the model were answered instead by the system.The model could not be kept current. The projections of the model werenot trusted, because the system designers lacked confidence in the simulation methodology.This attempt to understand the interactions among design decisionsthroughout the project lifetime failed. Other attempts have been moresuccessful.In the late 1960s TSO was being developed as a timesharing subsystem for IBM’s batch-oriented MVT operating system. During final designand initial implementation of the final system, an earlier prototype wasmeasured in a test environment, and a queueing network model wasparameterized from these measurements and from detailed specificationsof the final design.The average response time projected by the model was- significantlylower than that measured for prototype. However, the design team hadconfidence in the model because a similar one had been used successfullyfor MIT’s CTSS system (see Section 6.3.1). The team checked the prototype for conformance with specifications and detected a discrepancy: thescheduler had been implemented with an unnecessary locking mechanismthat created a software bottleneck. When this was corrected, the projections of the model and the behavior of the prototype were compatible.
322Parameterization:Proposed SystemsIn the early 1970s MVS was being designed and developed as abatch-oriented operating system for IBM’s new family of virtual memorymachines. A simulation model was developed for an early version of thissystem, OS/VS2 Release 2. The model’s purpose was to provide performance information for system designers.Model validation was a problem. In the design stage, key modelparameters were represented only as ranges of values. Performance projections were checked for reasonableness, to ensure that the modelrepresented the functional flow of work through the system. This type ofsensitivity analysis compensated for the lack of precise parameter values.The system was changing constantly during design and implementation.To reduce this problem, the model builders maintained a close workingrelationship with the system designers and implementors.This modelling effort was considered to be a success, because severalof its recommendations had direct, beneficial effects on the design of thesystem.In the mid 1970s the Advanced Logistics System (ALS) was underdevelopment for the U.S. Air Force. After the design was completed,during initial implementation, a modelling study was undertaken to determine the bottlenecks in the design and to recommend alternate designsyielding better performance. Hierarchical modelling, as described inChapter 8, was applied. Four major subsystems were identified in ALS:CPU and memory, system disks, databas? disks, and tapes. A hierarchical model was structured along these lines, dividing the modelling taskinto manageable components. Parameter values came from a combination of measurements and detailed specifications.Both analytic and simulation solutions of the model were obtained.Most ALS features could be captured in the analytic solution. Simulationwas used to validate the analytic results and to explore certain systemcharacteristics in more detail.The modelling study predicted that as the workload. increased, the firstbottleneck would be encountered in the system disk subsystem, and thenext in the CPU and memory subsystem. Both predictions were verifiedin early production operation, Thus, the study was judged a success.Each successful project that we have described used a different underlying approach: an analytic model for TSO, a-simulation model for MVS,and hierarchical analytic and simulation models for ALS. However, theseprojects shared a number of underlying principles. In the next section,we include these and other principles in a general framework for studyingthe performance of proposed systems.
14.3. A GeneralFramework32314.3. A General FrameworkUnfortunately, it is not common to attempt to quantify the performance of proposed systems. There are two major reasons for this:lManpower devoted to performance projection is viewed as manpowerthat otherwise could be devoted to writing code and delivering the system on time.lThere is no widely accepted approach to integrating performance projections with a system design project.The first of these points is rendered invalid by the false sense of economyon which it is based: the implications of misguided design decisions forthe ultimate cost of a system can be enormous. The second of thesepoints is becoming less significant as aspects of a general framework beginto emerge. These are the subject of the present section.14.3.1. The ApproachPerformance is not the domain of a single group. Thus, performanceprojection is best done in a team environment, with representation fromgroups such as intended users, software designers, software implementors, configuration planners, and performance analysts. By analogy tosoftware engineering, the team would begin its task by conducting a performance walkthrough of a proposed design. A typical walkthrough wouldconsist of the following steps:- The intended users would describe anticipated patterns of use ofthe system. In queueing network modelling terms, they wouldidentify the workload components, and the workload intensities ofthe various components.- The software designers would identify, for a selected subset of theworkload components, the path through the software modules ofthe system that would be followed in processing each component:which modules would be invoked, and how frequently.- The software implementors would specify the resource requirements for each module in system-independent terms: softwarepath lengths, I/O volume, etc.- The configurationplanners would translate these systemindependent resource requirements into configuration-dependentterms.- The performance analysts would synthesize the results of this process, constructing a queueing network model of the system.
324Parameterization:Proposed SystemsVarious parts of this process would be repeated as the performanceanalysts seek additional information, as the design evolves, and as theresults of the analysis indicate specific areas of concern. An importantaspect of any tool embodying this approach is the support that it providesfor this sort of iteration and successive refinement.It should be clear that what has been outlined is a methodicalapproach to obtaining queueing network model inputs, an approach thatcould be of value in any modelling study, not just an evaluation of a proposed system. (For example, see the case study in Section 2.4.)It also should be clear that this approach, since it forces meaningfulcommunication between various “interested parties”, can be a valuableaid in software project management.14.3.2. An ExampleHere is a simple example that illustrates the application of this generalapproach. A store-and-forward computer communication network isbeing designed. Our objective is to project the performance of this network, given information about the planned usage, the software design,and the supporting hardware.The topology (star and the protocol (polling) of the network areknown. The system is to support three kinds of messages: STORE,FORWARD, and FLASH. From the functional specifications, the arrivalrate, priority, and response time requirement of each message type can beobtained. Each message type has different characteristics and represents anon-trivial portion of the workload, so it is natural to view each as aseparate workload component and to assign each to a different class.Given knowledge of the intended protocol, a fourth class is formulated,representing polling overhead. Further refinements of this class structureare possible during project evolution.The software specifications for each class are imprecise in the initialstages, Only high-level information about software functionality, flow ofcontrol, and processing requirements are available. A gross estimate ofCPU and I/O resource requirements for each class is obtained. The CPUrequirement specifies an estimated number of instructions for each message of the type, and an estimated number of logical I/O operations. ForSTORE messages, as an example, the I/O consists of a read to an indexto locate the message storage area, a write to store the message, and awrite to update the index. No indication is given here about file placements or device characteristics, Instead, the logical properties of thesoftware are emphasized, to serve as a basis for further refinement whenthe software design becomes more mature.
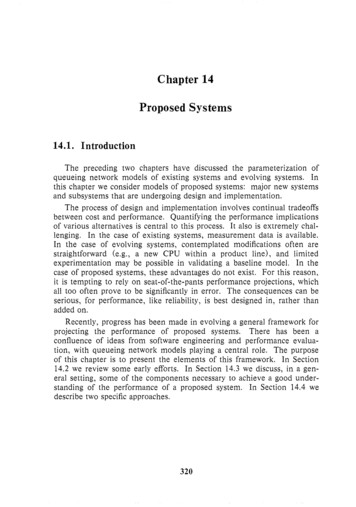
14.3. A GeneralFramework325Physical device characteristics are identified: speed, capacity, fileplacement, etc. A CPU is characterized by its MIPS rate and its numberof processors. A disk is characterized by its capacity, average seek time,rotation time, transfer rate, and the assignment of files to it. From consideration of the software specifications and the device characteristics, service demands can be estimated. As a simple example, a softwaredesigner may estimate 60,000 CPU instructions for a STORE message,and a hardware configuration analyst may estimate a CPU MIPS rate of.40. This leads to a STORE service demand for the CPU of .15 seconds.This admittedly is a crude estimate, but it serves as a basis, and moredetail can be incorporated subsequently.At this point, a queueing network model of the design, incorporatingclasses, devices, and service demands, can be constructed and evaluatedto give an initial assessment of performance. Alternatives can beevaluated to determine their effect on performance. Sensitivity analysescan be used to identify potential trouble spots, even at this early stage ofthe project.One of the strengths of this approach is the ability to handle easilychanges in the workload, software, and hardware. In the example, nointernal module flow of control was specified and processing requirementswere gross approximations. As the design progresses, the individualmodules begin to acquire a finer structure, as reflected in Figure 14.1.This can be reflected by modifying the software specifications. This structure acquires multiple levels of detail as the design matures. The submodules at the leaves of the tree represent detailed information about aparticular operation; the software designer has more confidence in theresource estimates specified for these types of modules. The totalresource requirements for a workload are found by appropriately summing the resource requirements at the various levels in the detailedmodule structure. Software specifications thus can be updated as moreinformation becomes available.The important features we have illustrated in this example include theidentification of workload, software, and hardware at the appropriate levelof detail, the transformation of these high-level components into queueing network model parameters, and the ability to represent changes in thebasic components.14.3.3. Other ConsiderationsThe design stage of a proposed system has received most of our attention. This is where the greatest leverage exists to change plans. However, it is important to continue the performance projection effort t.
Proposed SUPDATE-INDEXWRLTE-LNDEXFigure 14.1 - Refinement of Software Specificationsmaintenance/evolution follow design. Estimates indicate that the largestproportion of the cost of software comes from the maintenance/evolutionstage.Given the desirability of tracking performance over the software lifetime, it is useful to maintain a repository of current information aboutimportant aspects of the project (e.g., procedure structure within softwaremodules). If the repository is automated in database form, softwaredesigners and implementors are more likely to keep it current.A prerequisite for the success of the approach we have outlined is thatmanagement be prepared to listen to the recommendations rather thanadopting an expedient approach. Budgeting time and manpower for performance projection may lengthen the development schedule somewhat,but the benefits can be significant.
14.4. Tools and Techniques327A final important factor is the ability to turn this general frameworkinto specific working strategies. In the next section, we describe tworecent tools that are examples of attempts to do so.14.4. Tools and Techniques14.4.1. CRYSTALCRYSTAL is a software package developed in the late 1970s to facilitate the performance modelling of proposed and evolving application systems.A CRYSTAL user describes a system in three components: themodule spe#cation,the workload spec cation, and the conjgurationspecl ?ation. These specifications are inter-related, and are developed inparallel. They are stated in a high-level system description language.lThe module spe@cation describes the CPU and I/O requirements ofeach software module of the system in machine-independent terms:path lengths for the CPU, and operation counts to various files forI/O.lThe workload specljication identifies the various components of theworkload, and, for each component, gives its type (i.e., transaction,batch, or terminal), its workload intensity, and the modules that ituses.lThe configuration spe@ation states the characteristics of hardwaredevices and of files.From these specifications, CRYSTAL calculates queueing network modelinputs. These are supplied to an internal queueing network evaluationalgorithm, which calculates performance measures.We illustrate some of the important aspects of CRYSTAL by describing its use in modelling a proposed application software system. Aninsurance company is replacing its claims processing system. CRYSTALis used to determine the most cost-effective equipment configuration tosupport the application.As a first step, the workload components are identified in the workload specification. Many functions are planned for the proposed system,but the analyst determines that five will account for more than 80% of thetransactions. These include, for example, Claims Registration. (Thisinformation comes from administrative records.)Since the planning of this system is in its preliminary stages, it is notpossible to say with certainty how the system will be structured intomodules. The analyst decides initiallyto define one module
328Parameterization:Proposed Systemscorresponding to each of the five workload components. This information is represented in both the workload and the module specification.(Naturally, this is an area where the appropriate level of detail will vary asknowledge of the system evolves.)For each module, resource requirements are stated in the modulespecification. The units of CPU usage are instructions executed. Thereare two components: application path length and support system pathlength. In the case of the example, benchmarks of similar modulescurrently in use provide information for application path length. Whereno benchmark exists, the logical flow of the software is used to provideestimates. For support system path length, major system routines areexamined in detail to provide estimates; some benchmarks also are done.The units of I/O usage are number of physical I/O operations. Theanalyst determines these, beginning from a logical view of each module,and taking into account the file structure to be used.The major application files and their sizes are part of the configurationspecification. (These files correspond to those referred to in the I/O component of the module specification.) Initially, a simple file structure isproposed, but eventually file indices and database software will be introduced. In addition, a series of entries describe the devices of the system,e.g., for a disk, its transfer rate, seek time, rotation time, and a list of itsfiles.When the system description is complete, CRYSTAL can calculatequeueing network model inputs and obtain performance measures. Forexample, response times can be projected for the baseline transactionvolume and hardware configuration. If the results are satisfactory whencompared to the response time requirement stipulated for the application,projections can be obtained for increased transaction volume by adjustingthe arrival rates of the relevant workloads in the workload specification.Hardware alternatives can be investigated in a similar manner.This concludes our description of CRYSTAL. The major activities inusing this tool are completing the module specification, the workloadspecification, and the configuration specification. The study describedhere occurred during the initial stages of a project. As noted before,additional benefits would arise if the study were extended through thelifetime of the project. Better resource estimates would be available frommodule implementation, and the ability of the configuration to meet theresponse time requirement could be re-evaluated periodically.
14.4. Toolsand Techniques32914.4.2. ADEPTThe second technique to be discussed is ADEPT (A Design-basedEvaluation and Prediction Technique), developed in the late 1970s.Using ADEPT, resource requirements are specified both as averagevalues and as maximum (upper bound) values. The project design islikely to be suitable if the performance specifications are satisfied for theupper bounds. Sensitivity analyses can show the system components forwhich more accurate resource requirements must be specified. Thesecomponents should be implemented first, to provide early feedback andallow more accurate forecasts.The software structure of the proposed application is determinedthrough performance walkthroughs and is described using a graphrepresentation, with software components represented as nodes, and linksbetween these components represented as arcs. Because the softwaredesign usually results from a top-down successive refinement process,these graphs are tree-structured, with greater detail towards the leaves.An example is found in Figure 14.2, where three design levels are shown.Each component that is not further decomposed has a CPU time estimateand a number of I/O accessesassociated with it.The graphs are analyzed to determine elapsed time and resourcerequirements for the entire design by a bottom-up procedure. The timeand resource requirements of the leaf nodes are used to calculate therequirements of the nodes one level up, and so on up to the root node.A static analysis, assuming no interference between modules, is performed to derive best case, average case, and worst case behavior. Thevisual nature of the execution graphs can help to point out design optimizations, such as moving invariant components out of loops.Additional techniques handle other software and hardware characteristics introduced as the design matures. These characteristics include datadependencies (for which counting parameters are introduced), competition for resources (for which queueing network analysis software is used),and concurrent processing (in which locking and synchronization areimportant).ADEPT was used to project the performance of a database componentof a proposed CAD/CAM system. Only preliminary design specificationswere available, including a high-level description of the major functionalmodules. A small example from that study will be discussed. A transaction builds a list of record occurrences that satisfy given qualifications,and returns the first qualified occurrences to the user at a terminal. It
330Parameterization:Top level:QUERYProposed SystemsSecond level:FETCHinternal partsThird ubassembly iDB controlsystem-1LOCATEdescriptivedataSortlists LOCATEpieces j ofsubassembly iIIRetrievedescriptivedataFigure 14.2 - Example Execution Graphs
14.4. Toolsand Techniques331issues FIND FIRST commands to qualify record occurrences and FINDNEXT commands to return the occurrences. The execution graphs forthe FIND commands have the structure shown in Figure 14.3.The performance goal for processing this transaction was an averageresponse time of under 5 seconds, when the computing environment wasa Cyber 170 computer running the NOS operating system. A performance walkthrough produced a typical usage scenario from an engineering user and descriptions of the processing steps for the FIND commandsfrom a software designer. Resource estimates for the transaction components were based on the walkthrough information. Many optimisticassumptions were made, but the best case response time was predicted tobe 6.1 seconds, not meeting the goal (see Figure 14.3). About 43% ofthis elapsed time (2.6 seconds) was actual CPU requirement. Thus, itwas clear at the design stage that response times would be unacceptablylong because of excessive CPU requirements.CPU(sets)I/OSElapsed(sets)Fetch first ret 1 whereassembly 43 1200.488271.514tFetch first ret 2 whereassembly 43 1200.488271.514tFetch first ret 3 whereassembly 43 1200.488271.514tFetch next ret ageTotal0.1160.58015910.1540.770 Fetch next ret 32.624Figure 14.3 - Transaction Steps and Projections6.082
332Parameterization:Proposed SystemsThe application system has been implemented. Although actualparameter values were different in the running system than in the design,CPU bottlenecking still was present, more than a year after it waspredicted. This demonstrates the success of the ADEPT approach. (Thespecific corrective advice provided by the performance analysts usingADEPT was not acted on, because it would have caused slippage in the,delivery schedule for the system. However, the performance problemsthat arose resulted in delay and dissatisfaction anyway.)This study shows that it is possible to predict with reasonable accuracyresource usage patterns and system performance of a large software system in the early design stage, before code is written. It also is possible toachieve these benefits without incurring significant personnel costs. Thisexample was part of a project staffed by a half-time performance analystand took approximately one person-month of work.14.5. SummaryThe process of design and implementation involves continual tradeoffsbetween cost and performance. Quantifying the performance implicationsof various alternatives is central to this process. Because doing so is challenging and requires resources, it is tempting to rely on seat-of-the-pantsperformance projections. The consequences of doing so can be serious,for user satisfaction with a system depends to a significant extent on thesystem’s ability to deliver acceptable performance.We began this chapter with a description of several early experiencesin projecting the performance of proposed systems. We then discussedvarious aspects of a general approach to the problem. Finally, we studiedtwo recent attempts to devise and support this general approach. Wenoted that projecting the performance of proposed systems requires amethodical approach to obtaining queueing network model inputs, anapproach that could be of value in any modelling study. We also notedthat the process of performance projection can be a valuable projectmanagement aid, because it serves to structure and focus communicationamong various members of the project team.14.6. ReferencesThe early attempts at projecting the performance of proposed systems,discussed in Section 14.2, were directed not towards devising generalapproaches, but rather towards addressing the particular problems ofspecific systems. The study of GECOS III was described by Campbell and
14.6. References333Heffner [19681. The study of TSO was described by Lassettre and Scherr119721. The study of OS/VS2 Release 2 was described by Beretvas[19741. The study of ALS was described by Browne et al. [19751. Agood summary of these attempts appears in [Weleschuk 19811.We have described two recent attempts at devising and supportinggeneral approaches. CRYSTAL was developed by BGS Systems, Inc.[BGS 1982a, 1982b, 19831. The examples in Sections 14.3.2 and 14.4.1come from internal BGS Systems reports, as does Figure 14.1. ADEPTwas developed by Connie U. Smith and J.C. Browne. The case study in14.4.2 was conducted by Smith and Browne [19821; Figure 14.3 comesfrom this paper. Other good sources on ADEPT include [Smith 19811(the source of Figure 14.21, and [Smith & Browne 19831.[Beretvas 19741T. Beretvas. A Simulation Model Representing the OS/VS2 Release 2Control Program. Lecture Notes in Computer Science 16. SpringerVerlag, 1974, 15-29.[BGS 1982alCR YSTAL/IMS Modeling Support Library User’s Guide. BGS Systems,Inc., Waltham, MA, 1982.[BGS 1982blCR YSTALKICS Modeling Support Library User’s Guide. BGS Systems,Inc., Waltham, MA, 1982.tBGS 19831CRYSTAL Release 2.0 User’s Guide. BGS Systems, Inc., Waltham,MA, 1983.[Browne et al. 19751J.C. Browne, K.M. Chandy, R.M. Brown, T.W. Keller, D.F. Towsley,and C.W. Dissley. Hierarchical Techniques for Development of Realistic Models of Complex Computer Systems. Proc. IEEE 63,4 (June19751, 966-975.[Campbell & Heffner 19681D.J. Campbell and W.J. Heffner. Measurement and Analysis of LargeOperating Systems During System Development. 1968 Fall Joint Computer Conference Proceedings, AFIPS Volume 37 (1968)) AFIPS Press,903-914.[Lassettre & Scherr 19721Edwin R. Lassettre and Allan L. Scherr. Modeling the Performance ofthe OS/360 Time-Sharing Option (TSO). In Walter Freiberger (ed.),Statistical Computer Performance Evaluation. Academic Press, 1972,57-72.
334Parameterization:Proposed Systems[Smith 19811Connie Smith. Increasing Information Systems Productivity bySoftware Performance Engineering. Proc. CMG XII InternationalConference (1981).[Smith & Browne 19821Connie Smith and J.C. Browne. Performance Engineering of SoftwareSystems: A Case Study. 1982 National Computer Conference Proceedings, AFIPS Volume 51 (1982), AFIPS Press, 217-244.[Smith & Browne 19831Connie Smith and J.C. Browne. Performance Engineering of SoftwareSystems: A Design-Based Approach. To be published, 1983.[Weleschuk 19811B.M. Weleschuk. Designing Operating Systems with Performance inMind. MSc. Thesis, Department of Computer Science, University ofToronto. 1981.
system, OS/VS2 Release 2. The model's purpose was to provide perfor- mance information for system designers. Model validation was a problem. In the design stage, key model parameters were represented only as ranges of values. Performance pro- jections were checked for reasonableness, to ensure that the model