Transcription
#4bImplementing an AssessmentPrioritization ProcessBriefing for CCCFeb 19, 2014
Assessment Goal Assessment goal is to provide scientific information neededto prevent overfishing (through forecast of annual catchlimits), rebuild overfished stocks and achieve optimum yield How good does each stock’s assessment need to be toachieve this goal? How frequently must it be updated? These stock-specific assessment objectives allow us toconsider priorities among stocks to achieve the overall goalof the assessment enterprise
Assessment Prioritization History Currently, stock assessment scheduling is region-specific under a nationalumbrella. Each region has a process (e.g. Southeast’s SEDAR) involving thelocal NMFS Science Center(s) and Fishery Management Council(s); OMB requested that NMFS develop a prioritization system for fish stockassessments Some regions, particularly NE and SE, have worked on assessmentscheduling and prioritization in recent years A NMFS working group was formed in 2011 to develop a prioritization system In 2013, call for prioritization appeared in Congressionally requested GAOreview of stock assessments, and in an introduced bill on improved sciencefor MSA
Prioritization Overview Among stocks that never have been assessed: Identify those OK with baseline monitoring, and Those needing priority for first-time assessment Among previously assessed stocks, set medium-term assessment goals target assessment level for each stock; this drives the data requirements Set target assessment update frequency for each stock Annually update priorities for conducting assessments Do benchmark assessments for stocks for which new data or methods willallow resolving uncertainties or advancing to higher level Do update assessments for stocks that are at or exceed their target updateperiod.
Data Needed for PrioritizationCommercial Fishery ImportanceRecreational Fishery ImportanceEcosystem ImportanceStock biology (principally: natural mortality rate andrecruitment variability) Stock Status info from previous assessments Assessment history, unresolved uncertainties U.S. Department of Commerce National Oceanic and Atmospheric Administration NOAA Fisheries Page 5
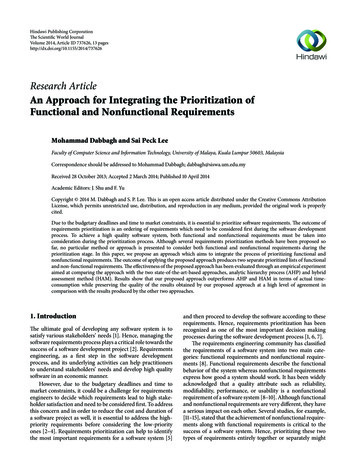
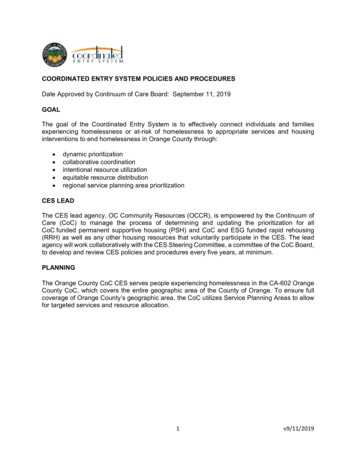
Flowchart of Prioritization ProcessU.S. Department of Commerce National Oceanic and Atmospheric Administration NOAA Fisheries Page 6
Setting PrioritiesU.S. Department of Commerce National Oceanic and Atmospheric Administration NOAA Fisheries Page 7
Prioritization Outcome The whole portfolio of assessment needs will be transparent toall participants in assessment process; Important assessments will get done when they need to getdone, not sooner and not a lot later; This “right-sizing” of the assessment frequency for importanttocks may help release some assessment effort for currentlyunder-assessed stocks.8
Implementation Steps1.2.3.4.5.6.7.8.Distribute draft to Fishery Management Councils, NMFS Regional Offices,Fishery Commissions and to public via website – February 2014;Create database of needed information as an added table in the SpeciesInformation System – begin winter 2014;Receive comments from Council by May 1, 2014 and summarize to the MayCCC;Each region begins work on comprehensive Productivity-SusceptibilityAnalysis and Only Reliable Catch Analysis to serve as baseline fordetermining which stocks need assessments – begin spring 2014;Test prioritization system to determine if adjustments to scaling factors areneeded to achieve reasonable results – summer 2014;Make database available to regional coordinating committees charged withsetting priorities for regional assessments – fall 2014; Create accessthrough SIS public portal;Commission Management Strategy Evaluations to test the expectedperformance of this prioritization system over time – 2015;Explore Decision Support System facilitators to guide regional coordinatingcommittees through application of the prioritization process – 2016.U.S. Department of Commerce National Oceanic and Atmospheric Administration NOAA Fisheries Page 9
Challenges for Prioritization1. Workload in getting initial information generated and organized;2. Unsure that system will result in good balance of baseline monitoringfor all and highest quality assessments for some;3. Does not address prioritization of surveys and expanded scope toinclude ecosystem considerations;4. May not get more assessments done, but can help identify needs;5. Some constituents may be expecting a between region prioritization,rather than a national facilitation of within region prioritization;6. Review processes and fishery management systems may also needtweaking to take best advantage of prioritized assessments.U.S. Department of Commerce National Oceanic and Atmospheric Administration NOAA Fisheries Page 10
Why do we Assess Fish Stocks and Monitor Fisheries? Assessments provide a measure of how much can be caught,while monitoring determines how much has been caught Lack of good assessments creates high uncertainty, whichcan lead to either inadvertent overfishing or decreased yielddue to large buffers Updated assessment are necessary for identifying whenchanges in fish stocks occur (due to ecosystem,environmental, or fishery factors)
Assessments Calculate: Long-term stock productivity andsustainable harvest rate Current stock abundance Current harvest rate Forecast of future stock abundanceand available yield (OFL) Indicators of changes in ecosystemproductivity
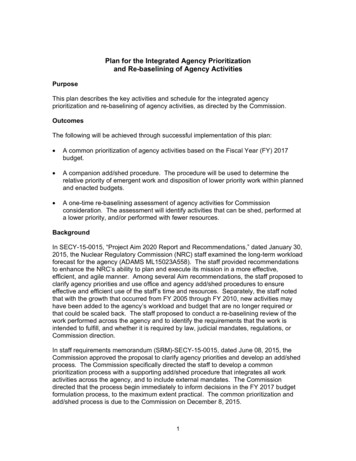
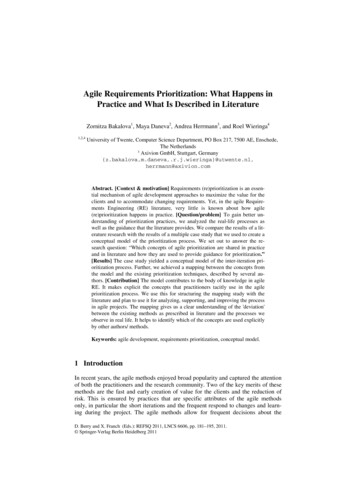
Stock Assessment ProcessBIOLOGYCATCHABUNDANCERetained and discardedcatch from commercial andrecreational fisheriesTime series of standardizedindex of stock abundance fromNOAA vessels and chartervesselsAge, growth, maturity,natural mortality,movementAge and size of caught fishIncludes age and size data, andassociated ecosystemobservations where possiblePOPULATION MODELCalibrated from data inputsEstimates time series of fish abundance and fishing mortalitySTATUS OF STOCKANNUAL CATCH LIMITOverfished?Overfishing occurring?Forecast catch level that implementsharvest policy
Linking Investments to Assessments Each stock’s assessment uses data from many sources, as justshown Most data sources simultaneously provide data for manyspecies This many-to-many relationship confounds accounting the costper assessment Investments build regional assessment capacity, not individualassessment updates
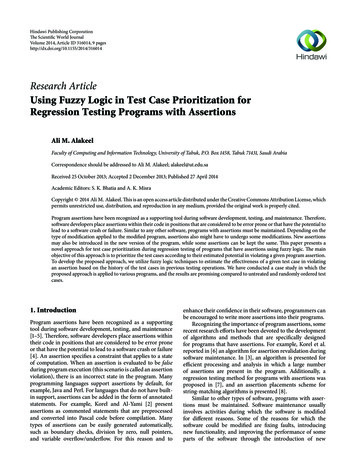
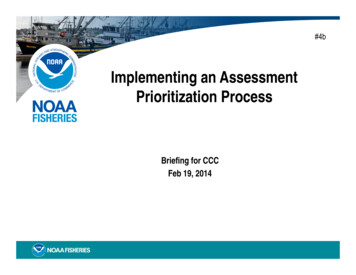
Recent Assessment FrequencyASSESSMENT AGE0AlaskaCal. Current123456781011121517 none All315941671CaribbeanGulf of Mexico651International - Atl224International - Pac55182Pacific Islands21Southeast643267528141010NortheastGrand 3873 230As of April 2012; Includes assessments at level 3 or higher“none” includes some assessments done at lower levelsU.S. Department of Commerce National Oceanic and Atmospheric Administration NOAA Fisheries Page 15
Assessment Prioritization History Currently, stock assessment scheduling is region-specific under a national umbrella. Each region has a process (e.g. Southeast's SEDAR) involving the local NMFS Science Center(s) and Fishery Management Council(s); OMB requested that NMFS develop a prioritization system for fish stock assessments