Transcription
Measures of financial stability – a reviewBlaise Gadanecz and Kaushik Jayaram 1IntroductionUnlike price stability, financial stability is not easy to define or measure given theinterdependence and the complex interactions of different elements of the financial systemamong themselves and with the real economy. This is further complicated by the time andcross-border dimensions of such interactions. However, over the past two decades,researchers from central banks and elsewhere have attempted to capture conditions offinancial stability through various indicators of financial system vulnerabilities. Indeed, manycentral banks through their financial stability reports (FSRs) attempt to assess the risks tofinancial stability by focusing on a small number of key indicators. Moreover, there areongoing efforts to develop a single aggregate measure that could indicate the degree offinancial fragility or stress. Composite quantitative measures of financial system stability thatcould signal these conditions are intuitively attractive as they could enable policy makers andfinancial system participants to: (a) better monitor the degree of financial stability of thesystem, (b) anticipate the sources and causes of financial stress to the system and(c) communicate more effectively the impact of such conditions.The approach to the development of these measures of financial system stability haschanged over the years as the locus of concern moved from micro-prudential to macroprudential dimensions of financial stability. From the analysis of early warning indicators tomonitor the state of the banking system, particularly the risk of default of individualinstitutions, the focus has shifted to a broader system-wide assessment of risks to thefinancial markets, institutions and infrastructure. More recently, the analytical focus hasfurther concentrated on the dynamics of behaviour, the potential build-up of unstableconditions as well as the so called transmission mechanisms of shocks. A key issueunderlying these analytical developments is the need to bridge the data gaps in severalareas. Clearly this is an ongoing debate and a work in progress.This paper is a modest contribution to review the work done towards developing quantitativemeasures of financial stability and their use in published FSRs. The paper is structured asfollows. In Section I, we look at definitions of financial stability and what they mean foridentifying key variables, which we discuss in Section II. In Section III, we review how theseindividual variables might be combined into composite indicators for the purposes ofmonitoring key sectors of the economy and assigning critical values. In Section IV, weprovide a comparative view of the main variables and indicators used in selected FSRs. InSection V we discuss recent attempts to construct a single aggregate measure of financialstability. The final section concludes.IDefinition and identification of key financial system vulnerabilitiesFinancial stability is difficult to define and even more difficult to measure. Strictly speaking, afinancial system can be characterised as stable in the absence of excessive volatility, stress1Monetary and Economic Department, Bank for International Settlements. The views expressed in this paperare those of the authors and do not necessarily reflect those of the BIS.IFC Bulletin No 31365
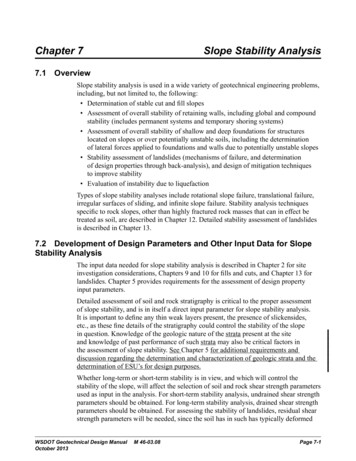
or crises. This narrow definition is relatively simple to formulate, but fails to capture thepositive contribution of a well-functioning financial system to overall economic performance.Indeed, broader definitions of financial stability encompass the smooth functioning of acomplex nexus of relationships among financial markets, infrastructures and institutionsoperating within the given legal, fiscal and accounting frameworks. Such definitions are moreabstract but are more inclusive of the macro-economic dimension of financial stability andinteractions between the financial and real sectors. From this perspective, financial stabilitycan be defined as “a condition in which the financial system – comprising financialintermediaries, markets and market infrastructure – is capable of withstanding shocks andthe unravelling of financial imbalances, thereby mitigating the likelihood of disruptions in thefinancial intermediation process which are severe enough to significantly impair the allocationof savings to profitable investment opportunities” (ECB (2007)).Given the imprecise nature of the broader view of financial system stability, most analystsconcentrate on the risks and vulnerabilities of the financial system as these are relativelyeasy to understand and quantify. However, there are difficulties arising from the narrowdefinition too, insofar as a crisis is difficult to define. Different countries have been hit bydifferent types of crises (banking crises, currency crises, debt crises, equity crises) over timeand there are several ways of defining a crisis of each type, from purely binary indicators(failure of a bank, suspension of debt payments by a sovereign creditor) to other morequantifiable variables (eg number of insolvencies, magnitude of banking losses, GDP loss,magnitude of exchange rate fluctuation, decline of stock market index). Also important is thetime horizon over which to measure a crisis. For instance Frankel and Rose (1996) define acurrency crisis as a nominal depreciation of at least 25% that exceeds the previous year’schange by a margin of at least 10 percentage points. Patel and Sarkar (1998) identify equitymarket crises using an a hybrid volatility loss measure in a window of 1 to 2 years. Theinterpretation of, as well as the benchmarks for, financial stability measures depend on thedefinition of crises. Nevertheless, several attempts have been made in the literature to try toidentify and predict crises.IIKey financial stability segments and variablesPolicymakers and academic researchers have focused on a number of quantitativemeasures in order to assess financial stability. The set of Financial Soundness Indicatorsdeveloped by the IMF (IMF (2006)) are examples of such indicators, as are the monitoringvariables used in Hawkins and Klau (2000), Nelson and Perli (2005) and Gray et al (2007)which focus on market pressures, external vulnerability and banking system vulnerability.Table 1 summarises the measures commonly used in the literature, their frequency, whatthey measure, as well as their signalling properties. The focus is on six main sectors.Firstly, the real sector is described by GDP growth, the fiscal position of the government andinflation. GDP growth reflects the ability of the economy to create wealth and its risk ofoverheating. The fiscal position of the government mirrors its ability to find financing for itsexpenses above its revenue (and the associated vulnerability of the country to theunavailability of financing). Inflation may indicate structural problems in the economy, andpublic dissatisfaction with it may in turn lead to political instability.Secondly, the corporate sector’s riskiness can be assessed by its leverage and expenseratios, its net foreign exchange exposure to equity and the number of applications forprotection against creditors.Thirdly, the household sector’s health can be gauged through its net assets (assets minusliabilities) and net disposable income (earnings minus consumption minus debt service andprincipal payments). Net assets and net disposable earnings can measure households’ability to weather (unexpected) downturns.366IFC Bulletin No 31
Table 1IFC Bulletin No 31Commonly used variablesSectorsReal EconomyCorporate sectorHousehold sectorMeasureFrequencyWhat do they measureSignalling propertiesGDP growthQ or AIndicative of the strength of the macroeconomy, GDP is a key measureespecially used in conjunction withmeasures such as credit expansion,fiscal deficit.Negative, or low positive values would indicate aslowdown; excessively high values may showunsustainable growthFiscal position of governmentA, Q or MAbility of government to find financing,vulnerability of sovereign debtor tounavailability of financingHigh deficit values relative to GDP can mean unsustainablegovernment indebtedness and vulnerability of thesovereign debtorInflationM or ARate of increase of various price indicesHigh levels of inflation would signal structural weakness inthe economy and increased levels of indebtedness,potentially leading to a tightening of monetary conditions.Conversely, low levels of inflation could potentially increasethe risk appetite in the financial markets.Total debt to equityQ or ACorporations’ leverageExcessively high levels may signal difficulties in meetingdebt obligationsEarnings to interest andprincipal expensesQ or ACorporations’ ability to meet paymentobligations relying on internal resourcesExcessively low levels of liquidity may signal inability tomeet debt obligationsNet foreign exchangeexposure to equityQ or ACurrency mismatchHigh levels of this ratio may signal difficulties in thecorporate sector arising from adverse currency movesCorporate defaultsQ or AInsolvencies in the corporate sectorHigh values can signal future problems in the bankingsector, if insufficiently provisionedHousehold assets (financial,1real estate )A, Q or MHousehold debtA, Q or MHousehold income (labourincome, savings income)A, Q or MHousehold consumptionA, Q or MHousehold debt service andprincipal paymentsA, Q or MAssets and debt can be used to computenet household assetsIncome, consumption and debt servicepayments can be combined to computenet disposable incomeNet household assets anddisposable income canmeasure households’ ability toweather (unexpected)economic downturns367
368Table 1 (cont)Commonly used variablesSectorsExternal sectorFinancial sectorMeasureFrequencyWhat do they measureSignalling propertiesIFC Bulletin No 31(Real) exchange ratesDOver-/undervaluation of a currencyOver- or undervaluation of currency can trigger a crisis(capital outflows, massive inflows or loss of exportcompetitiveness)Foreign exchange reservesDAbility of country to resist external shocksReserves below short-term foreign debt, or below threemonths’ worth of exports can signal problemsCurrent account/capital flowsA, Q or MTrade position of countrySignificant trade deficits require large capital inflows inorder to be financed; this raises sustainability issues aboutsuch inflowsMaturity/currencymismatchesA, Q or MDisparity in the currency/maturitycomposition of assets and liabilitiesMaturity and currency mismatches can expose theeconomy to adverse shocks in case of adverse currencymovements or sudden reversals of capital inflowsMonetary aggregatesMTransactions, saving, creditExcessive growth can signal inflationary pressures(Real) interest ratesDCost of credit, ability to attract depositssustainability of debt.Real interest rates above a threshold likely to exceed thetrend rate of economic growth, making debt/GDP ratiosexplosive; negative real rates may mean banks will struggleto attract depositsGrowth in bank creditBank leverage ratios,NPLsMQ or AQ or ARisk premia (CDS);credit risk component of3 month LIBOR – OISspreadsDRiskiness of the banking sectorVery rapid loan growth has often accompanied decliningloan standards/greater risk. Excessively high loan losses,leverage ratios and risk premia can foreshadow a bankingcrisis. Loan losses/GDP can measure cost of a bankingcrisis for economyCapital adequacyQ or ABanks’ capital cushion size to addressexpected or unexpected lossesExcessively low levels of this ratio points to potentialdefaults and can be a forerunner of a banking crisisLiquidity ratioQ or ARatio of banks’ readily available shortterm resources that can be used to meetshort-term obligationsExcessively low levels of this ratio can lead to a systemiccrisisStandalone bank creditratingsIrregularIndividual strength of banks, after theeffect of government or other guaranteeshas been taken into accountPossible coincident indicator of banks’ condition, likely toinfluence their future funding costs
Table 1 (cont)IFC Bulletin No 31Commonly used variablesSectorsMeasureFrequencyWhat do they measureSignalling propertiesFinancial sector(cont)Sectoral/regionalconcentration, systemicfocusQ or AConcentration or diversification of banks’lending strategyCan proxy for speed of propagation of shocks in theeconomyFinancial marketsChange in Equity IndicesDNet worth of, present value of futurecash-flows of firms comprising the indexAbove-trend growth in index, or very high levels of marketto book value can be indicative of an equity price bubbleCorporate bond spreadsDRiskiness of debt compared to risk-freeinstrumentsSpikes in spreads can suggest higher levels of risk,changes in risk appetite, changes in the incorporation ofnews into prices by the marketMarket liquidity(Government bonds, liquidityrisk component of 3m LIBOR– OIS spreads)DPrice attached by the market to the easewith which liquid instruments can betradedSpikes in these premia can reflect disruptions in marketliquidityVolatilityDIntensity of price movements on marketsEase of trade on the marketLow volatility can be indicative of a calm market, but also offailings in the price discovery process. High volatility canmirror a disruption of market liquidity.House pricesQ, A or MNote: A annualQ quarterly1M monthlyHouse price bubble, consumption boom fuelled by equitywithdrawals, potential losses to financial sector in case ofdownturn in pricesD daily. Data available with a high frequency may sometimes be used with a lower frequency for FS monitoring.Measuring the financial assets of households is complicated by the measurement issues related to house price measures and the treatment of owner-occupied housings.These issues were discussed at an IFC conference held in August 2006 in Basel. The conference proceedings have been published in IFC Bulletins 25 and 26.Source: compiled by the authors.369
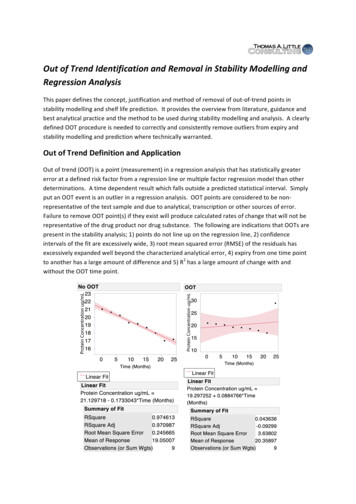
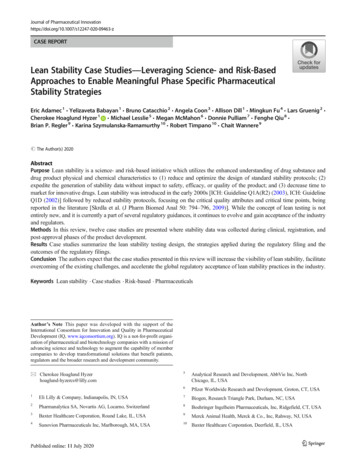
Fourthly, the conditions in the external sector are reflected by real exchange rates, foreignexchange reserves, the current account, capital flows and maturity/currency mismatches.These variables can be reflective of sudden changes in the direction of capital inflows, of lossof export competitiveness, and of the sustainability of the foreign financing of domestic debt.Fifthly, the financial sector is characterised by monetary aggregates, real interest rates, riskmeasures for the banking sector, banks’ capital and liquidity ratios, the quality of their loanbook, standalone credit ratings and the concentration/systemic focus of their lendingactivities. All these proxies can be reflective of problems in the banking or financial sectorand, if a crisis occurs, they can gauge the cost of such a crisis to the real economy.Lastly, variables relevant to describe conditions on financial markets are equity indices,corporate spreads, liquidity premia and volatility. High levels of risk spreads can indicate aloss of investors’ risk appetite and possibly financing problems for the rest of the economy.Liquidity disruptions may be a materialisation of the market’s ability to efficiently allocatesurplus funds to investment opportunities within the economy.Typically financial stability analysis would use several sectoral variables either individually orin combinations. The use of such measures including the financial soundness indicators askey indicators of financial stability depends on the benchmarks and thresholds which wouldcharacterise their behaviour in normal times and during periods of stress. In the absence ofbenchmarks, the analysis of these measures would depend on identifying changes in trend,major disturbances and other outliers (Worrell (2004)).IIIComposite indicatorsA financial system consists of a number of key sectors, and interactions 2 between thesesectors. The situation is further complicated by the non-linearities that can affect thepropagation of shocks and their transmission from one sector to another (White (2004),ECB (2005)). For instance, there are links between monetary and financial stability, asmonetary conditions will be affected by asset prices and vice versa. For all intents andpurposes, it is not enough to focus on deviations from benchmarks in individual sectors foran overall assessment of financial stability. Whilst individual variables and indicators areuseful in analysing the functioning of the financial systems, various studies have attempted todevelop composite indicators which would better signal or predict the onset of financialdistress. Beginning with the studies on early warning indicators attempts are ongoing todevelop leading indicators which would signal conditions of stress. When multiple indicatorsare available, it would be necessary to combine them in ways that would best capture theinteractions between relevant individual indicators. Composite indicators are suchcombinations of the individual variables (eg bank credit related to GDP) which can be2For instance, problems in the real sector can affect the household sector (through job losses, loss of income,inability of the government to provide social benefits), the external sector (through loss of foreign investorconfidence), the corporate sector (through reduced demand) and the financial sector (through its exposures todefaults in the corporate and household sectors). A sudden reversal of external capital flows can negativelyaffect all sectors of the economy. Difficulties in the financial sector can hit all sectors of the economy adverselyby reducing the availability of funding. Problems in the corporate sector can translate into an economicdownturn, can create losses in the financial sector through exposures and directly affect households throughchanges in remuneration and employment levels. A household sector in bad health can adversely influencethe real economy (through reduced consumption) and the financial sector (through losses on householdexposures). Lastly, disruptive financial market conditions can directly affect the health of the financial sector,to the extent that financial institutions are market participants. Households can also be negatively affected byadverse financial asset price movements insofar as they invest on financial markets or own real estate.370IFC Bulletin No 31
assigned benchmark or threshold values for the purposes of monitoring key sectors of theeconomy and serving as leading indicators of crises.A number of studies applied the early warning indicator methods initially developed in theliterature for currency and balance of payments crises to banking crises. Earlier work includes,among others, Calvo et al (1993), Eichengreen et al (1996), Turner and Goldstein (1996)Frankel and Rose (1996). Demirgüç-Kunt and Detragiache (1997) use a multivariate Logitapproach to identify determinants of banking crises in a large panel of developing andindustrialised countries: slow GDP growth and high inflation, vulnerability to sudden capitaloutflows, low liquidity in the banking sector, a high share of credit to the private sector, pastcredit growth, explicit deposit insurance and weak institutions. Kaminsky and Reinhardt (1999)identify early warning indicators of twin (banking and balance of payments) crises, such ascredit and equity prices, by looking at the ability of such variables to predict crises 12 or24 months ahead, while minimising the noise 3 to signal ratio. Borio and Lowe (2002) andBorio and Drehmann (2009) build on the techniques developed by Kaminsky andReinhardt (1999). Like the latter, they define threshold values for the indicators, but unlikethem, they look at cumulative processes rather than just growth rates over one year, theyuse ex ante information (ie information which was available to the policymaker prior to thecrisis) and, for the first time, they consider combinations of indicators and look at multipletime horizons.Goodhart et al (2006) state that financial crisis monitoring can effectively be done with anindicator of banking sector profitability as well as the probability of default. Gerdrup (2003)uses banking indicators (number of banks, balance sheet indicators) and market indicators(asset prices) as determinants of the Norwegian crisis, controlling for non-financial sectorindebtedness and macroeconomic factors. It has also been recognised in the literature(Nelson and Perli (2005), ECB (2005), Van den End (2006)) that in addition to balance-sheetbased information, there is need for market information, not least because of the interactionsbetween bank- and non-bank financial intermediation. 4Illing and Liu (2003) and Van den End (2006) provide a good descriptions of how one mightattempt to build a composite indicator of financial stability. To begin with, relevant variablesneed to be selected. The choice is most often based on the early warning indicators literature(Demirgüç-Kunt and Detragiache (1998), Kaminsky, et al (1998), Bordo and Schwartz (2000))and typically covers the banking system, the foreign exchange market and the equity market.Risk spreads and market liquidity are the two concepts most often used. Obviously, thechoice of variables must also reflect the structure of the country’s financial system. Forinstance, more importance should be attached to banking system indicators in countrieswhere bank intermediation is more significant than market financing (ECB (2007)). Then, thesingle aggregate measure is calculated as a weighted average of the variables previouslyidentified, each with a suitable lag. One important aspect of the weighted averageconstruction is the weights. These can be determined in five different ways. Firstly, common3Failure to predict a crisis or a false alarm.4A number of desirable properties of a good composite indicator can be noted. It must be internationallycomparable, if the analysis is conducted on several countries. Geršl and Heřmánek (2006) underline thatdifferences in national accounting standards do not allow full cross-country comparison for some of the coreset of the IMF’s Financial Soundness Indicators. Furthermore, as pointed out in Čihák (2007), a good indicatormust be easy to calculate, as well as to interpret; the assumptions that support it have to be robust, itstheoretical underpinnings clear. For instance, backing out risk aversion measures from prices observed on themarket rests on the assumption that prices can be observed on the market at all times. This assumption ofmarket liquidity is not necessarily robust in the sense that liquidity can evaporate in times of stress. Lastly,although formalising the outcomes of tail events is important, a composite indicator has to be a usefulmeasure of stress (eg it has to measure the build-up of imbalances) in the system even in the absence ofextreme events.IFC Bulletin No 31371
factors analysis can be performed. 5 Secondly, a weight representing the importance (size) ofthe market which it proxies for can be assigned to each factor. Thirdly, sample cumulativedistribution functions can be estimated. 6 Fourthly, the results of economic simulations with amacro-economic model can be used to determine the weights. 7 Fifthly, the variance-equalmethod can be chosen. This latter approach is the one most commonly used in the literatureand consists of normalising each variable and then assigning equal weights.IVUse of indicators and variables in financial stability reportsMost analyses of financial stability as reflected in the financial stability reports 8 (FSRs)extensively focus on various market segments and the variables listed in Table 1. However,the use of composite indicators is not very widespread in published financial stability reports.Table 2 provides a summary of the key indicators used by selected central banks in theirFSRs. The selected sample represents a mix of industrial and emerging market economieswith a diversified geographical distribution. Included in the list are a number of institutionswhose reports compute composite measures in one form or the other. 9Key sectors and variablesWhen it comes to specific variables used in the FSRs, there are several common areas. Notsurprisingly, the focus depends on the specific conditions in the economy and areas ofobserved and perceived vulnerabilities. Past episodes are also a guide. Many emergingmarket economies extensively focus on capital inflows, the balance of payment situation andexchange rate movements, while industrial countries focus on their banks’ exposure toemerging markets. Banking ratios are extensively analysed in most reports although thereare differences. Some reports tend to concentrate on the banks’ performance and risks inconsiderable detail, while the others include insurance, hedge funds and other forms of nonbank financial intermediation. Where banking is the main form of intermediation, the availableinformation would also depend on the level of supervisory input in preparing the report.Appropriately, many FSRs focus on systemically important banks as well as regions orsectors. For instance, the Austrian FSR has a strong focus on the developments in easternEuropean markets while the HKMA report extensively analyses the developments in southeast Asia and China. With some exceptions, the FSRs reviewed here do not discussmonetary policy variables. A likely explanation is that central banks use other channels suchas monetary policy statements or Inflation Reports for that purpose.5Such analysis consists in extracting weighed linear combinations of a number of variables, maximising thevariance of each linear combination, while minimising the variance around it. The purpose of the exercise is toreduce the number of variables and detect the structure in the relationships between variables.6Each variable is transformed into percentiles, so that the highest (lowest) levels of stress are characterised bythe 99th (first) percentile. Then, the transformed variables are averaged using chain linked arithmetic andgeometric means.7Using a backward-sloping IS curve, Van den End (2006) estimates the impulse of changes in financialsoundness indicators on GDP is estimated to determine weights.8Over 40 central banks regularly publish financial stability reports either annually or bi-annually.9The institutions/countries included in Table 2 represent an eclectic sample merely to illustrate typical use andis not intended as an exhaustive coverage of all published reports.372IFC Bulletin No 31
IFC Bulletin No 31Table 2Data including composite indicators in selected FSRsSector/IndicatorsATAUBRCACHCZESGBHKHU 2Composite index 5Banking index SE 8Monetary conditions indexTRECB1 3IMF 4 7Financial conditions indexID 6 9 10 Real sectorGDP Fiscal deficit , St Inflation Household finance , St Corporate finance Policy rate12 , St Monetary aggregates Vo , VoVoVo 14 15 11 External sectorFX ratesVoVo, StFX exposures VoVo , VoBOP Capital flows Reserves Vo, ViVo Financial sector13Profitability373Capital ratios , St , St
374Table 2 (cont)Data including composite indicators in selected FSRsSector/IndicatorsATAUBRCredit (Loans) Liabilities (deposits) , St Credit Risk , StMarket risk , StVaR , St16LiquidityInterest rate risk17 CAECB1CHCZESGBHKHUIDSETR , St , St , St , St ,St , St , St , St , St , St , StSt , Vo , St Asset quality Sectoral/Regional Systemic focus YYY, St Y, SrSrSr, VoS, Vo, ViVoSrSr, VoY19S, Vo, ViSrVoVoVoVoVo, ViVo, ViVo , YVoVoVo VoVo 18 , StIMF YY, SrY, Sr Sr, Y, Vi Y, SrFinancial MarketsGovernment BondsCorporate BondsSr, Vo Sr, VoMoney marketsVoEquity pricesVoVoReal estate pricesVoVoSr, VoYYSr, Vo, YY, Sr, R Sr, Vo,ViSrSr, Vi,Vo, SrSr, YSr, Vi, Y Y, SrSr, VoSrVi, VoSr, SrVo, ViVoVoVo, ViVoVoVoNotes: R – ratings, St – Stress test based, Sr – riskiness and liquidity spreads, Vo – observed volatility, Vi – implied volatility, VaR – Value at risk, Y – Average yield, denotes the use of one indicator, denotes the use of several indicators.IFC Bulletin No 3112Euro area indicators as well as global comparisons.Qualitative assessment based on sources, likelihood and impact of tail risks on six key vulnerabilities in the34financial system.Single aggregate index of financial stability.Global financial stability map summarising risks and prospects of macro–financial environment.56Stress index for Swiss banks.Separate composite indices for volatility and trading and market liquidity. 7 Separate indexes for creditworthiness and market liquidity.8A composite financial market liquidity index. 9 Multiple composite measures are used to estimate credit/equity/GDP gaps, financing gaps for non-financial companies and10Banking stability index. 11 Including a Real Sector Confidence index. 12 CB monetary policy rate. 13 In most cases thesecomposite inter–bank liquidity indicator.14indicators refer to Banking Sector only.Large complex banking groups. 15 Including estimates of losses from write-downs of exposures. 16 10 day VaR figures.17Typically includes non-performing loans, observed and estimated default rates and loss provisioning. 18 NPL and doubtful assets to gross loans. 19 1 Yr yield average.Source: compiled by the authors, based on Central Banks’ FSRs.
Four sets of specific variables are used at the ECB (ECB (2007)). Firstly, the bankingsector’s balance-sheet (reflecting the continued significance of bank-based financialintermediation in the euro area), especially profitability, asset quality and capital adequacy.Particular attention is devoted to large and complex banking groups (LCBGs). Secondly,major sources of risk to the financial sector. This would include an assessment of competitiveconditions in the banking sector, credit growth and banking exposure concentrations. Moregenerally, it would cover asset price
among themselves and with the real economy. This is further complicated by the time and cross-border dimensions of such interactions. However, over the past two decades, researchers from central banks and elsewhere have attempted to capture conditions of financial stability through various indicators of financial system vulnerabilities. Indeed .