Transcription
New York City Department of City PlanningNYC Hotel Market AnalysisExisting Conditions and 15-Year Outlook
N E W YO R K C I T Y H OT E L M A R K E T A N A LYS I SNew York City Hotel Market Analysisand M1 Zone ImpactsTable of ContentsPrepared for New York City Department of City Planning byEXECUTIVE SUMMARY BJH Advisors (bjhadvisors.com)INTRODUCTION BAE Urban Economics (bae1.com)I1COVID Pandemic Shutdown1Purpose of Study2Methodology3Data Sources3Approach5Key Definitions6DEFINING THE NYC LODGING MARKETLodging Typologies88Existing Clientele and Customer Base13Hotel Development, Ownership and Management15Geographies: Defining NYC Borough Markets and Submarkets24Land Use Controls and New Regulation25NYC AND SUB-AREA HOTEL MARKET EXISTING CONDITIONS28Impact of COVID-19 on the New York City Hotel Market28HOTEL CLOSURES: THE STATE OF THE NYC HOTEL MARKET IN OCTOBER 202034New York City Department of City PlanningCENTRAL OFFICEROLE OF THE SHORT-TERM RENTAL MARKET60ECONOMIC IMPACTS, 201963120 Broadway31st FloorNew York, NY 10271RECOVERY PROJECTIONS65 2020 City of New YorkTel .Fax.1-212-720-33001-212-720-3488http://www.New York City.gov/planningNEW YORK CITY HOTEL MARKET OUTLOOK72New York City Projected Hotel Demand72Outlook and Future Trends75APPENDIX I: LITERATURE REVIEW87APPENDIX II: HOTEL ASSET CLASSES89APPENDIX III: HOTEL SUBMARKET MAP91
N E W YO R K C I T Y D E PA R T M E N T O F C I T Y P L A N N I N GN E W YO R K C I T Y H OT E L M A R K E T A N A LYS I STable of TablesTABLE 1: PERMANENT HOTEL CLOSURES IN NEW YORK CITY CONFIRMED BY HANYC, OCTOBER 202035FIGURE 3: DISTRIBUTION OF HOTEL ROOMS IN NEW YORK CITY BY CLASSIFICATION,JANUARY–SEPTEMBER 2020TABLE 2: PERMANENT HOTEL CLOSURES REPORTED IN THE PRESS BUT NOT CONFIRMED BY HANYC,OCTOBER 20203136FIGURE 4: PERCENTAGE OF ROOMS CLOSED BY CLASSIFICATION, NEW YORK CITY,JANUARY–SEPTEMBER 2020TABLE 3: BUSINESS AND LEISURE TRAVEL, NYC AND U.S.7332TABLE 4: EXISTING HOTEL DEMAND, SEPTEMBER 202074FIGURE 5: NEW YORK CITY REVPAR TRENDS, JANUARY 2018–SEPTEMBER 202033TABLE 5: PRE-COVID NYC HOTEL DEMAND, JANUARY 202075FIGURE 6: NEW YORK CITY REVPAR TRENDS, JANUARY 2018–SEPTEMBER 202034TABLE 6: LEISURE HOTEL DEMAND PROJECTIONS BY BOROUGH, 2020–203577FIGURE 7: PERCENTAGE CHANGE IN ROOM CLASS TYPE BY BOROUGH, JANUARY–SEPTEMBER 202038TABLE 7: BUSINESS HOTEL DEMAND PROJECTIONS BY BOROUGH, 2020–203578FIGURE 8: MANHATTAN HOTEL MARKET REVPAR TRENDS, JANUARY 2018–SEPTEMBER 202040TABLE 8: PROJECTED ROOM DEMAND BY BOROUGH AND TRAVEL TYPE, 2025–203579FIGURE 9: UPPER EAST SIDE/UPPER WEST SIDE/HARLEM/UPTOWN HOTEL MARKET REVPAR TRENDS,JANUARY 201–SEPTEMBER 202041TABLE 9: ROOM CLOSURES AND REOPENINGS, FALL 202080TABLE 10: GROSS UNMET ROOM DEMAND BY BOROUGH, TEMPORARILY CLOSED ROOMS REOPEN,2025–2035FIGURE 10: MIDTOWN WEST/TIMES SQUARE HOTEL MARKET REVPAR TRENDS, JANUARY 2018–SEPTEMBER 20208143TABLE 11: GROSS UNMET ROOM DEMAND BY BOROUGH, TEMPORARILY CLOSED ROOMS PERMANENTLY CLOSE,2025–2035FIGURE 11: MIDTOWN EAST HOTEL MARKET REVPAR TRENDS, JANUARY 2018–SEPTEMBER 20204582FIGURE 12: MIDTOWN SOUTH HOTEL MARKET TRENDS, JANUARY 2018 – SEPTEMBER 202047TABLE 12: RESIDUAL ROOM DEMAND BY BOROUGH, 2020-20358449TABLE 13: ADJUSTED ROOM DEMAND BY BOROUGH, 2020-203585FIGURE 13: SOHO/UNION SQUARE/VILLAGE/TRIBECA/LOWER EAST SIDE HOTEL MARKET TRENDS,JANUARY 2018–SEPTEMBER 2020FIGURE 14: FINANCIAL DISTRICT HOTEL MARKET TRENDS, JANUARY 2018–SEPTEMBER 202050FIGURE 15: QUEENS HOTEL MARKET TRENDS, JANUARY 2018–SEPTEMBER 202052FIGURE 16: BROOKLYN HOTEL MARKET TRENDS, JANUARY 2018–SEPTEMBER 202055FIGURE 17: BRONX HOTEL MARKET TRENDS, JANUARY 2018–SEPTEMBER 202058FIGURE 18: STATEN ISLAND HOTEL MARKET TRENDS, JANUARY 2018 – SEPTEMBER 202060FIGURE 19: NEW YORK CITY AIRBNB LISTINGS, JANUARY 2020 – SEPTEMBER 202062FIGURE 20: DIRECT SPENDING, LEISURE VS. BUSINESS AND DOMESTIC VS. INTERNATIONAL TRAVELERS,201963FIGURE 21: VISITOR SPENDING BY CATEGORY (IN BILLIONS), 201964Table of FiguresFIGURE ES-1: NYC HOTEL ROOM SUPPLY AND DEMAND, 2020-2035, TEMPORARILY CLOSEDROOMS REOPENIIFIGURE ES-2: NYC HOTEL ROOM SUPPLY AND DEMAND, 2020-2035, TEMPORARILY CLOSEDROOMS BECOME PERMANENTLY CLOSEDIIFIGURE 1: NET IMPACT OF COVID-19 ON NEW YORK CITY HOTELS AND ROOMS,JANUARY–SEPTEMBER 202029FIGURE 22: NYC HOTEL ROOM SUPPLY AND DEMAND, 2020-2035, TEMPORARILY CLOSEDROOMS REOPEN82FIGURE 2: GEOGRAPHIC DISTRIBUTION OF HOTEL ROOMS IN NEW YORK CITY BY BOROUGH,JANUARY–SEPTEMBER 202030FIGURE 23: NYC HOTEL ROOM SUPPLY AND DEMAND, 2020-2035, TEMPORARILY CLOSEDROOMS BECOME PERMANENTLY CLOSED83
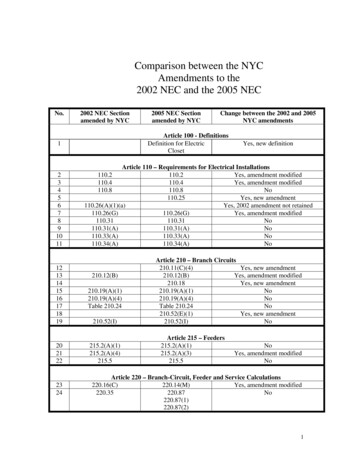
N E W YO R K C I T Y D E PA R T M E N T O F C I T Y P L A N N I N GN E W YO R K C I T Y H OT E L M A R K E T A N A LYS I SExecutive SummaryThis report presents an overview of the hotel industry and accommodation market in New York City, pre-COVIDand post-COVID, as well as current and projected future conditions. It is intended to provide guidance to theNew York City Department of Planning (DCP) regarding the potential impacts of imposing a Special Permitfor hotel development throughout New York City. It analyzes trends related to hotel development patterns andtypologies, demand drivers, occupancy and revenue and projected development pipeline for hotel constructionand delivery, with particular focus on the current and projected impacts of COVID-19 on the hotel industry.FIGURE ES-1: NYC HOTEL ROOM SUPPLY AND DEMAND, 2020-2035, TEMPORARILY CLOSED ROOMS REOPEN170,000136,000102,00068,000Key FindingsNew York City’s robust visitor numbers before the COVID-19 pandemic generated strong demand for hotelrooms, reflected by recent average occupancy rates that were among the highest of any urban market in theUnited States. With the pandemic, the hotel industry throughout the U.S. suffered and the New York City hotelmarket, as a result of its characteristics and specific dependencies to international and business travel and thebroader tourism infrastructure (e.g., Broadway), experienced an even greater drop in demand relative to nationallevels. Several industry analysts project that the New York City tourism sector and related hotel demand will notrecover until 2025. While a return to pre-COVID levels of tourism by 2025 is projected, it is dependent on a varietyof factors that make predicting a recovery year challenging.The supply side of the hotel market has also seen significant negative impacts. Because the market has seennearly 40,000 rooms go offline since the COVID pandemic began, the analysis evaluates a potential range ofhotel supply to meet future demand bookended by two scenarios. Scenario 1 assumes all confirmed closed hotelsremain out of the hotel inventory, but all temporarily closed hotels return by 2025. Scenario 2 assumes all hotelsthat were closed either permanently or temporarily as of Fall 2020 permanently close.1As seen in the following figures, despite permanent hotel room reductions, either resulting from immediateclosures in the wake of the pandemic or other factors detailed in this report and given a projected 2025 return topre-COVID growth rates, the analysis finds that by 2035 there will be net residual demand (total future demandminus today’s existing and permitted supply) for between 21,500 additional hotel rooms (Scenario 1) and 52,400additional hotel rooms (Scenario 2) citywide.It is important to note that net residual demand may not be met if a significant portion of the currently closed hotelrooms in the City are unable to reopen and/or if supply is unable to grow during and after recovery. The timing ofrecovery will require getting to positive public health outcomes, as well as other market factors supporting newhotel development, which are subject to many variables. We have noted these risk factors in the analysis.34,0000Jan. 2020IAs presented in Section 3, as of Fall 2020 there were 3,500 rooms permanently close and another 34,300 roomstemporarily closed. Temporarily closed rooms include those that have not issued WARN notices to the City andwere not otherwise confirmed permanently closed by industry stakeholders.202520302035DEMANDSUPPLYScenario 1: Assume all temporarily closed hotel rooms reopen and pipeline rooms delivered by 2025.Assume demand recovery in 2025 and historic 3.7% annual growth rate in demand for 2025–2035.SOURCES: STR; HANYC; BJH; BAE; all 2020.FIGURE ES-2: NYC HOTEL ROOM SUPPLY AND DEMAND, 2020-2035, TEMPORARILY CLOSED ROOMSBECOME PERMANENTLY CLOSED170,000136,000102,00068,00034,0000Jan. 20201Sept. 2020Sept. 2020202520302035DEMANDSUPPLYScenario 2: Assume no temporarily closed hotel rooms reopen and pipeline rooms delivered by 2025.Assume demand recovery in 2025 and historic 3.7% annual growth rate in demand for 20252035.SOURCES: STR; HANYC; BJH; BAE; all 2020.II
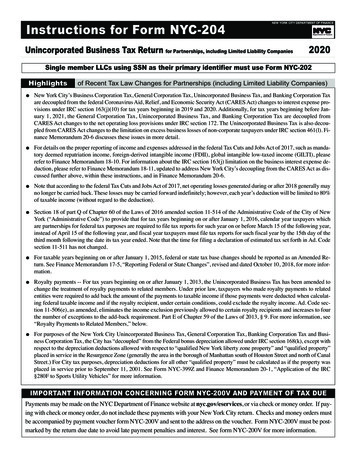
N E W YO R K C I T Y D E PA R T M E N T O F C I T Y P L A N N I N GN E W YO R K C I T Y H OT E L M A R K E T A N A LYS I SMethodologyHotel Demand DriversA general New York City market overview is followed by a more in-depth analysis of hotel submarkets withinNew York City, which include each borough as well as intra-borough submarkets. The final section of the reportprovides an outlook for hotel development based on an analysis of supply and demand recovery projections, aswell as forecasts as to how projected future New York City hotel room supply would be able to meet projectedfuture demand, absent any land use restrictions on future hotel development in the city. Demand drivers includevisitor projections; supply drivers include estimation of the number of hotels that will permanently close due tothe pandemic and how many hotel projects are in the development pipeline.The hotel industry in New York City depends on demand from both domestic United States-based travelers andoverseas visitors. As New York City is a larger international destination than most other markets in the UnitedStates, New York City hotels have historically been more dependent on international visitors, who tend to staylonger and spend more. In 2019, New York City drew a record 66.6 million visitors, a 2.4 percent increase over 2018and reflective of an uninterrupted 12-year run of consecutive increases in visitor counts. The indefinite travel banimposed by the U.S. government on travelers from many countries due to the pandemic means that internationaltravel, a vital component of the city’s hotel demand, has virtually disappeared. The closure of attractions,entertainment and restaurants in the city has served as a discouragement for domestic travelers as well. By theend of 2020, New York City is expected to see only 22.2 million visitors, a 67 percent decline from 2019.In preparing this report, the Consultant Team relied on both primary and secondary data sources, includingstakeholder interviews, proprietary data from Smith Travel Research (STR) regarding the New York City lodgingindustry, and a literature review that included market reports and periodicals.New York City Hotel Supply and TrendsAccording to Smith Travel Research (STR), a third-party data vendor that provides hotel industry data, as ofJanuary 2020, there were 127,810 hotel rooms in over 705 hotel properties in the five boroughs of New York City.During the five years between 2015 and 2019, New York City saw a significant growth of hotel supply, with a 40percent increase in rooms coming on-line over the previous five-year period. Another feature of this period washotel supply growing across all five boroughs and not just Manhattan.In March 2020, New York City’s tourism sector, along with much of the rest of the city’s economy, came to asudden halt as the global coronavirus pandemic spread widely in the city. Hotels shuttered, some temporarilyand some permanently, as travel to the city abruptly ceased. As of October 2020, over 37,000 hotel rooms in thecity remained closed, over ten percent of them closed permanently.Projected Pipeline of HotelsAccording to data from the New York City Department of Buildings that was provided to the Consultant Teamby the DCP, there are currently 30,300 pre-construction hotel rooms in the development pipeline. These areconsidered active development projects that have filed an application, have had an application approved, or havebeen permitted for construction.22IIIThere are two major hotel demand drivers in New York City and the nation as a whole - leisure travel, whichincludes both tourism and visitation of family and friends, and business travel, which includes conference andgroup travel as well as individual business travel. According to both NYC & Company and U.S. Travel Associationdata, leisure travel in New York City historically comprises approximately 79 percent of room demand whilebusiness travel has historically made up the remainder, or approximately 21 percent. Both leisure and businesstravel to New York City are currently severely diminished.Occupancy and Room RatesNew York City’s robust visitor numbers before the pandemic had led to a strong demand for hotel rooms,reflected by annual average occupancy rates that were among the highest of any urban market in the UnitedStates, ranging from 85-90 percent.The pandemic’s impacts have drastically decreased hotel occupancy. To date, the NYC hotel market has seennearly 40,000 rooms go offline, including rooms that have gone offline since September 2020. Of this total, 3,484are permanently closed and not expected to return to the market, while another 3,390 that were temporarilyclosed in Fall 2020 have already reopened in that they are accepting reservations for 2021. This leaves a net totalof 34,288 temporarily closed rooms that could come back online as demand recovers.However, some industry stakeholders interviewed indicate that up to 25 percent of rooms may not reopen at all.While the summer of 2020 saw some tourism return to New York City, hotel occupancy only reached 30 percent,with two-thirds of that occupancy rate is attributable to government contracts to accommodate homelessresidents and healthcare workers at below-market rates. Room rates are also at historically low levels.Hotels permitted for construction include those that have begun construction but have not achievedsubstantial completion (80 percent complete and/or achieved certificate of occupancy). City records for thisperiod show no hotels that have achieved substantial completion but are not yet open.IV
N E W YO R K C I T Y H OT E L M A R K E T A N A LYS I SRecovery ProjectionsThe hotel industry has been among the hardest hit sectors by the pandemic and New York City hotels haveexperienced greater negative impacts than hotels across the United States as a whole. Several industry analystsand independent economic and real estate analyses project that the US hotel sector will likely recover by 2023; yet,because of its characteristics and specific dependencies, New York City’s hotel sector will not recover until 2025.While 2025 is the projected year of recovery, a return to pre-COVID levels of tourism depends on a variety offactors, including confidence of travelers and positive public health outcomes in the coming years. Within thisrecovery, it is estimated that leisure travel will return before business travel and domestic travel will return beforeinternational travel. All projections assume no recovery until after a vaccine is widely available. Because of thisfactor in addition to consumer confidence, it is assumed that recovery will be slower in the period 2021 – 2023 andwill then accelerate before stabilizing to pre-COVID levels in 2025.N E W YO R K C I T Y D E PA R T M E N T O F C I T Y P L A N N I N GIf tourists delay travel because of economic losses or declining income, some pipeline hotels could be delayed ornot built. Further, current land use restrictions specific to new hotel development that are now being consideredby the DCP, may also impede future hotel supply in the city.Finally, in the short- and mid-terms, the difficulty of hotel projects to obtain financing or approval may stifle thereturn of travel demand. Tourists who are willing and able to travel to New York City may find that there are notenough rooms available, as supply increases lag demand while banks become more pessimistic on the return ofthe tourism and lodging markets.New York City Hotel Market OutlookUsing historic pre-COVID visitation projection data, along with national tourism demand trends and New YorkCity hotel development pipeline information from the Department of Buildings, the report’s market outlookanalysis evaluates projected hotel room demand and supply growth for New York City through 2035. As notedabove, based on data and recovery projections for the New York City hotel market, this analysis assumes that thecity’s hotel market will have fully recovered, reaching pre-COVID January 2020 demand levels, in 2025.Assuming a range of hotel room supply reductions, those resulting from immediate observed closures in thewake of the pandemic, and other factors detailed in this report, the analysis shows that by 2035, there will beresidual, or net, demand for between 21,500 and 52,400 additional hotel rooms citywide that may not be metunless hotel owners are able to reopen hotel rooms and/or grow supply via new development. Some additionalnew hotel closures could yet occur, as government contracts for temporary housing expire or demand for shortterm, COVID related stays dissipates. These potential closures are not possible to anticipate. However, the rangespresented account for a variety of likely permanent closure possibilities, which could include new, additionalclosures.It should be noted that some of the future hotel rooms identified as part of the development pipeline may endup being delayed or unbuilt for a variety of reasons. Hotels are the most difficult real estate project to acquirefinancing. If some of the hotels do not proceed or become hybrid residential/hotel projects in order to attractfunding, the unmet demand could be substantially higher than projected here. Additionally, it is unknown howdeep or long of a recession the global, national, and NYC economies will face due to COVID-19.VVI
N E W YO R K C I T Y D E PA R T M E N T O F C I T Y P L A N N I N GN E W YO R K C I T Y H OT E L M A R K E T A N A LYS I SIntroductionAs of January 2020, New York City remained one of the world’s most popular travel destinations, thethird largest hotel market in the United States after Las Vegas and Orlando, and the largest hotel supplypipeline in the nation according to Lodging Magazine.1 In 2019, New York City drew a record 66.6 millionvisitors, a 2.4 percent increase over 2018 and reflective of an uninterrupted 12-year run of consecutive increases invisitor counts. 28 million of those visitors stayed in hotels in the city, accounting for over 13 billion in direct andindirect business sales.While the summer of 2020 saw some tourism return to New York City, hotel occupancy only reached 30 percent.Two-thirds of that occupancy rate was attributable to government contracts to accommodate homeless residentsand healthcare workers at below-market rates, making the impact on hotels even more severe. By the end of2020, New York City is expected to see only 22.2 million visitors, a 67 percent decline from 2019, with a significantportion being day-trippers from the Tri-State region. As of October 2020, over 37,000 hotel rooms in the cityremained closed, over ten percent of them permanently.2019 also saw the continuation of an unprecedented boom in hotel development in New York City that had begunin 2007 and has added over 54,100 hotel rooms since that year, a 73 percent increase in supply. This growth wasremarkable for its endurance as the five years between 2015 and 2019 saw over 21,000 hotel rooms come onlinein the city, a 40 percent increase over the number of rooms that came online during the previous five-year period.Current forecasts estimate the recovery of the New York City tourism sector to 2019 levels will not take placeuntil the end of 2024 or the beginning of 2025. NYC & Company estimates that full recovery of the internationalvisitors’ segment may take longer. A variety of factors, including positive public health outcomes and consumerconfidence makes projecting a recovery year challenging. With the schedule for recovery of the sector uncertain,some hotel owners are actively looking to convert their hotels to other uses. When tourism and conventions doreturn to the city, however, it will be necessary that the city have sufficient hotel rooms to accommodate them.As a global destination, New York City continued to grow in popularity over the past five years and, notably, thispopularity now expanded beyond Manhattan to the other boroughs. Reflecting this trend, another feature ofthis period of hotel growth has been its occurrence across all five boroughs. Since 2010, Queens and Brooklynhave both seen hotel room count increases of over 50 percent, with similar growth rates in the smaller marketsof the Bronx and Staten Island. Also noteworthy has been the expansion of hotel development into areas of thecity that had never supported substantial hotel development before, including light manufacturing districts inevery borough.The City’s special permit requirement for new hotel development in M1 zoning districts, instituted at the endof 2018, has halted new hotel development in these areas that wasn’t grandfathered by the text amendment.However, 2019 saw almost 6,000 new hotel rooms added to the city’s supply with almost 20 percent of thecity’s hotel room inventory outside Manhattan. Despite this new supply, hotel occupancy rates in New York Cityremained among the highest in the nation at over 88 percent.COVID Pandemic ShutdownIn March 2020, New York City’s tourism sector, along with much of the rest of the city’s economy, came to asudden halt as the global coronavirus pandemic reached the Tri-State region and spread widely in the city. Hotelsshuttered, some temporarily and some permanently, as both leisure and business travel to the city abruptlyand effectively ceased. The closure of Broadway theaters, restaurants and other attractions in New York City,in addition to the indefinite halt to a majority of international travel to the United States meant that a vitalcomponent of the city’s hotel demand completely disappeared. In 2018, international visitors accounted for over37 percent of all hotel guests in the city, an all-time record, with Canada, Europe, Brazil and China accounting forthe majority of these travelers.2 With no definitive timetable for relaxation of international travel restrictions,recovery of the hotel sector remains far off.121"Five U.S. Markets with the Largest Hotel Pipelines," Lodging Magazine, August 5, 2019.NYC & Company, Hotel Visitors: Visitor Market Profile, August. 2019.Purpose of StudyThe New York City Department of City Planning (DCP) is studying the introduction of a Special Permit for all newhotel development citywide. The restriction under study may have potential long-term impacts on the tourismindustry, an important economic driver in New York City that generated 71 billion in economic activity and 7billion in local tax revenue in 2019. The proposed action could also have potential effects on industry sectorsbeyond hotels that are reliant on tourism, including food and beverage, retail, entertainment, and transportation.Accordingly, a detailed study of the hotel industry in New York City - including recent pre-COVID developmenttrends, the impacts of the COVID pandemic, and forecasts for recovery and future demand—is warranted.This report provides an overview of the pre-COVID hotel industry in New York City over the last decade and trendsrelated to hotel development patterns and typologies, factors that drive hotel demand, occupancy and revenueand projected development pipeline, including analyses of pre-COVID hotel markets in each borough andspecific submarkets. Additionally, the report includes economic impact analysis of the hotel industry in the city.The report then examines the impact of the COVID pandemic on the city’s hotel industry and current conditionsas of the fall of 2020, including hotel closures and trends in closures, trends in occupancy and room rates, the roleof the short-term rental market and economic impacts. The report also includes a detailed New York City hotelmarket and supply profile as of October 2020.Finally, the report provides recovery projections for leisure, business, domestic and international travel anduses these projections to inform a post-recovery New York City hotel market outlook that assumes no specialpermit restrictions. This outlook includes projected hotel demand drivers for leisure and business travel, existingroom demand and future hotel demand projections for leisure and business travel, projected room demand byborough and travel type, and residual room demand.2
N E W YO R K C I T Y D E PA R T M E N T O F C I T Y P L A N N I N GN E W YO R K C I T Y H OT E L M A R K E T A N A LYS I SMethodologyIn analyzing current market trends and outlook related to projected hotel development patterns in New York Cityand projected forecasts for post-COVID recovery of the city’s tourism and hotel sectors, this report relies on bothprimary and secondary data sources. Primary data sources used by the Consultant Team include interviews withhotel developers, tourism industry representatives and local economic development professionals, in additionto NYC & Company. The principal secondary data source used was STR’s proprietary database on New York Cityhotel inventory, supplemented by data from NYC & Company and the City of New York. The Consultant Teamalso reviewed numerous reports and media articles related to the New York City and national hotel industryand economic forecasts for the recovery of the New York City, national and global tourism and hotel sectors. Adetailed description of major data sources follows.Data SourcesPrimary DataThe Consultant Team collected original primary data through an interview process that extended over severalweeks in the fall of 2020. In total, the Consultant Team undertook interviews with hotel developers, localeconomic development leaders, NYC & Company staff, real estate professionals, leadership from the HotelAssociation of New York, and others who are able to speak knowledgeably about hotel development in New YorkCity, trends and outlook, demand drivers, supply, and impacts.Secondary DataThe Consultant Team used secondary data sources for specific analyses, which are cited throughout the report.The main secondary data sources used in the report are proprietary datasets from STR, which the ConsultantTeam analyzed in depth at various geographic and hotel typology levels, in addition to the impact that the COVIDpandemic had on temporary and permanent hotel closures beginning in March of 2020. The STR datasets are: STR Hotel Inventory for New York City for the 2009—2019 Period: This dataset describes historic andexisting hotel inventory as well as pipeline hotel developments in New York City for the requested period.The Consultant Team purchased an updated version of this dataset directly from STR in January 2020. STR Hotel Inventory for New York for 2020: The Consultant Team purchased an updated version of theHotel Inventory for New York City from STR in October 2020 in order to document changes to hotelinventory since the onset of the COVID pandemic. STR inventory notes those hotels that have ceasedreporting occupancy data but do not explicitly confirm if a hotel has permanently closed.3 STR Trends Data: This dataset compiles and averages hotel operating statements from participatinghotels in order to provide aggregated occupancy rates ADR (average daily rates), RevPAR (revenue peravailable room) and revenue year-over-year with percentage changes. The Consultant Team originallypurchased this dataset directly from STR in January 2020, which gave a ten-year trends overview throughthe end of 2019. The Consultant Team then purchased an updated dataset in October 2020 in order toreview the impacts that the COVID pandemic had on hotel occupancy, rates and revenue in New York City.The Consultant Team used additional secondary data sources, including: New York City Department of Building (DOB) Data: The Consultant Team reviewed DOB permit dataprovided by the New York City Department of City Planning that showed building permits or hotelprojects under construction and in the pre-construction process as of October 2020 NYC & Company Reports: The Consultant Team reviewed NYC & Company's 2019 Travel & TourismTrend Report, which covered the tourism industry in the city through 2018 and the 2020 report All inNYC: Roadmap for Tourism’s Reimagining and Recovery, which provided an overview of the city’stourism industry in 2019. These summaries provide an overview of New York City travel and tourismtrends, including total domestic and international visitors and visitation by segment, in addition to hotelperformance. NYC & Company also provided the Consultant Team with economic impact data for thetourism and lodging sectors. It should be noted that, because of COVID’s unprecedented impact on thecity’s tourism and hotel sectors, NYC & Company did not issue a report or economic overview for 2020. New York State Department of Labor Worker Adjustment and Retraining Notification (WARN) Reports: TheNew York State Worker Adjustment and Retraining Act requires covered businesses in New York State toprovide early warnings of closures and layoffs to workers, employee representatives, the State Departmentof Labor (NYSDOL), and local workforce development boards. As many hotels faced sudden and unexpectedclosures or extreme slowdowns in business due to the COVID pandemic, WARN notices were filed as hotelslaid off or furloughed employees. The Consultant Team reviewed NYSDOL’s WARN reports to determinethose hotels that were no longer operating as of October 2020. WARN notices by themselves, however, are notindicat
new york city hotel market analysis new york city department of city planning table of tables table 1: permanent hotel closures in new york city confirmed by hanyc, october 2020 35 table 2: permanent hotel closures reported in the press but not confirmed by hanyc,