Transcription
Employees' Retirement System of the State of Rhode IslandDecember 16, 2016Amit Chopra, CFA0Frances L. Coombes
Table of ContentsI.About Western Asset US Government CapabilitiesII.The Case for Long TreasuriesIII.People, Philosophy and ProcessIV. Model PortfolioV.1Appendix
About Western Asset2
About Western AssetWestern Asset is a globally integrated fixed-income manager, sourcing ideas and investment solutions worldwideWestern Asset At a Glance Founded in 1971. Independent affiliate of LeggMason since 1986 Fixed-income value investors 444.5 billion (USD) AUM– 365.4 billion (USD) long-term assets– 79.1 billion (USD) cash and cashequivalent assets 842 employeesOrganizational Pillars AUM by Sector – Total 444.5 billion (USD)Global IG CorporateSovereign/TreasuryCash & Cash EquivalentsMBS/ABSEmerging Markets DebtGlobal High-YieldUS MunicipalGlobal Inflation-linkedOtherClients firstGlobally integratedTeam-basedActive fixed-incomeIntegrated risk management998279563926201330Western Asset’s Deep Global Integration Allows Us to Source Investment Ideas and Investment Solutions Across RegionsInvestmentManagement 125 investment professionals onfive continents and in seven offices 21 years of average experience 38 portfolio and quantitativeanalysts in portfolio operations 172 staff dedicated to client serviceClient Service Specialized teams to meet& Marketingindividual client needsRiskManagement& Operations Independent risk managementfunction with 40 professionalsincluding 10 PhDs 368 staff dedicated to globallyintegrated operationsSource: Western Asset. As of 30 Sep 16*Splits time between Hong Kong and Singapore offices3Global Footprint (AUM in USD billions)LondonNew YorkInv. Professionals: 17Managed: 38.5Serviced: 27.1Total Staff: 67Inv. Professionals: 22Pasadena (HQ)DubaiManaged: 133.7Inv. Professionals: 54 Serviced: 114.5Serviced: 37.0Managed: 227.8Total Staff: 1Total Staff: 89Serviced: 184.6Total Staff: 558São PauloInv. Professionals: 18Managed: 12.0Serviced: 11.3Total Staff: 65Hong KongTotal Staff: 1*SingaporeInv. Professionals: 5Managed: 5.5Serviced: 19.8Total Staff: 22TokyoInv. Professionals: 4Managed: 8.5Serviced: 46.3Total Staff: 24MelbourneInv. Professionals: 5Managed: 18.5Serviced: 3.9Total Staff: 16
Investment SolutionsWestern Asset offers a full range of fixed-income products that can be tailored to meet the needs of our clientsIdentifying Investment Solutions to Align With Client Objectives and Risk Tolerances Protect from rising rates Protect from inflation Preserve capital Diversify globally Hedge liabilities Enhance income Generate tax-free income Generate total returnSelected Investment StrategiesBroad Market 4Global Core/Core Full DiscretionRegional Core/Core Full DiscretionRegional IntermediateGlobal SovereignCredit Global CreditInvestment-Grade CreditGlobal High-YieldUS Bank LoansUS High-YieldShort-Duration High IncomeUnconstrained / Alternatives Macro OpportunitiesTotal Return UnconstrainedGlobal Total ReturnMulti-Asset CreditGlobal Multi-SectorTail Risk ProtectionLong Duration / LDIMortgage / Asset-Backed Long Duration Long Credit Liability-Driven Investing Inflation-LinkedUS MunicipalsLiquidity / Short Duration US TIPS Global Inflation-Linked Short Duration Muni Intermediate Muni Managed Muni Money Market Enhanced Cash Limited DurationAgency Mortgage-Backed SecuritiesStructured ProductsDiversified Loan OpportunitiesMBS OpportunitiesEmerging Markets Debt EMD DiversifiedEMD Local Currency Sovereign DebtEMD USD Corporate CreditEMD USD SovereignEMD Total Return
About Western Asset – ClientsCommitted to excellence in client serviceRepresentative Client ListCorporateAllergan, Inc.Allied Domecq Pension FundAmerican Cast Iron Pipe CompanyArcelorMittal USA Inc.AT&T Investment Management CorporationAtmos Energy CorporationBayer CorporationCampbell Soup CompanyChrysler LLCClark Enterprises, Inc.Consolidated Edison Company Of New York, Inc.Consolidated Rail CorporationEnergy Transfer Partners LPGraphic Packaging International IncorporatedHawaiian TelcomHighbury Pacific Capital Corp.International Paper CompanyJohn Lewis Partnership Pensions TrustLennox International, Inc.LyonRoss Capital Management LLCMacy's, Inc.National Grid USANestle USA, Inc.Nisource, Inc.Orbital ATKPCS Administration (USA), IncPensioenfonds Horeca & CateringPPG IndustriesSouthern California EdisonSouthern CompanyStichting Pensioenfonds DSM-NederlandThe Dun & Bradstreet CorporationThyssenKrupp North America, IncUnilever United States, Inc.Unisys CorporationVidanova Pension ManagementPublic / Gov. / Sovereign WealthMulti-Employer / UnionsArkansas Local Police and Fire Retirement SystemCalifornia State Teachers' Retirement SystemCity of Grand RapidsCity of OrlandocompenswissEast Bay Municipal Utility DistrictERS of the City of Baton Rouge & Parish of E. BRERS of the State of Rhode IslandFife Council Pension FundFresno County Employees' Retirement AssociationGloucestershire County CouncilGovernment of Bermuda Public FundsHampshire County CouncilIndiana State Treasurer's OfficeIowa Public Employees' Retirement SystemKansas Public Employees Retirement SystemLA County Employees Retirement AssociationMarin County Employees' Retirement AssociationMinnesota State Board of InvestmentNew Jersey TransitNorth Dakota State Investment BoardOhio Police & Fire Pension FundOrange County Transportation AuthorityOregon Investment CouncilPhoenix City Employees' Retirement SystemPublic Employee Retirement System of IdahoPublic School Teachers' Pension and Retirement Fundof ChicagoSalt River Project Agricultural Improvement and PowerDistrictSchool Employees Retirement System of OhioSeattle City Employees Retirement SystemState of Ohio Bureau of Workers CompensationSurrey County CouncilTennessee Valley AuthorityVentura County Employees' Retirement AssociationVirginia Retirement SystemWashington Metro Area Transit AuthorityWichita (KS) Retirement SystemsWyoming Retirement System1199SEIU Health Care Employees Pension FundAlaska Electrical Trust FundsAutomotive Machinists Pension TrustBert Bell / Pete Rozelle NFL Player Retirement PlanBoilermaker Blacksmith National Pension TrustCarpenters District Council of Kansas CityDirectors Guild of America-PPHPHeating, Piping and Refrig Local 602 Pension FundHeavy & General Laborers’ Locals 472/172IBEW Local 25IBEW Local No. 9IUOEE Construction Ind Ret Plan, Locals 302 and 612Iron Workers Local #11 Benefit FundsLine Construction Benefit FundMajor League Baseball Players Benefit PlanNational Asbestos WorkersNational Education Association of the United StatesNew England Healthcare Emp Union,1199, AFL-CIOOperating Engineers Local #428 Trust FundsRetail Wholesale & Department Store UnionS. Nevada Culinary & Bartenders Pension Trust FundUA Union Local No. 290 Plumber, Steamfitter &Shipfitter Industry Pension TrustUnited Food & Commercial Workers Union Local 919W. Washington Laborers Employers Pension TrustHealthcareAbington Memorial HospitalAscension Investment ManagementBaptist Healthcare System, Inc.Baylor Scott & White HoldingsCatholic Health InitiativesCHRISTUS HealthKaiser PermanenteLCMC HealthLehigh Valley HospitalNorthShore University HealthSystemPinnacle Health SystemSisters of Charity of St. Augustine Health System, Inc.St. George CorporationEleemosynaryAbilene Christian UniversityBaha'i' World CentreBill & Melinda Gates Foundation TrustCommonfundCreighton UniversityDomestic & Foreign Missionary Society ECUSAIndiana UniversitySaint Louis UniversityUnited Negro College FundUniversity of Southern CaliforniaUniversity of Wisconsin FoundationVoelcker FoundationWashington CollegeWashington State UniversityInsuranceAAA of Northern California, Nevada, & UtahAmerican Contractors Insurance GroupAnthem, Inc.Blue Cross Blue Shield of MassachusettsCatalina Holdings (Bermuda) LtdGreat-West Life & Annuity Insurance CompanyHealth Care Service CorporationMaryland Automobile Insurance FundOil Investment Corporation Ltd.United Services Automobile AssociationSub-AdvisoryAsset Management One Co., Ltd.AXACathay Securities Investment Trust Co Ltd.ContassurDelphi Capital Management CompanyGuideStone Capital Management, LLCLegg Mason, Inc.Morgan StanleyRussell Investment GroupSEI Investments Management CorporationSumitomo Mitsui Asset Management Company,LimitedAs of 31 Oct 16. Please see the Representative Client List Disclosure in the Appendix for more information. All have authorized the use of their names by Western Asset for marketing purposes.Such authorization does not imply approval, recommendation or otherwise of Western Asset or the advisory services provided.5
Investment Management Organization*S. Kenneth LeechChief Investment OfficerMichael C. BuchananDeputy Chief Investment OfficerDennis J. McNamaraDirector of Portfolio OperationsAndrew J. BelshawUK and EuropeCarl L. EichstaedtUS Broad MarketRobert E. AmodeoMunicipalsGordon BrownGlobalChia-Liang LianEmerging MarketsAsia ex-JapanBrazilKevin K. KennedyLiquidityAmit ChopraLong DurationFrederick R. MarkiUS Inflation-LinkedAnup AgarwalMortgage-BackedAsset-BackedRyan K. BristInvestment-Grade CreditKazuto DoiJapanWalter E. KilcullenUS High-YieldAs of 30 Sep 16*Illustrates direct-reporting only and does not represent the entire investment management team.6Christopher F. KilpatrickGlobal High-YieldAnthony C. KirkhamAustralia and New ZealandRajiv SachdevaQuantitative AnalysisTimothy J. SettelUS Bank Loans
US Government CapabilitiesHistory Managing US government mandates since 1986Assets 10bn in US government only mandates 18bn in long Treasuries (10 years average life) held across the FirmApproach Consultative, customized approachAs of 31 Oct 167
Broad Range of Experience With Government-Focused MandatesClient TypeUS State PensionUS State PensionPlanPlanBloomberg Barclays Custom*U.S. T reasury IndexUS CorporateUS CorporatePensionPensionBloomberg Barclays Barclays 25 ST RIPSU.S. T reasury Index IndexEquity Offset andDeflation HedgeEquity Offset andDeflation HedgeCash Surrogate"Dry Powder"LDI Construct, Offsets'Return Seeking Assets'Alpha TargetNo explicit targets. Exceed 25 bpsTracking Error Target return of client's internal50 bpsteam.10 bps20 bps100 bps225 bpsPassivePassiveInception30 Jun 9331 Dec 1331 Aug 09**8 Feb 16May 13 – Feb 16Select GuidelinesMin 50% UST. Agencies UST onlyallowed. Max 35% toDuration /- 20%Agency MBS and AAA ABS.Max 20% Supras. Max15% to select corporateson approved list.Duration /- 1.5 yrsUST (incl. TIPs) andAgency allowed.Futures allowed.Duration /- 1.0 yrsUST ST RIPS OnlyBroad lattitude overall UST onlyas the long government Duration /- 0.25 yrscomponent is wrappedinto a custom broadmarket benchmark.BenchmarkClient'sStrategic ObjectiveForeign GovernmentAgencyMerrill Lynch T reasuryIndexUniversityEndowmentBofA Merrill Lynch USTreasury Current 10 YrFX reservesTail Risk Hedge13 Sep 13* Custom benchmark 62.5% Bloomberg Barclays US Government Long Bond Index, 18.75% Bloomberg Barclays US Securitized Index, 18.75% Bloomberg Barclays US Investment Grade Corporate Index** Current benchmark adopted 10/1/158
The Case for Long Treasuries9
Know Your IndexNovember 30, 2016Bloomberg Barclays U.S. Aggregate IndexBenchmark Characteristics Market Value ( ) Effective Duration (years) Yield-to-Worst (%)Intermediate TreasuryLong TreasuryBenchmark Characteristics Market Value ( ) Effective Duration (years) Yield-to-Worst (%)19.03 trillion5.862.5730.5Long e Credit31.2# IssuesBroad based fixed income flagship benchmark ofinvestment grade, US denominated, taxable fixed-ratedebt with at least one year to maturitySource: Bloomberg Barclays, Western Asset101.07 trillion17.552.94911620Index of fixed-rate Treasury bonds with at least tenyears to maturity
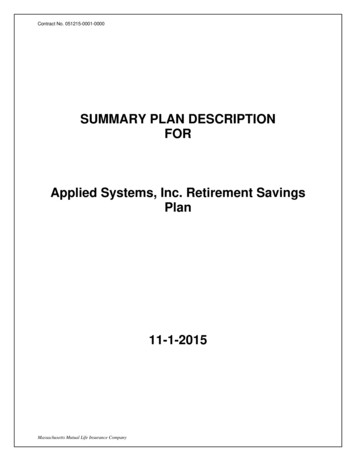
Long Treasuries Outperform in “Risk-Off” PeriodsOctober 31, 2016Calendar Year Returns Since the Turn of the CenturyS&P500Long Treasury403020Percent100-10-20-30-402000 2001 2002 2003 2004 2005 2006 2007 2008 2009 2010 2011 2012 2013 2014 2015 2016YTDAnnualized Return Since 2000 (%)Correlation (2000 to Oct. 2016)Source: Bloomberg Barclays, Western Asset11S&P 5004.17-0.29Long Treasury7.88
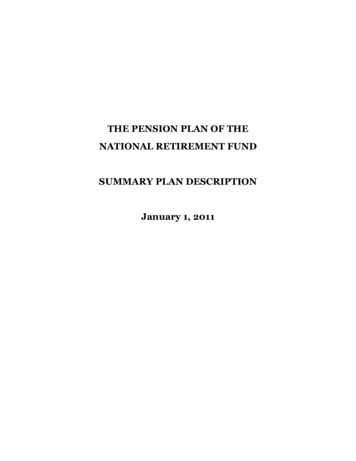
Long Treasuries Have Provided Favorable Diversification BenefitsOctober 31, 2016Growth of 1S&P50060/40 Aggregate60/40 Long Treasury3.0 2.772.5 2.27Percent2.0 2.001.51.00.50.0Dec Sep Jun Mar Dec Sep Jun Mar Dec Sep Jun Mar Dec Sep Jun Mar Dec Sep Jun Mar Dec Sep Jun99 00 01 02 02 03 04 05 05 06 07 08 08 09 10 11 11 12 13 14 14 15 16Annualized Return (2000 to Oct. 2016, %)Peak-to-Trough Equity DrawdownsAug-'00 to Mar-'03 Drawdown (%)Oct-'07 to Feb-'09 Drawdown (%)Source: Bloomberg Barclays, Western Asset12S&P 5004.1760/40 S&P/Agg4.9460/40 S&P/Tsy6.18-42.51-50.95-19.82-32.54-18.05-29.59
People, Philosophy and Process13
PeopleThe US Government investment team leverages Western Asset’s global investment capabilitiesS. Kenneth LeechPortfolio Manager / CIOInvestment Management Professionals Chief Investment Officer: S. Kenneth Leech Deputy CIO: Michael C. Buchanan 127 Investment Professionals on five continents andseven offices, as of June 30, 2016 21 years of average experienceAmit Chopra, CFAPortfolio ManagerFrederick R. Marki, CFAPortfolio ManagerKeith A. Luna, CFAPortfolio ManagerRisk ManagementJay Lin, CFAPortfolio AnalystAlan M. Nadel, PhDPortfolio Risk ManagerNicholas MastroianniPortfolio AnalystScott A. Spear, PhDManager, US Portfolio RiskRafael Zielonka, CFAPortfolio Analyst14Western Asset Investment TeamJohn L. Bellows, PhD, CFAPortfolio ManagerPortfolio AnalystsAs of 31 Aug16US Government Investment TeamProduct SpecialistsJames J. So, CFAProduct SpecialistMajor Investment Committees Global Investment Strategy Committee Global Credit Committee US Broad Strategy Committee Global Emerging Markets Strategy Committee Unconstrained Asset Allocation CommitteeSector and Regional Teams Global credit Investment-grade High-yield Emerging markets MBS/ABS Long duration US municipal Liquidity Insurance USEuropeUKJapanAsiaBrazilAustralia /New ZealandIndependent Risk Management Function Chief Risk Officer: Kenneth J. Winston, PhD Independent evaluation of strategies and risks inportfolios Market and Credit Risk Committee 40 investment risk professionals of which 10 arePhDs, across four offices, as of June 30, 2016
PeopleThe US Broad Strategy Committee sets the overall themes for the US broad market investment strategies.US Broad Strategy CommitteeS. Kenneth LeechChief Investment OfficerAnup AgarwalMortgage andAsset-BackedJohn L. Bellows,CFAFed PolicyRyan K. Brist, CFAInvestment-GradeCreditMichael C.Buchanan, CFADeputy CIO /Global CreditAmit Chopra, CFALong DurationCarl L. Eichstaedt,CFAUS Broad MarketKevin K. KennedyLiquidityChia-Liang Lian,CFAEmerging MarketsMark S. LindbloomUS Broad MarketFrederick R. Marki,CFAInflation-LinkedDennis J.McNamara, CFALimited DurationRajiv SachdevaPortfolio &Quantitative Analysis Sets macro and sector investment themes Meets weekly to evaluate and establish the USinvestment outlook over a 6-9 month horizon.– Within the context of our global investmentoutlook– Based on long-term economic developmentsand market valuations– Leveraging sector input and broad top-downanalysis Evaluates risk factors and potential scenarios.Sets the risk tone for US investment strategiesJulien A. Scholnick,CFAUS Broad MarketAs of 31 Oct 1615Timothy J. SettelBank Loans
Investment PhilosophyThese are the core beliefs that drive our investment decision-making Markets often misprice securities. Prices can deviate from fundamental fair value, butover time, they typically adjust to reflect inflation, credit quality fundamentals and liquidityconditions. Consistently investing in undervalued securities may deliver attractiveinvestment returns.Long-term fundamentalvalue We can systematically identify mispricings. We believe we can identify and capitalizeon markets and securities that are priced below fundamental fair value. We do thisthrough disciplined and rigorous analysis, comparing prices to the fundamental fair valuesestimated by our macroeconomic and credit research teams around the globe. Our portfolios emphasize our highest convictions. The greater the difference betweenour view of fair value and markets’ pricing, the bigger the potential value opportunity. Thegreater the degree of confidence in our view of fundamentals, the greater the emphasis ofthe strategies in our portfolios. We seek diversified sources of returns. Our objective is to meet or exceed ourMultiple diversifiedstrategies16investors’ performance objectives within their tolerances for risk. We seek to diversifyinvestments and add value across interest rate duration, yield curve, sector allocation,security selection, country and currency strategies. We deploy multiple diversifiedstrategies that benefit in different environments so no one strategy dominatesperformance, helping to dampen volatility.
Investment ProcessOur time-tested investment process is designed around our value philosophy and our team-based approach.US Government Investment Process and Team InteractionMacro and CreditInvestment OutlookPortfolio ConstructionInterest Rate DurationYield CurveClient Objectivesand GuidelinesStrategicPortfolioSector / SubsectorRisk ManagementStrategy Committees US Broad Strategy Committee17US Government TeamSecuritySelectionClientPortfolio
Risk ManagementIn our culture, effective risk management is critical to successful portfolio managementIntegrating risk management into portfolio construction and in Risk management is a team effort. Robust communicationthe independent review of portfolio risks strengthens itsand escalation procedures underpin the independence andeffectiveness.transparency of risk management.Client Objectives andRisk nitoredSource: Western Asset18Client ServiceExecutivesPortfolioManagersRisk ManagersRisk Systems and ToolsCompliance ProcessMarket and CreditRisk CommitteeAlignedInvestment CommitteesClient
Model Portfolio19
Model Portfolio ConsiderationsCURRENT UNDERSTANDING OF MANDATEMODEL PORTFOLIO COMMENTSStrategic ObjectiveStructural Biases for Long Treasury Portfolios “Crisis risk offset” allocationBenchmark Bloomberg Barclays US Treasury Long Index Curve-steepener Overweight duration Liquidity premium Volatility premiumEligible Securities and limits Tracking error: 2% Agency MBS: max. 50% U.S. Treasuries: max. 100% Non-U.S. Dollar Treasury Denominated: No Only Treasuries and Agencies are allowed Non-benchmark: max. 50% Duration range: /- 10% of benchmark¹Separate Trading of Registered Interest and Principal of Securities20Portfolio Construction Notes SUMMARY: high quality portfolio with specific tilts to enhancebase case yield Curve-steepener ( 1.25yrs) provides additional “carry”/return Duration is flat relative to the benchmark due to the risks aroundpotential changes to fiscal, monetary, and regulatoryenvironment Model portfolio out-yields the benchmark by 22 basis points(0.22%)– Yield enhanced through modest allocations to less liquidsecurities such as agency debentures,STRIPS¹, and off-therun Treasuries
Sector ExposureDecember 5, 2016Model Portfolio (%)Cash Flow Yield: 3.16TreasuryDurationContrinbution (years)0.2100.0Agency0.0Cash & Cash Equivalents0.013.2Cash & Cash Equivalents2520151050Treasury93.1AgencyMarket ValueBloomberg Barclays U.S. Long Treasury Index (%)Cash Flow Yield: 2.94Notional Market ValueModel PortfolioDerivativesBloomberg Barclays U.S. Long Treasury Index17.516.01.5TreasuryNameBarclays U.S. Long Treasury IndexModel Portfolio17.517.50.0AgencyKey Rate DurationTotalDuration0.5-Year 2-Year 5-Year 10-Year 20-Year 30-Year 0.140.900.20-1.27-0.04*Represents active exposureNote: Sector exposure includes look-through to any underlying commingled vehicles if held. All weightings are a percentage of total market value. A negative cash position may be reported, which is primarily due to the portfolio’sunsettled trade activity. Data may not sum due to rounding. The benchmark does not provide an allocation to the “Emerging Markets” sector. The emerging market sector allocation shown for the benchmark above is based onWestern Asset’s emerging market countries definition for comparison purposes.21
WISER Risk Report, US Long Treasury Model PortfolioBenchmark: Bloomberg Barclays U.S. Long Treasury IndexPortfolio MV (millions, USD): 315Spread19Spread27DiversifiedRisk47As of December 5, 2016Annual Tracking Error Standard Deviation(bps)Ex-PostEx-Ante47Risk T argetUndiversifiedRisk62Rates29Volatility n Benefit:24%Spread RiskAgencyTreasuriesCashActive MV (%)13.2%-13.4%0.2%Undiversified Risk (bps)2700Diversified Risk (bps)1900Rates RiskUSD RatesDuration by TenorsShort (6m 2y)Intermediate (5y 10y)Long (20y 30y)Duration by Level/Slope FactorsLevel (10y)Slope (5/30s)Active Duration (yrs)-0.04Undiversified Risk (bps)35Diversified Risk nario Analysis: ScenariosHistoricalReturn to pre-LehmanReturn to November 2008Replay Jun '07 to Nov. '08 with CarryReturn to June 2007Replay Russia Crisis 1998Return to LT MedianReplay May and June 2013ForwardMarket Unchanged, 1y horizonLookingEurozone Continued UncertaintyEurozone Controlled BreakupChina 41,0681,424FX00000000000Credit Total Return-102-2,668 -158-1,146 -1413,244-17-3,921 0727-7-876 -11-1,129 0316-11203-211,047-741,350Note: This risk dashboard is for illustrative purposes only and reflects Western Asset's best efforts to identify and measure the major sources of risk in the portfolio. Results depicted are dependent on an underlying statistical modeland/or varying market conditions and are therefore subject to change without notice. There is no guarantee that ex-ante risk measures will be in line with their ex-post realizations.22
Appendix23
BiographiesAMIT CHOPRA18 Years Experience– Western Asset Management Company – Portfolio Manager, 2016– Pacific Investment Management Company – Senior Vice President, Portfolio Management, 2008-2016– Pacific Investment Management Company – Vice President, Supervisor Trade and Portfolio Analytics, 2001-2007– Blackrock Financial – Associate, 1998-2001– University of Southern California, B.S.– Chartered Financial AnalystFRANCES L. COOMBES18 Years Experience– Western Asset Management Company – Client Service Executive, 1998–– Columbia University, School of International and Public Affairs, M.P.P.– University of California, Berkeley, B.A.Western Asset experience reflects current position title and hire date.24
Long Duration Investment Outlook25
SummaryGlobal growth will remain slow and sustainable with US GDP potentially getting a near-termboost from Trump policiesGlobal Inflation will remain subduedCentral banks will continue aggressive accommodative policies but the FED may divergeTreasuries and sovereign bonds continue to be underpinned by global factors and low policyratesSpread sectors, especially the US consumer dependent, will continue to provide attractivereturns but valuations will be challenged if discount rates move higher26
New Considerations: President-Elect Trump’s policies and their potential impactFiscal Policy – Higher spendingStructural Policies – Tax and Regulation reliefTrade Policy – Greater protectionismMonetary Policy – More hawkishImmigration Policy – More restrictiveForeign Policy – Unclear and a potential risk27
Trump Has Proposed Looser Fiscal PolicyOutstanding questions: Will deficit concerns constrain size of fiscal easing? Will Senate Democrats backinfrastructure spending?US Federal Budget Deficit4CBO Forecast2Percent of 61986199620062016Source: Congressional Budget Office, Tax Policy Center. As of 15 Sep 16Note: The Tax Policy Center estimates the House Republican tax reform would increase the deficit by 1.3% in 2017 and 2% in 2018 and 2019. Estimates foradditional spending are less precise, but here assumed to be 500bn over coming five years.28
Tax Reform is Likely to Be Early FocusOutstanding questions: Which “loopholes” will be closed? How will foreign profits be treated? Will there be moresignificant changes to structure of corporate taxes (e.g. taxing imports, deductibility of interest payments)?Top Marginal Individual Tax Rate100Corporate Tax Rates in the OECDCorporate Income Tax Rate (%)807060PercentCurrent US Rate 35%31-359050403020House RepublicanProposal 33%1026-3021-25House RepublicanProposal 20%16-2011-15 1001910193019501970Source: Tax Policy Center. As of 31 Dec 1519902010051015Number of OECD CountriesSource: OECD. As of 30 Jun 162920
Trade PolicyTrump pledged to name China a currency manipulator and suggested he would renegotiate NAFTA. This could bevery disruptive to growth given the gross amount of US exports and imports of goods.US Goods Trade Balance1510Exports To:ChinaEuropeNAFTAPercent of GDP5Rest of World0Imports From:Goods Trade BalanceRest of ource: US Census Bureau. As of 30 Sep 16Note: This chart shows only the goods trade balance.The US runs a services trade surplus with the world of about 1.25% equal to approximately of GDP.The US current account deficit is approximately 2.5% of GDP: -3.75% goods deficit 1.25% of service surplus.3020152020
Monetary Policy Will Respond to Changes in the OutlookFollowing the change in the outlook for fiscal policy and growth, expectations for Fed hikes have moved closer to theFOMC’s own expectationsFOMC and Market Expectations for Rate HikesOIS - As of 02 Nov 16OIS - As of 28 Nov 163.0FOMC Dots Median2.5Percent2.01.51.00.50.020152016Source: Bloomberg, Federal Reserve. As of 28 Nov 16OIS Overnight indexed swap31201720182019Long Run
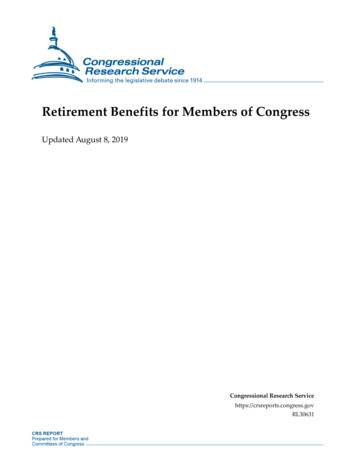
Inflation Expectations Suggest "Gradual" Approach to Rate HikesAlthough they have rebounded significantly following Trump’s election, inflation expectations remain lower than mid2014 levels10-Year Breakeven Inflation2.82.6Nov '16 FOMC Meeting:"Market-based measures ofinflation compensation havemoved up but remain low."2.4Percent2.22.01.8Jan '15 FOMC Meeting:"Market-based measures of inflationcompensation have declinedsubstantially in recent months."1.61.4Dec '15 FOMC Meeting:"Market-based measures ofinflation compensationremain low."1.21.0201020112012Source: Bloomberg, Federal Reserve. As of 28 Nov 163220132014201520162017
Alternative Trump Investment Themes – Markets leaning towards risk-on caseCase – Risk-off Protectionism (Mexico, China) Immigration (Mexico) Currency policy (China) Anti-globalization — Global recession?Case – Risk-on Cut taxes Increased infrastructure spending Reduced regulations Most pro-business president ever?33
Macro Outlook – Growth and InflationGlobal growth is slow but sustainable at about 3%. The US likely gets a boost but global structural impediments togrowth remain. Namely debt levels, demographics, reduced trade, productivity and a growing public sector. Astronger USD and higher rates in the US will also hold back growth.World GDP64504005Japan350Percent of GDP4Percent GrowthTotal Public and Private Debt to GDP by Region321300250UKEuro AreaUS200150100050-120012003200520072009Source: International Monetary Fund. As of 31 Dec 15Note: Reflects real GDP34201120132015000 01 02 03 04 05 06 07 08 09 10 11 12 13 14 15
Macro Outlook – Weak Global DemandGlobal demand remains weak with slowing nominal GDP and muted inflation in major economies.Nominal GDP Growth for Major Economies4-Qtr Avg. Growth, Nominal GDP.5US (left)43Eurozone (left)1221620141812161014Japan (left)126-11048260China (right)-34-4201120122013201420152016Source: Bureau of Economic Analysis, Bloomberg, Eurostat. As of 30 Sep ed80-23518PercentPercent224Percent6-21970 1975 1980 1985 1990 1995 2000 2005 2010 2015Source: Bloomberg. As of 30 Sep 16
Monetary Policy – The Fed Will Remain Very Cautious Due to Global InfluencesU.S. employment and inflation readings might argue for a rate hike but the weak global picture has forced the Fed toremain very cautious11Unemployment Rate: Actual and Forecast2.5Core PCE Inflation: Actual and ForecastPercent (Change Over 12-months)10Percent98762.01.51.00.550.042008 2009 2010 2011 2012 2013 2014 2015 2016Source: Federal Reserve, Bureau of Labor Statistics. As of 31 Oct 16362008 2009 2010 2011 2012 2013 2014 2015 2016Source: Federal Reserve, Census Bureau. As of 31 Oct 16
Monetary Policy – Fed is likely to hike in DecemberMarkets are pricing in two more hikes in 2017. But the Fed will look for signs from 1. Economic growth, 2. Realizedand expected inflation, and 3. Financial conditions.Long-Term Inflation ExpectationsUniversity ofNYTIPSMichigan (left)Fed (left)Breakevens 2.22.01.020122013201420152016Source: Bloomberg, New York Fed, Federal Reserve Board. As of 30 Nov 16New York Fed data as of 31 Oct 16Note: University of Michigan Survey refers to inflation expectations 5-10 yearsahead, NY Fed survey refers to expectations 3-5 years ahead, and TIPSbreakevens are 5-10 years aheadPercent2.5Index Level3.03.0Tighter1033.237Financial Conditions ource: Goldman Sachs, Bloomberg. As of 29 Nov 16Note: The Goldman Sachs financial conditions index is a weighted average ofinterest rates, credit spreads, equities and the US dollar, calibrated to the estimatedeffects of each on 1-year ahead US GDP growth
Investment Themes – Global Treasury Yields Pinned by Central Bank PoliciesCentral Bank
Highbury Pacific Capital Corp. International Paper Company John Lewis Partnership Pensions Trust Lennox International, Inc. LyonRoss Capital Management LLC Macy's, Inc. National Grid USA Nestle USA, Inc. Nisource, Inc. Orbital ATK PCS Administration (USA), Inc Pensioenfonds Horeca & Catering PPG Industries Southern California Edison Southern .