Transcription
No Board endorsement ofany person or entity 1Risks of PursuingPost-Secondary EducationPresented By: Wayne A. I. Frederick, M.D., MBA, PresidentFederal Reserve System1801 K Street NWTuesday, November 29, 2016
HOWARD UNIVERSITYNo Board endorsement ofGROWTHany person or entity 2 Legacy of Dr. Mordecai WyattJohnson, first African AmericanPresident Status of HU in 1926 Eight schools and colleges,none were fully accredited Enrollment: 1700 and budget, 700,000 Status of HU in 1950 Ten schools and colleges, allwere fully accredited Enrollment: 6000 students andbudget, 8M 20 new buildings Initiation of the Graduate School in1955 supported continued growth
No Board endorsement ofany personor entity 3HOWARD UNIVERSITYTODAY 13 Schools and Colleges 9 schools within Academic Affairs College of Arts & SciencesSchool of BusinessSchool of CommunicationsSchool of DivinitySchool of EducationCollege of Engineering, Architecture, and Computer SciencesGraduate SchoolSchool of LawSchool of Social Work 4 schools of the Health Sciences College of MedicineCollege of DentistryCollege of PharmacyCollege of Nursing & Allied Health Sciences6,000 employees including 1,000 faculty256 acre main campusOver 60M in annual sponsored researchNew 70 million Interdisciplinary Research Center opened in 2016Howard University Hospital - a comprehensive health care facility andLevel 1 Trauma CenterPublic television station (WHUT) and nonprofit commercial radio station(WHUR) – WHUR is one of the top 5 radio stations in the DMV marketTotal Enrollment: 10,002 students,Howard University Hospital: Owned by the UniversityFederal Appropriation
No Board endorsement ofany person or entity 4VISION STATEMENTHoward University’s core values of excellence, leadership, truth and serviceare the foundation of our mission and the source of our vision foradvancement. We are committed to academic excellence to develop scholarsand professionals who will drive change, and to make significant contributionsby creating solutions to contemporary global problems—particularly,disparities impacting the African diaspora.
No Board endorsement ofany person or entity 5POTENTIAL RISKS OFPOST-SECONDARY EDUCATION STUDENT FINANCIAL SERVICESTITLE IX COMPLIANCERETAINING COMPETITIVE FACULTYINFORMATION TECHNOLOGYFINANCESREAL ESTATE DEVELOPMENT & CAMPUS PLANNINGFUNDRAISINGTHE CRITICAL ROLE OF HBCUs
No Board endorsement ofany person or entity 6STUDENT FINANCIAL SERVICES
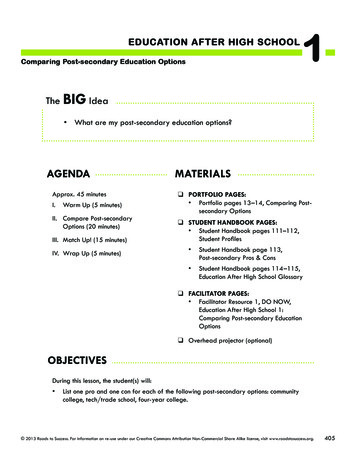
No Board endorsement ofMEDIAN FAMILY INCOMEanyBYperson or entity 7SELECTED CHARACTERISTICS The Census Bureau reported asharp increase in income forthe lowest 20% of familiesbetween 2014 and 2015 The share of all income goingto the 20% of families with thelowest incomes has steadilydeclined, from 4.8% in 1985 to4.4% in 1995, to 4.0% in 2005,and to 3.7% in 2015. Average published tuition andfees for in-state studentsattending public four-yearcolleges rose by 6,500 (in2015 dollars) over this 30-yearperiod — 55% of the increasein income ( 11,915) of themiddle 20% of families and9% of the increase in income( 76,041) of the 20% offamilies in the highest incomebracket. (Trends in CollegePricing 2016, online Table 2;calculations by the authors)RegionMidwest 73,535Northeast 80,482South 62,544West 72,399Race/EthnicityAsian Alone, Non-Hispanic 90,847Black Alone, Non-Hispanic 45,731Hispanic 47,328White Alone, Non-Hispanic 74,291Age15 to 24 37,759 56,77525 to 34 76,78035 to 44 85,74845 to 54 83,81355 to 54 57,36055 and overEducationLess Than High SchoolHigh SchoolS o m e CollegeAssociate 34,393 52,906 64,043 75,399Bachelor's or Higher 111,2702015 M e d i a n F a m i l y I n c o m e( M e d i a n of A l l F a m i l i e s 70,697)
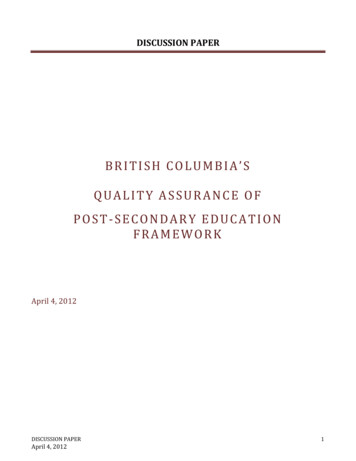
No Board endorsement ofany person or entity 8Percentage Change in Inflation-Adjusted Mean FamilyIncome by – Quintile, 1985 to 1995, 1995 to 2005, and 2005 to2015S e c o n d 20%Lowest 20%Third 20%Fourth 20%H i g h e s t 20%Top 5%Percentage Change42%24%16%5 % 6%7%9%3%6%1985 to 1995Lowest 2 0 %9%11%0%1995 to 2005-3%3%5% 5%3%2005 to 2015Fourth 2 0 % 4,755 11,915 23,5415%13%20%28%51%73%2015 Income Bracket 30,311or less 30,312to 55,376 55,377to 86,310 86,311to 133,525 133,526or higher 239,188or higher2015 Mean Income 17,367 42,700 70,500 225,279 386,829% Change 1995 to 2015 831 107,517Highest 2 0 %Top 5%Third 2 0 % Change 1985 to 2015Second 2 0 %18% 76.041 163,807
No Board endorsement ofNATIONAL DISCOUNTany person or entity 9RATES For academic year 2015-16, theaverage institutional discountrate—the percentage of totalgross tuition and fee revenueinstitutions give back tostudents as grant-basedfinancial aid—was anestimated 48.6 % for first-time,full-time freshmen and 42.5 %for all undergraduates The rate was up from47.1% the previous year.Discount rates also increasedwhen all undergraduates weremeasured, rising to 42.5% from41.3%
No Board endorsement ofany person or entity 10H O W A R D UNIVERSITYAcademic 1120122013Gross Tuition and Discount RateNet TuitionFinancial A i d G r o s s T u i t i o n D i s c o u n t Rate 05,583120,769110,638128,855131,995146,865 ,45040,33464,11771,17187,01985,882 1%31%31%30%30%31%29%29%25%37%36%40%37%
No Board endorsement ofany person or entity 11Figure 4. Average Annual Percentage Increases in Inflation-Adjusted Published Prices byDecade, 1986-87 to 2016-17Tuition and Fees and Room andBoardTuition and FeesPrivatePrivateNonprofit Public Four- Public Two- Nonprofit FourYearYearYear Public Four-YearFour-Year1986-87 to 1996-973.1%3.9%4.5%2.7%2.1%1996-97 to 2006-072.9%4.2%1.8%2.5%3.3%2006-07 to 2016-172.4%3.5%2.8%2.3%2.8%
No Boardandendorsement ofPublished Tuition and Fees, Institutional Discount,Net Tuition – Revenue at Public Institutions2011 or entity 12anyinpersonDollars, by Dependency Status and Family Income, 199900, 2003-04, 2007-08, and 2011-12 The net tuition revenues — thenet tuition paid to institutions —are higher than the total netprices students and familiesactually pay. Federal and stategrant aid and tax benefits, aswell as aid from employers andother private sources, helpstudents pay the net institutionprices Between 1999-00 and 2011-12,federal grant aid per full-timeequivalent undergraduatestudent more than doubled.Federal education tax creditsalso increased significantly overthese years. These federalsubsidies covered part of theincreases in institutional nettuition prices facing students inall postsecondary sectors.
No Board endorsement ofany person or entity 13TITLE IX COMPLIANCE
No Board endorsement ofany person or entity 14TITLE IX REPORTING ON COLLEGE CAMPUSESOne of the greatest challenges facing universities and colleges is reporting. Often, students do not feel safe to report Title IX violations They fear retaliation from the alleged respondent and those associatedwith the respondent. Most do not want a permanent record of the assault To students, a permanent record of the assault compromises future goals;particularly, law and medical students (both victims and respondents) Students feel that their privacy will be compromised and 'everyone willknow' they were victimized They fear that faculty, staff, and other students will treat them differentlybecause they reported For students who want to report, they often feel 'nothing will be done' ifthey do. To victims, removing the alleged respondent is the only indicationthat something is being done. If this does not happen, students are notpleased and feel further violated
No Board endorsement ofHOWARD UNIVERSITYany person or entity 15SOLUTIONS The Howard UniversityInterpersonal Violence PreventionProgram Office provides a safe,confidential, and private space forreporting The office is designated as aseparate space from compliance;thus, they can share anythingwithout feeling obligated to report The IVPP office also partners withother offices on campus, includingthe Office of Student Services andResidence Life, to provide studentswith academic and housingaccommodations that are separatefrom compliance Students feel, and they are correct,that the services received areseparate and not contingent uponreporting
No Board endorsement ofany person or entity 16HOWARD UNIVERSITYSOLUTIONS THE HU IVPP teaches victim/survivors about trauma andhow it can influence their process toward recovery The mandatory educational trainings teach faculty, staff,and students how to identify signs of domestic/datingviolence, stalking, and sexual assault despite the influenceof the rape culture lens; and how to supportvictims/survivors Aa training series is being developed to address rapeculture. This series will begin Spring 2017
No Board endorsement ofany person or entity 17RETAINING COMPETITIVE FACULTY
No Board endorsement ofFACULTY DEVELOPMENT OFFICEany person or entity 18Junior Faculty Writing & Creative Works SummerAcademy(May–October 2016)PARTICIPANTS Fifteen (15) Faculty Scholars (i.e., junior facultymembers). Participating Faculty Scholars were from :College of Arts and Sciences, the College of Engineeringand Architecture, the College of Medicine, the School ofCommunications, the School of Education, and the Schoolof Social Work. Seven (7) Scholar Coaches (i.e., senior facultymentors). Scholar Coaches as they were from the Collegeof Arts and Sciences, the College of Law, the School ofCommunications, and the School of Social Work Junior faculty members received coaching and advocacyfrom senior scholars and peersGOAL Production and submission of a manuscript for a peerreviewed publication or exhibition venue
No Board endorsement ofFACULTY DEVELOPMENT OFFICEany person or entity 19Junior Faculty Writing & Creative Works SummerAcademy(May–October 2016) BROADER OBJECTIVESHelp junior faculty members on their courseto earning tenureHelp influence their academic field of studyover their careers and to change the worldProvide participants with an opportunity towork collaboratively across disciplines and toexplore different approaches to advancingand evaluating scholarshipEncourage of development and adherenceto SMART goals to increase scholarlyproductivity. (A SMART approach requiressetting goals that are Specific, Measurable,Attainable, Relevant, and Time-bound)
No Board endorsement ofany person or entity 20FACULTY DEVELOPMENT OFFICECHAIR LEADERSHIP ACADEMY(August 2016 – May 2017)The Chair Leadership Academy October 2016 – Session on Work-Life Balance (1/2 day session) November 2016 – Working with the Dean: A Conversation December 2016 – Session on University Budgets (1/2 daysession)
No Board endorsement ofany person or entity 21FACULTY DEVELOPMENT OFFICESelected ActivitiesScholarly Production Workshop (October 2016-May 2017 but not December& April) “ Building Effective Writing Habits & Strategies” (October 2016) “ Producing a Publication out of your Teaching” (Working Title –November 2016)Junior Faculty Forum Series (September 2016-April 2017) “What Faculty Need to Know about Academic Advising at HowardUniversity” (September 2016) “Addressing Micro-aggressions & Bullying in the Workplace” (October2016) “Staying on Track: A Discussion with Recently Tenured and PromotedFaculty about their Tenure and Promotion Journey.” (November 2016) “Using the E-Portfolios as a part of Your Tenure or PromotionApplication” (December 2016) Awards Ceremony for graduates of HU-Teach (December 2016)
No Board endorsement ofany person or entity 22INFORMATION TECHNOLOGY
No Board endorsement ofany person or entity 23LEGAL AND REGULATORY FERPA, HIPAA/HITECH, PCI-DSS are just some of the keyregulatory compliance challenges Howard mustaddress. To do so, the Office of the CIO has a dedicatedInformation Security Officer (ISO) charged withgovernance, risk and compliance in regulatory matters In addition to being certified and up to date onregulatory requirements for IT, the ISO works closelyand collaboratively with the legal and regulatoryauthorities within the University, notably the GeneralCounsel, Compliance Officer and Risk Officer Information and compliance audits occur at least once ayear, new system and software designs are reviewed incontext and even institutional policies are givenconsideration for relevance and impact to regulatoryrequirements
No Board endorsement ofELECTRONICany person or entity 24DATA SECURITY ANDRECORDS MANAGEMENTData security begins and ends with the user. Howard has taken a holisticapproach to information security and notably data security. The three-prongedapproach involves end-user education and awareness, institutional policies andtechnology support The IT department routinely holds department level instructor ledtraining and orientation for data security. This same training is givenduring new-hire orientation Policies are promulgated to protect data with specific dataclassifications, provide access policies and designate appropriate use Technology enables the IT department to automatically scan for datavulnerabilities around PII, PCI-DSS and HIPAA using a cloud-basedapplication. Moreover, a new desktop image initiative ensuresconsistent, centrally managed images for all desktops and laptops thatinclude continuously updated software, whole disk encryption as wellas virus and malware prevention. Accompanying the new desktopimage is new policy software that enforces “least privilege” accesscontrol
No Board endorsement ofany person or entity 25SOCIAL NETWORKINGSocial Networking brings risk to the University, but also see opportunityto directly connect with the iGeneration as communication tool of choice. The IT Department works closely with General Counsel and Departmentof Public Safety when a policy violation or threat is detected. Howard iswilling to intercede and report in channels such as Google zerotolerance anti-bullying tools The University publishes policies to guide the faculty, staff and students,including Acceptable Use policy, Acceptable Email Policy Social Media search and review software (e.g. Hoot Suite and others) isbeing deployed as means to scan social media for key positive andnegative information in order to respond more timely to issues End user orientation to warn users of phishing and misrepresentedidentity threats, once phishing occurs technology to remove the threatfrom Emails and global communication to dissuade further impact
No Board endorsement ofany person or entity 26MOBILE DEVICESHoward University has on an average day 25,000 devices connected to itsnetwork. Whereas in years past we were concerned mostly with desktops, laptopsand designated learning areas, today a significant proportion of ourconnected user involves mobile devices Those ubiquitous mobile phones, PDA’s and tablets has increased theaverage per person device density to five or more. To accommodate thisrapid change in how IT is consumed, Howard is in the process of implementing more advanced NetworkAccess Controls (NAC) that quickly aid in identifying threats andvulnerabilities while managing levels of compliant connected equipment The next-generation NAC essentially classifies every device connected tothe HU network and protects the surrounding network based uponknown/unknown device, level of device compliance, level of threat. The NAC is able to dynamically isolate the network point to pointcommunications of any device as needed Device Rules (GPO) for connected mobile devices are able to enforcepasswords, encryption and lost/stolen device wipe
No Board endorsement ofany person or entity 27MALWARE PROTECTION The key to the malware risks is user education andawareness campaigns. In addition, Email and networktraffic is scanned for malware threats. Active monitoringand control of access to xx sites or content from withinnetwork Audit and ensure compliance of PII, PCI-DSS and HIPAAprivacy requirements in University systems in order toprovide a defense in layers by ensuring segregation andprotection of private data University is evaluating cloud-based simulated phishing, amethod of testing and educating the user community onhow to remain vigilante and defend against malware
No Board endorsement ofany person or entity 28DISASTER RECOVERY ANDBUSINESS CONTINUITYHoward University recently embarked upon disaster recovery(DR) and business continuity planning (BCP) for the ITorganization under national and international standards. Once the foundation has been established, the IT businessanalyst and project management office can guide other businessunits in their individual business continuity plans. Eachdepartmental BCP will include a disaster recovery component. One technology that enables a holistic BCP is the use of cloudbased applications and technology to ensure more resilience forthe applications and to provide “anywhere” access to faculty,staff and students in the event the campus should beinaccessible The IT department holds disaster recovery exercises monthly asa means of continuous improvement
No Board endorsement ofany person or entity 29IDENTITY AND ACCESSMANAGEMENTThe University IT team has least privilege policies in place to ensureusers only have as much access as required for role. Semi-annual audits perform access review and confirm onboardingand termination processes correctly manage user access For users needing elevated privileges, that is managed with specificelevated privilege management accounts that are separate from theuser account and can be monitored and audited for appropriate use The elevated privilege accounts are constrained to appropriate scopeby the University Active Directory In 2017, Howard will implement two-factor authentication as bestpractice to thwart misappropriation of user identity and furtherprotect against compromised account credentials from malware orphishing
No Board endorsement ofany person or entity 30I.T. WORKFORCECurrent market environment in Higher Education continues to putpressure on cost savings in IT, forcing leaner IT staff and makingcompensation hostile to competitive market rates. The risk is reduced staff or less capable staff. There are multiple meansof reducing this risk and Howard University has investigated each forappropriate fit Solutions include moving applications to the cloud or delivered asSoftware as a Service (SaaS) to reduce on premise reliance ontechnology and resources Also under consideration is 3rd party managed services as a way toremain properly staffed with appropriate competencies under aconsistent year-on-year expense schedule
No Board endorsement ofany person or entity 31FINANCES
No Board endorsement ofperson- FY16or entity 32anyHUH)CONSOLIDATED (UNIVERSITY ANDFINAL RESULTS COMPARED TO THE PRIOR 3 FISCAL YEARS After two challenging years, Howard in FY16 has completed thefirst phase of a planned multi-year turnaround intended to producesustainable financial stability and create investment capital toaddress urgent HU priorities 2016 Total Revenues and Reclassifications 783,076 M (as of Nov 2016) Total Operating Expenses- 771,456 M Operating Revenues over (under) Operating Expenses - 11,620 M
No Board endorsement ofanyHUH)person -orFY16entity 33CONSOLIDATED (UNIVERSITY ANDPRELIMINARY RESULTS COMPARED TO THE PRIOR 3FISCAL YEARSConsolidatedHOWARD UNIVERSITYFY2013FinalFY2014Final16 Comp to 15FY2015FinalFY2016PreliminaryFY16 Compto FY15 FY16 Compto FY15%TUITION & FEESless: Financial Aid & RemissionTUITION & FEES (net of Fin Aid) 248,122( 82,518) 165,604 257,645( 92,923) 164,722 264,307( 110,239) 154,068 257,269( 97,435) 159,834( 7,038) 12,804 5,766-3%-12%4%FEDERAL APPROPRIATION 233,691 222,751 212,035 221,821 9,7865%PATIENT SERVICE REVENUE 275,441 245,756 258,766 258,604( 162)0%ALL OTHER 172,319 170,891 162,079 147,627( 14,452)-9%OPERATING REVENUES 847,055 804,120 786,948 787,886 9380%SALARIES, WAGES, AND BENEFITSOTHER OPERATING EXPENSESOPERATING EXPENSES 472,832 279,261 752,093 475,054 286,085 761,139 455,904 300,557 756,461 415,974 282,892 698,866( 39,930)( 17,665)( 57,595)-9%-6%-8%OP. REVENUES less OP. EXPENSES (EBIDA) 94,962 42,981 30,487 89,020 58,533192%Interest / Depreciation / AmortizationOP. RESULTS after Int., Deprec., Amort.( 85,448) 9,514( 87,597)( 44,616)( 85,687)( 55,200)( 79,624) 9,396( 8,781) 64,59611%-117%
UNIVERSITY ONLYNo Board endorsement ofany person or entity 34FY16 PRELIMINARY RESULTSCOMPARED TO THE PRIOR THREE FISCALYEARSUniversityHOWARD UNIVERSITYFY2013FinalFY2014Final16 Comp to 15FY2015FinalFY16PreliminaryFY16 Compto FY15 FY16 Compto FY15%TUITION & FEESless: Financial Aid & RemissionTUITION & FEES (net of Fin Aid) 248,122( 82,518) 165,604 257,645( 92,923) 164,722 264,307( 107,997) 156,310 257,269( 95,193) 162,076( 7,038) 12,804 5,766-3%-12%4%FEDERAL APPROPRIATION 205,212 196,051 186,014 194,775 8,7615%PATIENT SERVICE REVENUE 34,305 36,004 27,851 28,606 7553%ALL OTHER 158,868 162,248 153,982 136,729( 17,253)-11%OPERATING REVENUES 563,989 559,025 524,157 522,186( 1,971)0%SALARIES, WAGES, AND BENEFITSOTHER OPERATING EXPENSESOPERATING EXPENSES 290,827 179,449 470,276 292,878 190,248 483,126 292,139 207,363 499,502 275,427 200,841 476,268( 16,712)( 6,522)( 23,234)-6%-3%-5%OP. REVENUES less OP. EXPENSES (EBIDA) 93,713 75,899 24,655 45,918 21,26386%Interest / Depreciation / AmortizationOP. RESULTS after Int., Deprec., Amort.( 61,458) 32,255( 62,333) 13,566( 60,681)( 36,026)( 58,372)( 12,454) 2,309 23,572-4%-65%( 36,026) 18,900 6,446 42,472-118%add: Net Real Estate Development ProceedsOP. RESULTS plus Real Estate 32,255 13,566
No Board endorsement ofENDHOWARD UNIVERSITY YEARanyperson or entity 35FINANCIAL RESULTS FY2008 - FY2016 20,000Amounts in Thousands 10,000 0( 10,000)( 20,000)( 30,000)( 40,000)( 50,000)( 60,000)2008 2009 2010 2011 2012 2013 2014 2015 2016Includes Howard University Hospital
No Board endorsement ofany person or entity 36UNIVERSITY OPERATING REVENUES FY2015-16Tuition and fees,net of fin aid andtuition remission 157 , 30%Other income 8 , 1%Contributions 11 , 2%Endowmentincome 14 , 3%Auxiliary services 15 , 3%Patient revenueGrants and contracts 56 , 11%Room & board 38 , 7%Total: 523MFederalappropriation 195 , 37%
No Board endorsement ofFY2015-16UNIVERSITY OPERATING EXPENSESor entity 37any personMedical and officesupplies 9 , 2%Provision for baddebt, 9 , 2%Repairs andmaintenance 12 , 2%Food service costs 13 , 2%Depreciation andamortization 38 ,7%Salaries and wages 226 , 42%Total: 538MUtilities andtelecomm 21 , 4%Grant subcontracts 17 , 3%Insurance and riskmanagement 21 ,4%Interest expenseProfessional and 21 , 4%administrativeservices, 100 , 19%Employee benefits 49 , 9%
No Board endorsement ofany person or entity 38FUNDRAISING
No Board endorsement ofCOMPARATIVE ANALYSIS: any person or entity 39FUNDRAISING REVENUE / EXPENSESRevenueExpensesExpenses as % ofRevenueUniversity of Notre Dame 389,802,058 38,963,07210%Duke University 478,295,705 59,391,95812% 246,714,379 33,000,00013%Howard 11,587,957 1,587,29014%University of Georgia 144,000,000 20,500,00014%Spelman College 19,518,668 3,100,00016%Saint Louis University 40,000,000 8,192,88720%Temple University 75,200,000 15,900,00021%Northeastern University 81,000,000 19,000,00023% 121,909,366 28,841,50924%InstitutionWashington University in St. LouisComments:Vanderbilt University VSE average 10.7%National average of non-profit institutions 20%*OFFICE OF THE PRESIDENT*National Average Source: Greenfield, James. “Accountabilityand Budgeting, Assessing Costs, Results and Outcomes.” InHank Rosso, Achieving Excellence in Fundraising, New York:Wiley, 2003.
No Board endorsement ofany person or entity 40COMPARATIVE ANALYSIS:ENDOWMENT 8.784B 6.889B 6.472B 4.438B 1.093BUniversity ofNotre DameWashingtonUniversity inSt. LouisDukeUniversityVanderbiltUniversitySaint LouisUniversity 1.004BUniversity ofGeorgia 729M 651MNortheastern CASE AverageUniversity 591M 493.5MHowardUniversityTempleUniversity 362.9MSpelmanCollege
No Board endorsement ofany person or entity 41COMPARATIVE ANALYSIS: CAMPAIGN ACTIVITYInstitutions currently engaged in a campaign:DatesGoalAmountRaisedRaised from 1M (#Gifts)Duke University7/1/20106/30/2017 3.25BNot disclosedNot disclosedWashington Universityin St. Louis3/1/20096/30/2018 2.5B 2.24BNot disclosedUniversity of Georgia7/1/20126/30/2020 1B 588.76M 240.81M (91) 625M 510M 275M (85)Student support, Faculty support, Research 500M 86.92M 14.86M (5)Scholarship Health & Medicine BusinessAthleticsTBD--InstitutionNortheastern UniversitySaint Louis UniversityTemple 2016OFFICE OF THE PRESIDENTCampaign Funding PrioritiesComprehensiveOutstanding Faculty; Talented & DiverseStudent Body; Scholarly Research & CreativePotential; Teaching, Research, & LivingEnvironments; Unrestricted Annual SupportEnhancing the Student Experience; Investing inFaculty Support and Research Serving theCitizens of Georgia and Beyond ImprovingCampus Infrastructure and SustainabilityProviding Unrestricted Supp-
No Board endorsement ofany person or entity 42COMPARATIVE ANALYSIS: CAMPAIGN ACTIVITYMost recent campaign:InstitutionVanderbilt UniversityDatesGoal7/1/19996/30/2011 1.75BUniversity of NotreDame7/1/20046/30-20111/1/1998Saint Louis University*6/30/20117/1/2002Temple University12/31/20091/1/2002Howard University12/31/2007Spelman College7/1/20046/30/2014AmountRaisedRaised from 1M (#Gifts)Campaign Funding PrioritiesStudent Scholarships and Financial Aid,Faculty Chairs, Facilities and Technology,Programs and Research, UnrestrictedAmount not disclosed Undergraduate financial aid, graduate 2.014B(305)fellowships, Academy, capital projectsScholarship Health & Medicine Capital 466.28M 98.47M (51)Projects 1.939B 826.42M (216) 350M 384M 139.53M (62)Various 250M 102.5MCash 4,481,263 (4)Capital projects 150M 157.8M 27.82M (13)Scholarships, Unrestricted Fund, CapitalProjects, Endowment (Scholarships &Faculty Resources) 1.5B 400M*Currently engaged in campaign effort as detailed on previous slide.OFFICE OF THE PRESIDENT
No Board endorsement ofCOMPARATIVE ANALYSIS:any person or entity 43DONOR POOLAlumniParticipation*Number ofAlumni*Spelman College37.87%17,9986,8158,30734,460University of Notre Dame35.51%129,75146,081108,555585,441Duke University28.00%149,05741,732Did not discloseDid not discloseWashington University inSt. Louis25.03%113,15228,32561,550398,775Vanderbilt ty of n University9.37%205,71019,27326,672700,000 Howard University7.53%75,9685,71711,982190,000Saint Louis University6.91%137,4139,49414,735288,971Temple onCASE Average CampaignCASE Average AnnualNumber of AlumniNumber of DonorsDonors*Database Size15% duringcampaign8.6% ordinaryAnnual Support*As reported in VSE, 2015 (includes all alumni).
No Board endorsement ofHU ALUMNI FUNDRAISINGany person or entity 44PERFORMANCEA L U M N I PARTICIPATION RATEL A S T 10 F I S C A L Y E A R SUndergraduate Alumni Participation 4.96%FY 2 0 0 7 FY 2 0 0 8 FY 2 0 0 9 FY 2 0 1 0 FY 2 0 1 1 FY 2 0 1 2 FY 2 0 1 3 FY 2 0 1 4 FY 2 0 1 5 FY 2 0 1 6
No Board endorsement ofany person or entity 45HU FUNDRAISING PERFORMANCEFY 2012-2016PAYMENTS ON S A M E FY C O M M I T T M E N T SO U T R I G H T GIFTSPAYMENTS O N PREVIOUS C O M M I T M E N T SO U T S T A N D I N G EXPECTANCIES PLEDGES 819,317 2,154,578FY 2016 10,983,705 719,097 347,411 2,444,645FY 2015 8,795,902 1,246,690FY 2014 693,911 277,157 7 530,569 1,610,910FY 2013FY 2012 245,758 385,217 7,347,274 7,631,420 623,283 362,884 4,747,989 8,374,503
No Board endorsement ofany person or entity 46HU FUNDRAISING PERFORMANCEFY 1991-FY 2016 12,000,000 10,000,000 8,000,000 6,000,000 4,000,000 2,000,000 1991 1992 1993 1994 1995 1996 1997 1998 1999 2000 2001 2002 2003 2004 2005 2006 2007 2008 2009 2010 2011 2012 2013 2014 2015 2016Outright GiftsOFFICE OF THE PRESIDENTBequest & Pledge Payments
No Board endorsement ofany person or entity 47OFFICE OF THE PRESIDENT
No Board endorsement ofany person or entity 48HISTORICALLY BLACK COLLEGES ANDUNIVERSITIES (HBCUS)
No Board endorsement ofany person or entity 49CRITICAL ROLE OF HBCUS 312,000 students attend HBCUs Of this population 79% are African American HBCUs represent 4 % of all four-year institutions HBCUs produce 21% of bachelor’s degrees awarded toAfrican AmericansSource: National Center for Education StatisticsOFFICE OF THE PRESIDENT
No Board endorsement ofany person or entity 50HBCUS PRODUCE 28% OF AFRICANAMERICANS IN THE STEM FIELDS* 34% of African Americans who receivedbachelor’s degrees in physics, chemistry,astronomy, mathematics and biology earnedthem from HBCUs* Of the top 10 colleges whose African Americangraduates went on to get PhDs in science andengineering, the top eight were HBCUs***National Center for Education Statistics**National Science FoundationOFFICE OF THE PRESIDENT
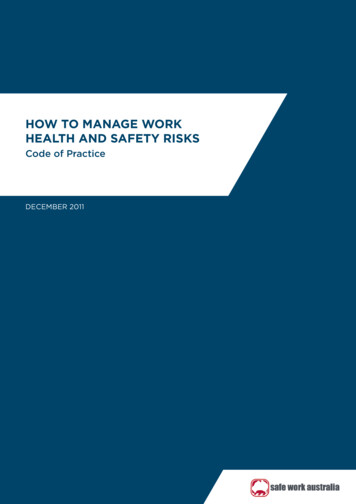
No Board endorsement ofTOP 50 U.S. BACCALAUREATE-ORIGIN INSTITUTIONS OFany person or entity 512002–11 BLACK SCIENCE AND ENGINEERINGDOCTORATE RECIPIENTS1. Howard University 2202. Spelman College 1753. Florida A & M University 1544. Hampton University 1505. Xavier University of LA 1266. Morehouse College 1067. Morgan State U. 1027. NC A&T State U. 1029. Southern U. 10010. Tuskegee U. 8010 . U. Maryland, Baltimore County 8012. U. Maryland, College Park 7613. U. Michigan, Ann Arbor 7314. U. Virginia, 7215 . Harvard U. 7116. Jackson State U. 6917. U. California, Berkeley 6418. U. Illinois, Urbana-Champaign 6218 .U. North Carolina, Chapel Hill 6220. Tennessee State U. 6121. Yale U. 6022. Brown U. 5522
HOWARD UNIVERSITY TODAY 13 Schools and Colleges 9 schools within Academic Affairs College of Arts & Sciences School of Business School of Communications School of Divinity School of Education College of Engineering, Architecture, and Computer Sciences Graduate School School of Law School of Social Work 4 schools of the Health Sciences