Transcription
ArticlesMortality risk attributable to wildfire-related PM2·5 pollution:a global time series study in 749 locationsGongbo Chen, Yuming Guo, Xu Yue, Shilu Tong, Antonio Gasparrini, Michelle L Bell, Ben Armstrong, Joel Schwartz, Jouni J K Jaakkola,Antonella Zanobetti, Eric Lavigne, Paulo Hilario Nascimento Saldiva, Haidong Kan, Dominic Royé, Ai Milojevic, Ala Overcenco, Aleš Urban,Alexandra Schneider, Alireza Entezari, Ana Maria Vicedo-Cabrera, Ariana Zeka, Aurelio Tobias, Baltazar Nunes, Barrak Alahmad, Bertil Forsberg,Shih-Chun Pan, Carmen Íñiguez, Caroline Ameling, César De la Cruz Valencia, Christofer Åström, Danny Houthuijs, Do Van Dung,Evangelia Samoli, Fatemeh Mayvaneh, Francesco Sera, Gabriel Carrasco-Escobar, Yadong Lei, Hans Orru, Ho Kim, Iulian-Horia Holobaca,Jan Kyselý, João Paulo Teixeira, Joana Madureira, Klea Katsouyanni, Magali Hurtado-Díaz, Marek Maasikmets, Martina S Ragettli,Masahiro Hashizume, Massimo Stafoggia, Mathilde Pascal, Matteo Scortichini, Micheline de Sousa Zanotti Stagliorio Coêlho,Nicolás Valdés Ortega, Niilo R I Ryti, Noah Scovronick, Patricia Matus, Patrick Goodman, Rebecca M Garland, Rosana Abrutzky,Samuel Osorio Garcia, Shilpa Rao, Simona Fratianni, Tran Ngoc Dang, Valentina Colistro, Veronika Huber, Whanhee Lee, Xerxes Seposo,Yasushi Honda, Yue Leon Guo, Tingting Ye, Wenhua Yu, Michael J Abramson, Jonathan M Samet, Shanshan LiSummaryBackground Many regions of the world are now facing more frequent and unprecedentedly large wildfires. However,the association between wildfire-related PM2·5 and mortality has not been well characterised. We aimed tocomprehensively assess the association between short-term exposure to wildfire-related PM2·5 and mortality acrossvarious regions of the world.Methods For this time series study, data on daily counts of deaths for all causes, cardiovascular causes, and respiratorycauses were collected from 749 cities in 43 countries and regions during 2000–16. Daily concentrations of wildfirerelated PM2·5 were estimated using the three-dimensional chemical transport model GEOS-Chem at a0·25 0·25 resolution. The association between wildfire-related PM2·5 exposure and mortality was examined using aquasi-Poisson time series model in each city considering both the current-day and lag effects, and the effect estimateswere then pooled using a random-effects meta-analysis. Based on these pooled effect estimates, the populationattributable fraction and relative risk (RR) of annual mortality due to acute wildfire-related PM2·5 exposure wascalculated.Findings 65·6 million all-cause deaths, 15·1 million cardiovascular deaths, and 6·8 million respiratory deaths wereincluded in our analyses. The pooled RRs of mortality associated with each 10 µg/m³ increase in the 3-day movingaverage (lag 0–2 days) of wildfire-related PM2·5 exposure were 1·019 (95% CI 1·016–1·022) for all-cause mortality,1·017 (1·012–1·021) for cardiovascular mortality, and 1·019 (1·013–1·025) for respiratory mortality. Overall, 0·62%(95% CI 0·48–0·75) of all-cause deaths, 0·55% (0·43–0·67) of cardiovascular deaths, and 0·64% (0·50–0·78) ofrespiratory deaths were annually attributable to the acute impacts of wildfire-related PM2·5 exposure during the studyperiod.Interpretation Short-term exposure to wildfire-related PM2·5 was associated with increased risk of mortality. Urgent actionis needed to reduce health risks from the increasing wildfires.Funding Australian Research Council, Australian National Health & Medical Research Council.Copyright 2021 The Author(s). Published by Elsevier Ltd. This is an Open Access article under the CC BY-NC-ND4.0 license.IntroductionRecently, large and unprecedented wildfires have beenoccurring frequently across the world. During the past3 years, wildfires have been observed in many locationsof the world, including Australia, British Columbia inCanada, the western USA, and the Amazon rainforest.1For example, since the start of 2019, wildfires in Californiahave burned more than 3 million acres, resulting inthousands of destroyed homes and businesses.2 Thewildfires in Australia have affected every state anddestroyed more than 2000 homes and burned millions ofwww.thelancet.com/planetary-health Vol 5 September 2021acres.3 Wildfires have both direct and indirect effects onhealth with potentially lasting consequences. Beyonddirect injury, mental health can be harmed by the risksfires pose and loss of possessions and housing. Thepollution from wildfire smoke can spread as far as1000 km away and risk of wildfires is projected to keepincreasing as climate change worsens.1Wildfire smoke is a complex mixture of particulatematter (PM) and gaseous pollutants.4 Among the variousair pollutants emitted by wildfires, fine particulate matter(PM2·5) is of great concern, as particles in this size rangeLancet Planet Health 2021;5: e579–87Guangdong ProvincialEngineering TechnologyResearch Center ofEnvironmental and Health RiskAssessment, Department ofOccupational andEnvironmental Health, Schoolof Public Health, Sun Yat-senUniversity, Guangzhou,Guangdong, China(G Chen PhD); Department ofEpidemiology and PreventiveMedicine, School of PublicHealth and PreventiveMedicine, Monash University,Melbourne, VIC, Australia(Prof Y Guo PhD, T Ye MSc,W Yu MPH,Prof M J Abramson PhD,S Li PhD); Jiangsu KeyLaboratory of AtmosphericEnvironment Monitoring andPollution Control, CollaborativeInnovation Center ofAtmospheric Environment andEquipment Technology, Schoolof Environmental Science andEngineering, NanjingUniversity of InformationScience & Technology, Nanjing,China (Prof X Yue PhD);Shanghai Children’s MedicalCenter, Shanghai Jiao-TongUniversity School of Medicine,Shanghai, China(Prof S Tong PhD); School ofPublic Health, Institute ofEnvironment and HumanHealth, Anhui MedicalUniversity, Hefei, China(Prof S Tong); Center for GlobalHealth, School of Public Health,Nanjing Medical University,Nanjing, China (Prof S Tong);School of Public Health andSocial Work, QueenslandUniversity of Technology,Brisbane, QLD, Australia(Prof S Tong); Department ofe579
ArticlesPublic Health Environmentsand Society(Prof A Gasparrini PhD,Prof B Armstrong PhD,A Milojevic PhD, F Sera PhD),Centre for StatisticalMethodology(Prof A Gasparrini), and Centreon Climate Change & PlanetaryHealth (Prof A Gasparrini),London School of Hygiene &Tropical Medicine, London, UK;School of Environment,Yale University, New Haven,CT, USA (Prof M L Bell PhD,W Lee PhD); Department ofEnvironmental Health, HarvardT H Chan School of PublicHealth, Harvard University,Boston, MA, USA(Prof J Schwartz PhD,A Zanobetti PhD,B Alahmad PhD); Center forEnvironmental and RespiratoryHealth Research, University ofOulu, Oulu, Finland(Prof J J K Jaakkola PhD,N R I Ryti PhD); School ofEpidemiology & Public Health,Faculty of Medicine, Universityof Ottawa, Ottawa, ON, Canada(Prof E Lavigne PhD); Air HealthScience Division, HealthCanada, Ottawa, ON, Canada(Prof E Lavigne); Department ofPathology, Faculty of Medicine,University of São Paulo,São Paulo, Brazil(Prof P H NascimentoSaldiva PhD, M de Sousa ZanottiStagliorio Coêlho PhD);Department of EnvironmentalHealth, School of Public Health,Fudan University, Shanghai,China (Prof H Kan PhD);Department of Geography,University of Santiago deCompostela, CIBER ofEpidemiology and PublicHealth (CIBERESP), Spain(D Royé PhD); National Agencyfor Public Health of theMinistry of Health, Chisinau,Moldova (A Overcenco PhD);Institute of AtmosphericPhysics, Czech Academy ofSciences, Prague,Czech Republic (A Urban PhD,J Kyselý PhD); Faculty ofEnvironmental Sciences, CzechUniversity of Life Sciences,Prague, Czech Republic(A Urban, J Kyselý); Institute ofEpidemiology, HelmholtzZentrum München–GermanResearch Center forEnvironmental Health,Neuherberg, Germany(A Schneider PhD); Faculty ofGeography and EnvironmentalSciences, Hakim Sabzevarie580Research in contextEvidence before this studyMany regions of the world are now facing more frequent andunprecedentedly large wildfires. Wildfire-related air pollutionhas become a major public health concern, as it can travel widelyand cause various adverse health effects. Previous studies havefound wildfire-related air pollution to be significantly associatedwith increased mortality risk. We searched PubMed, Web ofScience, Google Scholar, and China National KnowledgeInfrastructure using the terms “wildfire”, “bushfire”, “fineparticulate matter”, “fine particles”, “PM2·5”, “death”, and“mortality” in English and Chinese for studies published up toDec 25, 2020. We identified several studies exploring the impactof wildfire-related PM2·5 on mortality. These studies showed thatwildfire-related PM2·5 had adverse effects on all-cause,cardiovascular, and respiratory mortality. However, the existingevidence comes from single-city or single-region studies,and not from studies with global reach.Added value of this studyTo the best of our knowledge, this is the largest studyevaluating associations between acute wildfire-related PM2·5enter into the lungs and reach the alveoli where the smallparticles can translocate through the alveolar epitheliumand enter the circulation.5,6 Compared with PM2·5 fromurban sources, wildfire-related PM2·5 tends to be moretoxic due to its chemical composition and smaller particlesize, and is often accompanied by co-exposure to otherharmful environmental factors, particularly high tem peratures.1By contrast with numerous studies on total or urbanbackground PM2·5, far fewer studies have focused onhealth effects of wildfire-related PM2·5 specifically,although some previous studies do suggest harm topublic health.7,8 Wildfire-related PM2·5 exposure has beenfound to be associated with adverse health outcomes,such as premature mortality, asthma, and reduced lungfunction.9–12 Studies examining the health effects ofwildfire smoke in the USA, Canada, Australia, andEurope have found adverse health effects.9,13–15 However,existing evidence mainly comes from single-city orsingle-region studies, and not from global studies.One study estimated that 339 000 deaths could have beenattributable to global landscape fire smoke annuallyduring 1997–2006,16 but updated evidence from globalscale studies has not been subsequently reported.In this study, associations between daily exposure towildfire-related PM2·5 and mortality were evaluated usingthe Multi-City Multi-Country (MCC) Collaborativedataset for 749 cities from 43 countries and regions.MethodsMortality and socioenvironmental dataMortality data in this study were obtained from theMCC Collaborative Research Network, an internationaland mortality, and the first to do so comprehensively acrossvarious regions of the world, using daily death count databetween 2000 and 2016 from 749 cities in 43 countries andregions. We found that the pooled relative risks of mortalityassociated with a 10 µg/m³ increase in the 3-day movingaverage of wildfire-related PM2·5 concentrations were 1·019(95% CI 1·016–1·022) for all-cause mortality, 1·017(1·012–1·021) for cardiovascular mortality, and 1·019(1·013–1·025) for respiratory mortality. Overall, 0·62% (95% CI0·48–0·75) of all-cause deaths, 0·55% (0·43–0·67) ofcardiovascular deaths, and 0·64% (0·50–0·78) of respiratorydeaths were attributable to the acute impacts of wildfire-relatedPM2·5 exposure during the study period.Implications of all the available evidenceThis study provides robust epidemiological evidence of theacute effects from wildfire-related PM2·5 exposure on mortality,based on a large multicountry dataset and standard statisticalmethod. Policy makers and public health professionals shouldraise awareness of wildfire pollution to prompt public responsesand take actions to avoid exposure.collaboration of research teams established to performepidemiological studies on associations between environ mental stressors and health.17,18 The current MCC Networkcovers 750 cities from 43 countries and regions(appendix pp 6–7). Daily counts of all-cause deaths werecollected from relevant authorities of each country orregion. Mortality data for non-external causes (InternationalClassification of Diseases [ICD] 9th Revision codes 0–799or 10th Revision [ICD-10] codes A0–R99) were alternativelycollected if all-cause mortality data were unavailable. Inaddition, mortality counts were collected specifically forcardiovascular (ICD-10 codes I00–I99) and respiratory(ICD-10 codes J00–J99) causes. Mortality data for all causesor non-external causes were available for 749 cities duringthe study period, while cardiovascular mortality data wereavailable for 629 cities in 28 countries and respiratorymortality data for 647 cities in 29 countries. Other locationspecific information was also collected: meteorologicalparameters (daily mean temperature and relative humidity)and gross domestic product (GDP) per capita.Estimation of wildfire-related PM2·5From our previous work on global fire air pollution,19 dailyconcentrations of wildfire-related PM2·5 from Jan 1, 2000,to Dec 31, 2016, were estimated at a 0·25 0·25 resolution.Briefly, the three-dimensional chemical transport modelGEOS-Chem (version 12.0.0) was used to estimate globalfire-induced perturbations in PM2·5. A biomass burninginventory was adopted from the Global Fire EmissionsDatabase (GFED; version 4.1), which estimated emissionsbased on satellite retrieval of burn area and active fireinformation. The GFED detected fires from five sources,including agricultural waste burning; boreal forest fires;www.thelancet.com/planetary-health Vol 5 September 2021
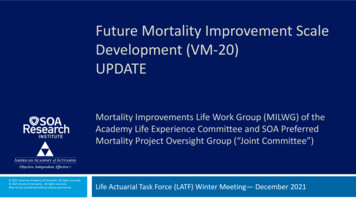
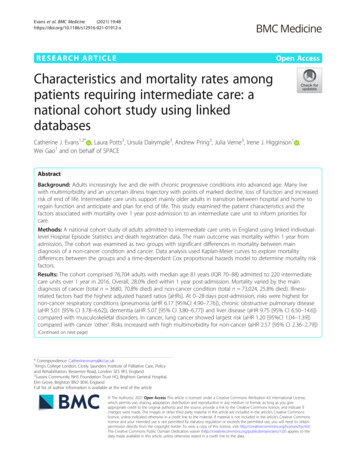
ArticlesMaximum dailywildfire-related PM2.5 (μg/m3) 1010 to 3030 to 5050 to 100100 to 200200 to 300Figure 1: Maximum levels of estimated daily wildfire-related PM2·5 in study locations during 2000–16tropical forest fires; savanna, grassland, and shrublandfires; and temperate forest fires.20Daily enhancements of PM2·5 concentrations by firesduring the study period were estimated as the differencesbetween simulations with and without fire emissions.Daily concentration of wildfire-related PM2·5 was firstestimated globally using GEOS-Chem at a spatialresolution of 2·0 2·5 , and then was adjusted anddownscaled at a spatial resolution of 0·25 0·25 usingground-level measurements of PM2·5 and otherpredictors (eg, temperature, precipitation, wind speed,and day of the week). As wildfire-related PM2·5 was notroutinely monitored, the GEOS-Chem-derived estimatesof all-source PM2·5 were compared with ground-levelmeasurements and their differences were further usedto adjust the GEOS-Chem-derived wildfire-related PM2·5.Results of a ten-fold cross-validation method showedthat the adjusted all-source daily PM2·5 concentrationsderived from GEOS-Chem explained 86·5% of thevariability of ground-level measurements. Details ofmodel validation, adjustment, and downscaling areshown in the appendix (pp 3–5). Based on the raster dataon estimation of global wildfire-related PM2·5 at a spatialresolution of 0·25 0·25 (roughly 28 km² at theequator), the concentration of the pollutant in each cityon each day was assigned as the average of all the cellvalues that fell at least partly in each city.Statistical analysisTo examine the association between exposure to dailywildfire-related PM2·5 and mortality, a two-stage analyticalapproach was adopted.21,22 In the first stage, a quasi-Poissonregression was employed to examine the city-specificwww.thelancet.com/planetary-health Vol 5 September 2021association between daily concentration of wildfire-relatedPM2·5 and death counts. Based on our previous work,23,24the single-day effect of wildfire-related PM2·5 exposure onmortality on the current day and its lagged effects up to7 days (from lag 0 to lag 7 days) were considered in cityspecific models. Moving average lag models (eg, lag 0–1and lag 0–2) were also implemented to examine cumulativeeffects of wildfire-related PM2·5 exposure.25 The seasonalityand long-term trends were controlled using a natural cubicspline of time with 7 degrees of freedom per year.21 Themoving averages of temperature (for all cities) and relativehumidity (applied to 556 out of 749 cities with availablehumidity data) during lag 0–7 days were controlled usingnatural cubic splines with 4 degrees of freedom.26Additionally, categorical variables for day of the week wereincluded in the model.In the second stage, the effect estimates from thecity-specific models were pooled to derive overall effectestimates at the global and national levels using arandom-effects meta-analysis.27 The pooled PM2·5–mortality association was shown as relative risk (RR) ofdeath associated with a 10 µg/m³ increase in wildfirerelated PM2·5. The heterogeneity of effect estimatedacross cities was tested using the Cochran Q test andI² statistic.28 To check for non-linear associations, themoving average of wildfire-related PM2·5 was fitted usinga B-spline function and two knots placed at the 25th and75th percentiles of mean PM2·5 concentration across allcities.18 Then concentration–response relationshipsbetween wildfire-related PM2·5 exposure and mortalitywere pooled at the global level.Our initial analyses showed moderate heterogeneity ineffect estimates across cities for all-cause mortalityUniversity, Sabzevar, KhorasanRazavi, Iran (A Entezari PhD,F Mayvaneh PhD); Institute ofSocial and Preventive Medicineand Oeschger Center forClimate Change Research,University of Bern, Bern,Switzerland(A M Vicedo-Cabrera PhD);Institute of Environment,Health and Societies, BrunelUniversity London, London, UK(A Zeka MSc); Institute ofEnvironmental Assessmentand Water Research (IDAEA),Spanish Council for ScientificResearch (CSIC), Barcelona,Spain (A Tobias PhD); School ofTropical Medicine and GlobalHealth, Nagasaki University,Nagasaki, Japan (A Tobias,X Seposo PhD); Department ofEpidemiology, InstitutoNacional de SaúdeDr Ricardo Jorge, Lisbon,Portugal (B Nunes PhD);Department of Public Healthand Clinical Medicine, UmeåUniversity, Umeå, Sweden(Prof B Forsberg PhD,C Åström PhD); NationalInstitute of EnvironmentalHealth Science, NationalHealth Research Institutes,Zhunan, Taiwan (S-C Pan PhD,Prof Y L Guo PhD); Departmentof Statistics andComputational Research.Universitat de València,Valencia, CIBERESP, Spain(C Íñiguez PhD); NationalInstitute for Public Healthand the Environment (RIVM),Centre for Sustainability andEnvironmental Health,Bilthoven, Netherlands(C Ameling BS,D Houthuijs MSc); Departmentof Environmental Health,National Institute ofPublic Health, Cuernavaca,Morelos, Mexico(C De la Cruz Valencia MSc,Prof M Hurtado-Díaz PhD);Department of EnvironmentalHealth, Faculty of PublicHealth, University of Medicineand Pharmacy at Ho Chi MinhCity, Ho Chi Minh City, Vietnam(D V Dung PhD, T N Dang PhD);Department of Hygiene,Epidemiology and MedicalStatistics, National andKapodistrian University ofAthens, Athens, Greece(Prof E Samoli PhD,Prof K Katsouyanni PhD);Department of Statistics,Computer Science andApplications “G Parenti”,University of Florence,e581
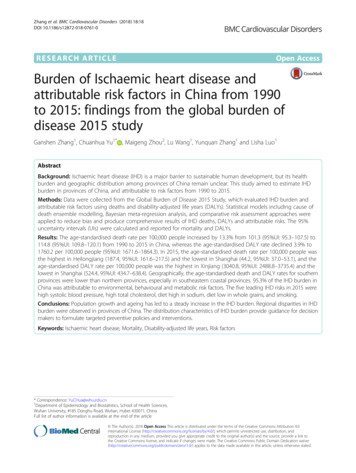
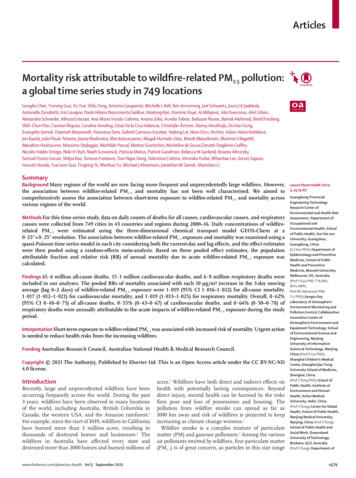
Articlese5821·03other-source PM2·5 were compared with those that didnot, using data from cities with available groundmeasured PM2·5. To test whether 7 days were sufficient tocapture the lag effects of PM2·5, sensitivity analyses weredone by extending the maximum lag time from 7 to 10days. To test the robustness of the results, the degrees offreedom for meteorological variables were changed to 3,5, and 6, and lag times up to 10 days were considered forthese variables. The city-specific models were alsochecked by only controlling for ambient temperature. Allanalyses were done using R software (version 4.0.1) andthe mvmeta R package.281·02Role of the funding source1·01The funders of the study had no role in study design,data collection, data analysis, data interpretation, orwriting of the report.All-cause mortality1·03Single day3-day moving averageRelative risk1·021·011·000·99Relative riskCardiovascular mortality1·00Results0·99Respiratory mortality1·031·02Relative riskFlorence, Italy (F Sera); Instituteof Tropical Medicine“Alexander von Humboldt”,Universidad Peruana CayetanoHeredia, Lima, Peru(G Carrasco-Escobar MSc);Climate Change ResearchCenter, Institute ofAtmospheric Physics, ChineseAcademy of Sciences, Beijing,China (Y Lei MD); Institute ofFamily Medicine and PublicHealth, University of Tartu,Tartu, Estonia (H Orru PhD);Department of Public HealthSciences, Graduate School ofPublic Health, Seoul NationalUniversity, Seoul, South Korea(H Kim PhD); Faculty ofGeography, Babes-BolayUniversity, Cluj-Napoca,Romania (I-H Holobaca PhD);Department of EnvironmentalHealth, Instituto Nacional deSaúde Dr Ricardo Jorge, Porto,Portugal (J P Teixeira PhD,J Madureira PhD); EPIUnitInstituto de Saúde Pública,Universidade do Porto, Porto,Portugal (J Madureira); EstonianEnvironmental ResearchCentre, Tallinn, Estonia(M Maasikmets PhD); SwissTropical and Public HealthInstitute, Basel, Switzerland(M S Ragettli PhD); SwissTropical and Public HealthInstitute, University of Basel,Basel, Switzerland(M S Ragettli); Department ofGlobal Health Policy, GraduateSchool of Medicine,The University of Tokyo, Tokyo,Japan (M Hashizume PhD);Department of Epidemiology,Lazio Regional Health Service,Rome, Italy (M Stafoggia PhD,M Scortichini MSc); SantéPublique France, Departmentof Environmental andoccupational Health, FrenchNational Public Health Agency,Saint Maurice, France(M Pascal PhD); Department ofPublic Health, Universidad delos Andes, Santiago, Chile(N Valdés Ortega MSc,P Matus PhD); GangarosaDepartment of EnvironmentalHealth, Rollins School of PublicHealth, Emory University,Atlanta, GA, USA(N Scovronick PhD);Technological UniversityDublin, Dublin, Ireland(Prof P Goodman PhD); Councilfor Scientific and IndustrialResearch, Pretoria, South Africa(R M Garland PhD); Departmentof Geography, Geoinformaticsand Meteorology, University of1·011·000·99012345670–2Lag dayFigure 2: Pooled relative risks of mortality associated with a 10 µg/m³increase in wildfire-related PM2·5 during lag 0–7 daysEstimates show the single-day effects or 3-day moving average effect ofwildfire-related PM2·5 on mortality, with bars representing 95% CIs.(I² 13–50%), and almost no heterogeneity for cardio vascular (I²: 0–10%) and respiratory (I²: 0–18%) mortality(appendix p 8). Therefore, based on the pooled globallevel risk estimates and assuming that the observedrelationship was causal, the population attributablefraction (PAF) of annual deaths due to short-termexposure to wildfire-related PM2·5 was calculated.24 First,the number of annual deaths attributable to wildfirerelated PM2·5 was calculated for each city using pooledglobal-level effect estimates. Then, the total number ofattributable deaths was divided by the total number ofdeaths across all cities to derive the pooled PAF at a globallevel. Additional analyses were done by pooling cityspecific results at country, WHO region, and GDP levels.If only one city of a country was included in this study, theresults for that city were used to represent its country.These analyses were done separately for all-cause,cardiovascular, and respiratory mortality. The specificformulas used are shown in the appendix (pp 5–6).To examine the potential confounding effects ofPM2·5 from other sources, the results controlling forA summary of study locations, periods, and number ofdeaths is shown in the appendix (pp 6–7). In total,65·6 million all-cause deaths, 15·1 million cardiovasculardeaths, and 6·8 million respiratory deaths were includedin the analyses. Countries and regions contributed amedian of 14·0 years (IQR 6·5). The maximumconcentrations of estimated daily PM2·5 induced bywildfires varied substantially by study location (figure 1).The highest daily concentrations of wildfire-relatedPM2·5 ( 100 µg/m³) were mainly estimated for cities inNorth America and east Asia, such as Saskatoon(Canada), Spokane (USA), Regina (Canada), andChuncheon and Icheon (South Korea), whereas thelowest concentrations ( 10 µg/m³) were mainly observedin Europe, such as Rennes and Paris (France), Bern(Switzerland), and Turin (Italy). 665 (89%) of the749 cities had a mean concentration of estimated dailywildfire-related PM2·5 of less than 2 µg/m³, with IQRs ofless than 5 µg/m³ across all cities (appendix pp 17–18).Additional statistical information of wildfire-relatedPM2·5 in study locations are shown in theappendix (pp 9–11).When considering pooled associations between dailyexposure to wildfire-related PM2·5 and daily mortalityduring lag 0–7 days, we found that the effects tended todisappear after lag 2 days (figure 2); we thus focused onthe effect estimates during lag 0–2 days. Wildfire-relatedPM2·5 exposure was significantly associated with all-causemortality at lag between 0 and 2 days, with the greatestrisk at lag 0 days (RR 1·021 [95% CI 1·018–1·024] per10 µg/m³ increase), followed by lag 1 day (1·014[1·012–1·016]) and lag 2 days (1·005 [1·002–1·007]).Similar results were seen for cardiovascular mortality(1·017 [1·014–1·021] at lag 0 days, 1·013 [1·009–1·016] atlag 1 day, and 1·005 [1·001–1·009] at lag 2 days) andrespiratory mortality (1·020 [1·015–1·024] at lag 0 days,1·014 [1·010–1·019] at lag 1 day, and 1·006 [1·001–1·011]at lag 2 days).www.thelancet.com/planetary-health Vol 5 September 2021
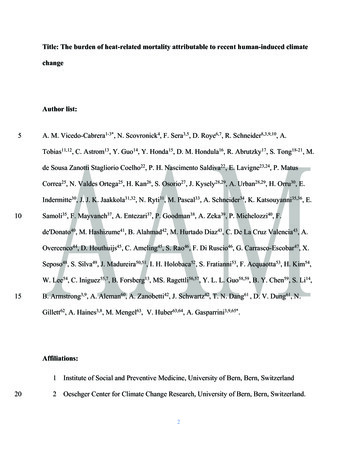
ArticlesThe 3-day moving average of wildfire-related PM2·5 (lag0–2 days) was significantly associated with the three causesof mortality: RR 1·019 (95% CI 1·016–1·022) for all-causemortality, 1·017 (1·012–1·021) for cardiovascular mortality,and 1·019 (1·013–1·025) for respiratory mortality. Thepooled results for 3-day moving average of wildfire-relatedPM2·5 at the country level are shown in table 1 and thosepooled by WHO region and by GDP level are presented inthe appendix (p 12). The highest unit RRs for all-causemortality were observed in Europe, particularly in France,Italy, Germany, and Romania. The highest unit RRs forcardiovascular mortality were observed in Europe(including Portugal, Spain, and the Czech Republic) andthe highest RRs for respiratory mortality were observed inEurope and Asia (including the Philippines, Sweden, andKuwait; table 1).When assessing the pooled concentration–responserelationships between mortality and the 3-day movingaverage of wildfire-related PM2·5, RRs initially increasedwith respect to concentrations for both all-cause andcardiovascular mortality, levelling out at around 20 μg/m³(figure 3). For respiratory mortality, the same relationshipoccurred at lower concentrations, with RRs levelling outat around 15 μg/m³; however, a marked increase in RRwas observed at concentrations greater than 30 µg/m³(figure 3).Based on the pooled global associations betweenmortality and the 3-day moving average of wildfire-relatedPM2·5, an estimated 33 510 all-cause deaths (95% CI26 204–40 763), 6993 cardiovascular deaths (5466–8510),and 3503 respiratory deaths (2739–4259) were attributableto acute wildfire-related PM2·5 exposure annually onaverage, corresponding to PAFs of 0·62% (95% CI0·48–0·75) for all-cause mortality, 0·55% (0·43–0·67) forcardiovascular mortality, and 0·64% (0·50–0·78) forrespiratory mortality. PAFs are shown by country or regionin table 2, and by WHO region and GDP level in theappendix (p 13), alongside the corresponding attributablenumbers of deaths (p 16). The highest PAFs for all-causemortality due to acute wildfire-related PM2·5 exposure wereobserved in Thailand, Guatemala, Mexico, Paraguay, andPeru. WHO regions showing the highest PAFs for allcause mortality were Central America (1·73%, 1·35–2·10),South-East Asia (1·63%, 95% CI 1·29–1·97), and SouthAfrica (0·99%, 0·78–1·21); these three regions, alongsideSouth America, also showed the highest PAFs forcardiovascular and respiratory mortality, with PAFsgreater than 1·00% (appendix p 13).Sensitivity analyses showed that the pooled results didnot change substantially by further controlling for othersource PM2·5 (appendix pp 19–20). The pooled resultsusing adjusted and unadjusted wildfire-related PM2·5 wereconsistent, although greater uncertainties were observedfor results using unadjusted data (appendix pp 20–21).Lags of up to 2 days were sufficient to capture the lageffects of PM2·5, as no significant associations of wildfirerelated PM2·5 exposure were observed during lagswww.thelancet.com/planetary-health Vol 5 September 2021All-cause mortalityCardiovascular mortalityRespiratory mortalityArgentina1·040 (1·017–1·063)NANAAustralia1·002 (0·991–1·012)NANABrazil1·011 (0·998–1·024)NANACanada0·992 (0·978–1·007)0·997 (0·974–1·021)1·023 (0·994–1·053)Chile1·033 (1·010–1·056)NANAChina1·030 (1·005–1·055)1·026 (0·982–1·073)1·006 (0·977–1·036)Colombia1·028 (1·011–1·046)1·023 (0·992–1·055)1·002 (0·975–1·029)Costa Rica1·069 (1·032–1·106)1·061 (0·995–1·131)1·000 (0·994–1·006)Czech Republic1·073 (1·009–1·142)1·070 (0·954–1·200)1·039 (0·951–1·137)Ecuador1·010 (0·935–1·091)1·033 (0·911–1·172)1·066 (0·886–1·281)Estonia0·995 (0·955–1·036)NANA0·974 (0·869–1·070)Finland1·001 (0·997–1·005)1·006 (0·999–1·012)France1·253 (1·079–1·455)NA1·022 (0·989–1·056)Germany1·126 (1·068–1·188)NANAGreece1·009 (1·002–1·016)1·015 (1·005–1·024)1·010 (0·991–1·030)Guatemala0·996 (0·990–1·002)NANAIran1·014 (0·998–1·030)1·030 (1·006–1·055)1·006 (0·987–1·024)Ireland0·891 (0·751–1·057)1·059 (0·713–1·573)1·033 (0·997–1·070)Italy1·139 (1·081–1·199)NANAJapan1·027 (1·022–1·032)1·027 (1·017–1·036)1·022 (1·005–1·040)Kuwait1·017 (0·989–1·045)1·044 (1·006–1·083)1·105 (0·973–1·239)Mexico1·002 (0·997–1·007)1·001 (0·991–1·011)1·072 (0·943–1·218)Moldova1·041 (0·916–1·182)NANANetherlands0·990 (0·842–1·164)NANANorway1·016 (0·995–1·036)1·034 (1·000–1·067)1·006 (0·987–1·024)Panama1·011 (0·918–1·111)0·989 (0·839–1·161)1·035 (0·949–1·126)Paraguay1·001 (0·999–1·003)1·000 (0·997–1·003)1·004 (0·999–1·009)Peru0·975 (0·957–0·994)NANAPhilippines1·008 (0·983–1·034)1·000 (0·946–1·058)1·171 (0·963–1·423)Portugal1·062 (0·999–1·130)1·101 (0·967–1·254)1·009 (0·975–1·043)Puerto Rico1·053 (1·003–1·106)NANARomania1·116 (1·075–1·158)NANASo
Mortality and socioenvironmental data . Mortality data in this study were obtained from the . MCC Collaborative Research Network, an international collaboration of research teams established to perform epidemiological studies on associations between environ-mental stressors and health. 17,18. The current MCC Network