Transcription
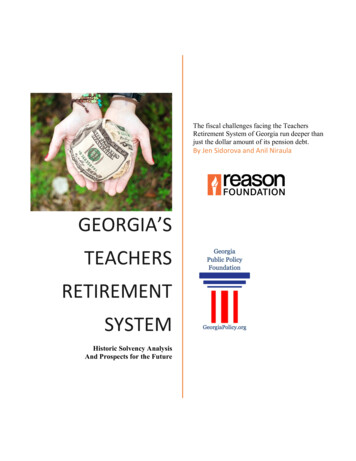
The fiscal challenges facing the TeachersRetirement System of Georgia run deeper thanjust the dollar amount of its pension debt.By Jen Sidorova and Anil NiraulaGEORGIA’STEACHERSRETIREMENTSYSTEMHistoric Solvency AnalysisAnd Prospects for the Future
1Georgia TRS: Historic Solvency Analysis and Prospects for The FutureBy Jen Sidorova and Anil NiraulaProject Directors:Leonard Gilroy, Reason FoundationKyle Wingfield, Georgia Public Policy FoundationI.IntroductionThe Teachers Retirement System of Georgia (TRS) surprised many during the 2017 legislativesession by requesting an additional 223.9 million in annual funding, then did so again in 2018,requiring an additional 364.9 million in contributions. The nearly 600 million in annualincreases to teacher pension funding have been necessary in large part because of growingunfunded liabilities – colloquially known as pension debt – which were reported at 23.6 billionin 2016. Since then the debt has grown to 24.8 billion, but in contrast with previous years TRSrequested a relatively smaller annual increase of just 25 million for 2019. Does that mean TRSis experiencing “improving financial strength,” as a teachers association leader recently told TheAtlanta Journal-Constitution?1Unfortunately, the answer is no. The increases in annual contributions may have slowed downthis year, but the growth in costs is still continuing. The fiscal challenges facing TRS run deeperthan just the dollar amount of its pension debt.This policy brief will summarize some of the primary causes of Georgia’s 24.8 billion2 inunfunded teacher pension liabilities (see Figure 1) and highlight key indicators that furthercontribution rate increases are likely in coming years without a meaningful change to the statusquo.Operationally, TRS is a strong system that provides a valuable service to its members – but thereare factors outside of its control that suggest it would be prudent for the TRS board and GeorgiaLegislature to consider a slate of improvements to improve solvency, help the pension systembetter manage risk and, ultimately, ensure that the state can deliver the promised retirementbenefits to teachers.1James Salzer, “State payments to Georgia teachers’ pension fund should begin to ease,” The Atlanta JournalConstitution, June 4, 2018.2In fiscal year 2017 the unfunded pension liability of Georgia TRS amounted to 24.77 billion on actuarial basis and 18.59 billion on market value basis (as reported under the new GASB 67/68 standards).Reason.org /GeorgiaPolicy.org
2 27140% 24125% 21110% 1895% 1580% 1265% 950% 635% 320% 05%- 3-10%19982000200220042006200820102012Source: Pension Integrity Project analysis of TRS Valuation ReportsII.Funded RatioUnfunded Liability, Actuarial Value (in Billions)Figure 1. TRS’s History of Volatile Solvency, 1998-201720142016A Summary of Problems for TRS: What is Causing Pension Debt?Over the past 20 years, contributions from the Georgia state budget and school districts into theTRS pension fund have outpaced the economic growth of the state. The pace of contributionincreases became particularly pronounced starting in 2012 and, as of last year, TRS pensioncontributions have grown by 67 percent since 2002, while Georgia’s economy only grew by 23percent during the same timeframe.3 This trend is now surfacing in the form of annual increasesthat demand more and more of the state budget each year.What’s driving this trend is not simply something like the 2008-09 financial crisis. While themarket crash certainly hurt TRS, more than a decade later markets have fully recovered – yetTRS has not returned to the funded status it had before the crisis. As shown in Appendix A, since2009, both the S&P 500 and Dow Jones Industrial Average have been on a pronounced upwardtrajectory relative to pre-crisis levels, reaching historic highs, whereas TRS’s funded ratioeffectively flat-lined during that same period.Overall, unfunded liabilities have not returned to the pre-crisis level. The reality is that the risksfacing TRS are much deeper than a reaction to economic shocks or cyclical fluctuations. Theexperience of the last decade shows any expectation TRS will recover together with the market isno longer realistic. And the deep, underlying problems – most importantly, actual experience not3The estimates are adjusted for inflation.Reason.org /GeorgiaPolicy.org
3matching actuarial assumptions and the funding structure of the pension plan resulting innegative amortization – are becoming clearer.Figure 2 presents the component parts of today’s current teacher pension unfunded liability inGeorgia. The largest component of TRS’s unfunded liability is underperforming investments.Since 2001, investment returns have averaged 5.5 percent, lower than the assumed 7.5 percentreturn the TRS board has targeted (see discussion in Appendix B). This is not to say the 5.5percent average return was necessarily a bad result over that period compared to internalinvestment benchmarks or the performance of other statewide pension plans, but it wasn’tenough compared to the assumed return. Overall, this problem created 9.7 billion in unfundedliabilities between 1998 and 2017.4 This is particularly alarming, because the interest earnedthrough investing contributions is the primary source of the income for TRS’s funds.Net Change toUnfunded LiabilitySalaries GrowingSlower e &Changed Methods ions 24 22 20 18 16 14 12 10 8 6 4 2 0- 2- 4UnderperformingInvestments &Interest RateSmoothingChange in Unfunded Liability (in Billions)Figure 2. Actuarial Experience of TRS, 1998-2017Source: Pension Integrity Project analysis of TRS CAFRs. The values show cumulative year-over-yearchange in unfunded liabilities by gain/loss category and may not exactly match the reported unfundedactuarial liability change for the same period due to rounding, revisions and other factors.If we total up the gains and losses from all actuarial assumptions other than investment returns, itis clear they are also driving a considerable amount of the unfunded liabilities, cumulativelyadding about 12.7 billion. This breaks down in some ways that are important to understand: Actual demographic experience has been different than expected. People are livinglonger, employee turnover rates have been higher, and older teachers are not retiring as4The 9.7 billion figure reflects the net total of actuarial gains and losses for investment returns and interest ratesmoothing, as reported in actuarial valuation reports from the TRS.Reason.org /GeorgiaPolicy.org
4quickly as expected. Since 1998, missing on these assumptions has added 7.4 billion tounfunded liabilities. Meanwhile, actual changes to salaries have been less than expected. This has resulted inlower teacher pay, lower total payrolls and, thus, lower pension benefits. Ironically, suchstagnation in compensation is a “gain” to the pension plan, something that has pusheddown unfunded liabilities about 2.5 billion between 1998 and 2017. A significant portion of the rest of today’s unfunded liabilities are the result of negativeamortization. Over the past two decades there have only been five years when theunfunded liability amortization payments have been greater than the interest accruing onTRS pension debt. This has made for a more challenging fiscal environment and in thelong run will make it more expensive to pay off unfunded liabilities.III.Has TRS Turned a Corner on These Problems?During the fiscal year ending June 2017, TRS earned a 12.5 percent return. In the fiscal year thatended June 2018, TRS earned a reported 8.94 percent5 return. It is tempting to suggest thisperformance above the 7.5 percent assumed return portends a bright future for the teacherpension system. But while these are certainly positive experiences, they need to be considered inthe context of the “new normal” of lower investment returns for the current and coming decade,relative to historic average returns. In Appendix B, we show how the probability of reaching a7.5 percent return in the coming years is at best a 50/50 toss-up, and perhaps much less than that.Averaging even a 6 percent rate could be challenging.The risk that investments will underperform assumptions in the long run creates the potential forfuture volatility in contribution rates. What might not seem like a big deviation from the actualdemographic or asset performance rates right now will accumulate into a significant unfundedliability over time. For TRS to work as it is, all assumptions need to become a reality without theslightest deviation. But the sensitivity analysis in Appendix C shows that even with assumptionsrelying on up-to-date experience investigations, if actual experience does not match thoseassumptions then there could be a range of increases in required contributions.5Teachers Retirement System of Georgia, “Teachers Retirement: Policy, Sustainability, & Maximizing the Systemfor Supporting Education in Georgia,” Presentation to the Georgia Association of Educational Leaders. July 10,2018. Available at: http://www.gael.org/uploads/conference presentation/1531921085a50b97b9d05ecd0a8/TRS presentation.pdfReason.org /GeorgiaPolicy.org
5IV.ConclusionThe Teachers Retirement System of Georgia’s 24.8 billion in unfunded liabilities is asustainability threat for the pension plan, its members, school districts and Georgia taxpayers.Where there is no near-term threat of the pension fund becoming insolvent, the growing costs forthe plan based on current funding policies and assumptions are beginning to crowd out otherpublic services. School districts are left with less money for teacher salaries, classroom supplies,infrastructure, equipment, maintenance, etc. Growing unfunded pension liabilities could alsoeventually threaten the state’s credit rating.Georgia needs to address the core problems driving up the pension liabilities. It needs to considernot only the amount of unfunded liabilities already generated, but also the factors driving thecreation of that pension debt and how future changes can avoid further accumulation. Suchchanges may include adjusting assumptions to have less risk of underperformance and changingthe funding policy to pay debt down faster – and any set of changes along these lines wouldrequire a significant increase in near-term contributions, though with the objective of reducinglong-term contributions. Georgia may also want to consider how alternative plan designs – suchas defined-benefit pension plans designed to better manage risk, hybrid or cash-balance plans, orincome-focused defined-contribution plans – that can help mitigate against building up furtherpension debt.The price future generations will pay for not addressing TRS challenges now is not onlymeasured in dollars paid for debt financing; it is also measured in forgone opportunities. If TRSis not put on a more realistic path to long-term solvency, future generations will have to pay forthe presently created debt and will struggle to realize their potential because of the redirection ofresources that could otherwise be used to focus on the primary functions of the education system.Reason.org /GeorgiaPolicy.org
6Basics of Defined-Benefit Pension FinancingUnderstanding the TRS Defined-Benefit PensionDefinitionA traditional defined-benefit pension plan design has retirement benefitsdetermined by a formula based on years of service and some averagedamount of salary, with future monthly payments guaranteed by futuretaxpayers.TRS BenefitMembers are eligible to retire at age 60 with at least 10 years of service, or atFormulaany age with 25 years of service. The monthly pension benefit is calculatedas:(Years of service) x (2%) x (the member’s average annual compensationduring the two consecutive years producing the highest average)Who Carries the Taxpayers and school districts bear the risk of any investment losses becauseInvestment Risk? they guarantee pension payments. If historic contributions are not enough topay out benefits because investments have underperformed or other actuarialassumptions have been wrong, then tax increases or budget cuts arenecessary to make up the difference.How are COLAs Cost-of-living adjustments (COLAs) are provided by the Georgia LegislaturePaid For?on an “ad hoc” basis whenever there is the political desire to provide thenecessary funds. COLAs are not pre-funded with annual contributions in thesame way that pension benefits are pre-funded.Important Definitions and Terms for Pension FinanceNormal Cost is the actuarially determined amount that needs to be contributed to the pensionfund today for it to grow over time and be sufficient to pay out benefits in the future. For thenormal cost to be adequate, the actuarial assumptions that go into its calculation must be correct.If any of the assumptions – such as mortality, retention, assumed rate of return, etc. – are overlyoptimistic or underestimate future experience, they may lead to unfunded liabilities.Unfunded Liability Amortization Payments are regular contributions made to reduce theunfunded liability. Similar to paying off a loan or bond, they are paid on a set schedule. The TRSboard determines the time period to pay off certain portions of unfunded liabilities, and theactuary calculates how much should be paid each year. Such payments may be equal dollaramounts each year, or the dollar amount of payments may be tied to a predetermined percentageof payroll each year.For TRS, the total (transitional) unfunded liability as of 2013 is being paid off over a 30-yearperiod on a level-percentage of payroll. Payments in FY2018 will be for year 26 of the schedule,which will count down to zero by 2043. Beginning after 2013, any new (incremental) unfundedliabilities that arise in a given year are put on their own, separate 30-year schedule. Thus, the totalunfunded liability amortization payments for TRS for year 2017 represent the total amountneeded for all debt schedules.Assumed Rate of Return (ARR) is the assumption about how much all of the contributions intothe pension fund will earn as investments. The ARR is a rate chosen by the TRS board based onReason.org /GeorgiaPolicy.org
7what investment advisors think the pension fund’s portfolio can earn in the near term and longterm. Typically, pension boards choose an ARR close to the “expected” rate of return, which isthe rate of return investment advisors think the fund has a 50 percent chance of earning. TheARR is used to determine how much the employer should contribute to the pension plan on anannual basis to honor the retirement benefits for all employees. (The “assumed rate of return” istechnically different from the “expected rate of return,” although the two terms are frequentlyused interchangeably.)Negative Amortization occurs when unfunded liability amortization payments are less than theinterest accruing on that same unfunded liability. This is the opposite of what the amortizationpayments are supposed to do – paying off a loan with regular payments so the total amount owedgoes down with each payment. With negative amortization, even though payments go into theplan, the amount of pension debt can still grow.Discount Rate is used to determine the net present value of all of the already-promised pensionbenefits. Actuaries count up all expected future pension checks that will be paid, then “discount”the value of those back to current dollars. The higher the discount rate, the lower the estimatedvalue of promised benefits; the lower the discount rate, the higher the estimated value ofpromised benefits. Standard practice for actuaries is to use the assumed rate of return on assets asthe discount rate for estimating the value of liabilities. If a pension plan chooses to target a highrate of return with its portfolio of assets, and that high assumed return is then used to calculatethe value of the existing promised benefits, the result is likely to be that the actuariallyrecognized amount of those promised benefits is less than actually promised, and vice versa.Note that formally promised pension benefits are called “accrued liabilities.”Reason.org /GeorgiaPolicy.org
8Appendix A: Comparing the TRS Funded Ratio to Stock Market IndicesFigure A1. S&P 500 Index and TRS Funded Ratio2,500140%Standard and Poor's 500 05002009End of Financial Crisis1,000TRS Funded Ratio (Actuarial Value)120%2,0002008S&P 500 Index (Average Annual Value)TRS Funded RatioSource: Pension Integrity Project analysis of TRS actuarial valuation reports and Yahoo Finance data.Figure A2. Dow Jones Industrial Average and TRS Funded RatioDow Jones Industrial Average (DJIA)25,000140%100%15,00080%60%End of Financial 0%Source: Pension Integrity Project analysis of TRS actuarial valuation reports and Yahoo Finance data.Reason.org /GeorgiaPolicy.orgTRS Funded Ratio (Actuarial Value)120%20,0002009Dow Jones Industrial Average (Annual Value)TRS Funded Ratio
9Appendix B: Georgia’s Investment Risk and the “New Normal” for ReturnsSince 2003, Georgia has used a 7.5 percent assumed investment return on assets, despitesignificant market changes leading to lower-than-expected returns. Several reasons make thisassumption worrisome.1. Low average market returns. The average market-valued returns in the past 17 years havebeen 5.5 percent. This statistic captures much of the buildup and bursting of the dot-combubble (2000-2002) and the financial crisis of 2008-09, as well as any positiveinvestment return shocks and tendencies. Figure B1 shows the rate of return history overthe past two decades, including the fact that a rolling 10-year average has beenconsistently below the assumed return target. Table B1 shows a few snapshot averagereturns based on different time periods.Figure B1: Investment Return History, 18%Market Valued Returns (Actual)Assumed Rate of Return10-Year Geometric Rolling AverageActuarially Valued Investment Returns (Smoothed by Plan)20012003200520072009201120132015Source: Pension Integrity Project analysis of TRS actuarial valuation reports and CAFRs.Reason.org /GeorgiaPolicy.org2017
10Table B1. Average Rates of Return Over Different Periods of TimePeriodAverage Market-Valued Returns17 Years (2001-17)5.52%15 Years (2003-17)6.93%10 Years (2008-17)6.14%5 Years (2013-17)9.44%Source: Pension Integrity Project analysis of TRS actuarial valuation reports. Average market-valuedreturns represent geometric means of the actual time-weighted returns.2. The new normal in investment returns. Virtually all capital market assumptions about thenext 10 to 20 years hold that average returns will be less than the last 20 to 30 years. Thisis not to say investments will be negative, or that strong single years are impossible;certainly, returns over the past few years have been solid, including a 9.4 percent averagefive-year return. But markets have fundamentally changed since the high interest-rateyears in the 1980s and 1990s, and structural changes in the global and U.S. economieshave created an environment where expectations of investment returns consistently ashigh as 30-year averages are unreasonable. Consider how much interest rates have fallenover the past few decades (Figure B2), and consider how much more risk will be requiredto get higher investment returns.Reason.org /GeorgiaPolicy.org
11Figure B2. Comparing Changes in Discount Rate and Risk Free Rate, 2000-201710%9%8%7%6%5%4%3%30-Year Treasury Bond Yield RateTRS Discount ce: Pension Integrity Project analysis of TRS actuarial reports and Treasury yield data from theFederal Reserve3. Taking on more investment risk to maintain the same assumption. Generally speaking,TRS has always been invested in stocks and bonds, with restrictions against alternativeforms of investing. Over the past few decades, however, the ratio of stocks and bonds inthe portfolio has shifted. Figure B3 shows that around 2009 there was a sharp drop in thepercentage of fixed income, from about 40 percent before to roughly 30 percent today.The advantage of this shift is to increase the earnings potential of the portfolio; equitiestypically return higher yields than fixed income. However, this has also increased thevolatility of returns and added risk.Reason.org /GeorgiaPolicy.org
12Figure B3. TRS Asset Allocation (2001-2017)100%90%% of Investment Portfolio80%US Equities70%60%50%40%Foreign Equities30%Low Riskand/or HighTransparency20%Fixed rt TermBonds and Fixed IncomeEquitiesSource: Pension Integrity Project analysis of TRS actuarial valuation reports and CAFRS.Reason.org /GeorgiaPolicy.org
13Appendix C: Contribution Rate Volatility RiskAll defined-benefit pension plans have some risk that actuarial assumptions will not line up withactual real-world experience in the future. Underperformance, overestimation or underestimation– depending on the assumption – can all lead to an increase in the need for additionalcontributions in the future. But how much of an increase is possible?In Appendix B, we provided some analysis suggesting the average investment return over thenext few decades is more likely to be less than 7.5 percent than to reach that level or surpass it.Since 2001, the average return has been 5.5 percent, and a range of capital-market forecastssuggests a 6.5 percent return may be more likely for the current portfolio. Figure C1 shows howcontribution rates might increase in the future if the actual average returns matched eitherscenario, falling short of projections by 100 and 200 basis points, respectively.Figure C1. Sensitivity Analysis: Employer ContributionEmployer Contribution, ADC Basis (as a % of Payroll)35%30%25%20%15%Alternative Scenario: Actual Average Returns of 5.5%10%Alternative Scenario: Actual Average Returns of 6.5%5%What TRS Assumes Will Happen: Historic ActualContribution Forecasted Employer 20020%Source: Pension Integrity Project actuarial forecast of TRS (current as of September 2018).A 6.5 percent actual return over the next few decades will raise the employer contribution to 22percent of payroll by FY2040, which would result in a 4.7 billion inflation-adjusted increase( 7.7 billion nominal difference) from the current number. Similarly, a 5.5 percent averagereturn would increase the employer contribution to approximately 27 percent of payroll over thesame period. It is important to also keep in mind that if the employer is not able to fullycontribute at the appropriate time, amortization payments will keep rising, creating greaterunfunded liability and even higher contributions than forecasted here.Reason.org /GeorgiaPolicy.org
14It is important to note that no matter what the average return, forecasts like this are only intendedto give a sense of the direction of future contribution rates under different scenarios. Actualinvestment performance from year to year has more variance, and the timing of returns canmatter a lot. If the next 10 years have relatively low returns, then even a strong performance inlater years might not be enough to prevent contribution rate increases. Figure C2 illustrates howeven if TRS were able to reach an average return of 7.5 percent, when the strong returns landmatters a lot in determining the contribution rates. Another thing to keep in mind is that everyyear the assumptions are not met, the debt keeps growing, increasing the employer contributioneven as it pays down the original unfunded liability.Figure C2: Actuarially Determined Contribution Forecast, % of payrollEmployer Contribution, ADC Basis (% of Payroll)50%Long-term 7.5% Return: Mixed Timing of Strong and Weak ReturnsLong-term 7.5% Return: Even, Equal Annual ReturnsLong-term 7.5% Return: Strong Early Returns40%Long-term 7.5% Return: Weak Early 20322030202820262024202220202018-20%Source: Pension Integrity Project actuarial forecast of TRS plan (current as of September 2018). Strongearly returns (TWRR 7.4%, MWRR 8.5%), Even, equal annual returns (Constant Return 7.5%),Mixed timing of strong and weak returns (TWRR 7.5%, MWRR 7.5%), Weak early returns (TWRR 7.5%, MWRR 6.5%) Scenario assumes that TRS pays the actuarially required rate each year. Yearsare plan’s fiscal years.TWRR Time-Weighted Average Rate of Return; MWRR Money-Weighted Average Rate of ReturnReason.org /GeorgiaPolicy.org
15About the AuthorsJen Sidorova is a policy analyst with the Pension Integrity Project at Reason Foundation, anonprofit think tank advancing free minds and free markets. She holds Master of Arts degrees ineconomics and political science from Stony Brook University, where she served as president ofthe student government. During her training she focused on research methods and quantitativeanalysis. Before joining Reason, Jen worked in academia and the private sector, includinginternships at the Cato Institute and the United Nations.Anil Niraula is a policy analyst with the Pension Integrity Project at Reason Foundation. He is agraduate of The University of Edinburgh (UK) with MS in International Business and JohnsHopkins University (US) with a MS in Applied Economics. He has also graduate of the KochAssociate Program. He joined Reason Foundation in 2016 where he works primarily on publicpension underfunding, historical pension analysis, and reform. His writing interests include roleof financial market volatility and funding arrangements in pension policy, labor markets and taxpolicy issues. He is based in Washington, D.C.Leonard Gilroy is Senior Managing Director of the Pension Integrity Project at ReasonFoundation and a Senior Fellow at the Georgia Public Policy Foundation. Gilroy has adiversified background in policy research and implementation, with particular emphases on fiscalsustainability, competitive government, transparency, accountability, and governmentperformance.Kyle Wingfield is President and CEO of the Georgia Public Policy Foundation(georgiapolicy.org). Established in 1991, the Foundation is an independent, nonprofit think tankthat proposes market-oriented approaches to public policy to improve the lives ofGeorgians. The Think Tanks and Civil Society Program ranked the Foundation as one of the“Best Independent Think Tanks” in its 2017 Global Go-To Think Tank Index, released inFebruary 2018. Before joining the Foundation, Wingfield spent nine years as a columnist at TheAtlanta Journal-Constitution and five years with The Wall Street Journal based in Brussels,Belgium.The Pension Integrity Project at Reason Foundation (reason.org/pension) offers pro-bonoconsulting to public officials and other stakeholders to help them design and implement pensionreforms that improve plan solvency and promote retirement security. The project team provideseducation, reform policy options, and actuarial analysis for policymakers and stakeholders tohelp them design reform proposals that are practical and viable. The project aims to promotesolvent, sustainable retirement systems that provide retirement security for government workerswhile reducing taxpayer and pension system exposure to financial risk and reducing long-termcosts for employers/taxpayers and employees. Georgia Public Policy Foundation (September 2018). Permission to reprint in whole or in partis hereby granted, provided the authors and their affiliations are cited.Find updates to this Issue Analysis at mentsystemReason.org /GeorgiaPolicy.org
The Teachers Retirement System of Georgia (TRS) surprised many during the 2017 legislative session by requesting an additional 223.9 million in annual funding, then did so again in 2018, . again in 2018, requiring an additional 364.9 million in contributions. The nearly 600 million in annual increases to teacher pension funding have been .
