Transcription
Teachers Retirement System of GeorgiaExperience Investigation for theFive-Year Period Ending June 30, 2018
Cavanaugh MacdonaldC O N S U L T I N G, L L CThe experience and dedication you deserveMay 13, 2020Board of TrusteesTeachers Retirement System of GeorgiaSuite 100, Two Northside 75Atlanta, GA 30318Members of the Board:We are pleased to submit the results of an investigation of the economic and demographicexperience for the Teachers Retirement System of Georgia. The investigation has been made inaccordance with Section 47-3-23(b) of the retirement law which provides that at least once in everyfive-year period, the actuary shall make an actuarial investigation into the mortality, service andcompensation experience of the members and beneficiaries of the Retirement System. Thepurpose of the investigation is to assess the reasonability of the actuarial assumptions and methodscurrently used by the Retirement System. This investigation covers the five-year period fromJuly 1, 2013 to June 30, 2018. As a result of this investigation, it is recommended that revisedeconomic assumptions and demographic tables be adopted by the Board for future use.The investigation of the demographic experience of members of the System includes all active andretired members as well as beneficiaries of deceased members. The experience was investigatedseparately for males and females where gender is a basis for material differences in experience.The number of members expected to separate from active service, the expected rates of salaryincrease and the expected number of post-retirement deaths were obtained by use of the ratesdetermined in the last experience investigation and adopted by the Board of Trustees. The resultsof the investigation indicate that the assumed rates of separation from active service due towithdrawal, disability, death and retirement and rates of post-retirement mortality need revision inorder to provide a better fit between the actual and anticipated experience of the RetirementSystem. As a result of the investigation, new withdrawal, disability, retirement and mortalitytables have been developed which reflect more closely the actual experience of the membership.All new assumptions are shown in the attached tables in Appendix D of this report. In the actuary’sjudgment, the recommended assumptions are suitable for use until further experience indicatesthat modifications are desirable.3550 Busbee Pkwy, Suite 250, Kennesaw, GA 30144Phone (678) 388-1700 Fax (678) 388-1730www.CavMacConsulting.comOff GA Bellevue, NEOffices in Kennesaw,
The experience investigation was performed by, and under the supervision of, independentactuaries who are members of the American Academy of Actuaries with experience in performingvaluations for public retirement systems. John Garrett and Edward Koebel meet the QualificationStandards of the American Academy of Actuaries to render the actuarial opinion contained herein.Respectfully submitted,John Garrett, ASA, FCA, MAAAPrincipal and Consulting ActuaryEdward J. Koebel, FCA, EA, MAAAChief Executive OfficerCathy TurcotPrincipal and Managing Director
Cavanaugh MacdonaldC O N S U L T I N G, L L CThe experience and dedication you deserveJune 10, 2020Dr. L. C. EvansExecutive DirectorTeachers Retirement System of GeorgiaTwo Northside 75, Suite 100Atlanta, GA 30318-7701Selection of Mortality Assumption in the Latest Experience StudyDear Dr. Evans:In the course of presenting the Experience Investigation Report for the Five-Year Period EndingJuly 1, 2018, a Board Member (Mr. Griffin) raised a question concerning our use of the headcountweighted rates versus the amount-weighted rates as the base mortality table in the assumption. Weare writing to provide our reasoning for the mortality table selection.There are two primary reasons we feel the headcount weighted table is appropriate for the selectionof a reasonable mortality assumption to be used in the future valuations for the TeachersRetirement System (TRS). First, in our experience, large statewide teacher plans are homogenousgroups and there are minor differences in amount-weighted experience. The Society of Actuaries(SOA) Pub-2010 Public Retirement Plans Mortality Table Report discusses the analysis utilizedin developing both the amount-weighted and headcount-weighted mortality rates, and includes thefollowing finding:Broadly speaking, the difference between headcount-weighted and corresponding amountweighted annuity values represents a measure of the dispersion of individual amountswithin the population being studied and the sensitivity of mortality to differences in income.More specifically, the larger the dispersion in underlying amounts, the greater (positive)differential between the amount-weighted annuity values relative to their headcountweighted counterparts. Therefore, the final columns in the three tables above indicate that The salary/benefit amount dispersion within the Teacher population (especiallyfemales) was considerably less than that for Safety and General and The salary/benefit amount dispersion for males is greater than that for femaleswithin all three job categories.3550 Busbee Pkwy, Suite 250, Kennesaw, GA 30144Phone (678) 388-1700 Fax (678) 388-1730www.CavMacConsulting.comOff GA Bellevue, NEOffices in Kennesaw,
Dr. L. C. EvansJune 10, 2020Page 2As the TRS retired population is predominately female, we do not expect a material difference inthe mortality experience based on amount weighting versus headcount weighting.Second, the annual valuations determine the actuarial gains and losses on a benefit (or liability)weighted basis. Historically, the headcount-weighted tables which have been utilized in the pasthave consistently demonstrated a very close fit to experience. Future valuations will continue toassess the fit of the new mortality assumption on a benefit weighted measure though the annualactuarial gain/loss determinations.The selection of a post-retirement mortality assumption is very material to the valuation results asit establishes the expected duration of all current and future annuity benefits provided by the Plan.The goal of the actuary is to recommend assumptions which minimize the future differencesbetween actual and expected experience (on a liability basis) and results in the best estimate of theactuarial measures and funding requirements in the annual valuations. There is no advantage tofavoring assumptions more conservative than experience. Conservative assumptions may lessenthe potential of future losses but increase the potential for future gains resulting in the over-statingthe true cost of the Plan and are at variance with the desire for long-term contribution stability.The undersigned independent consulting actuary is a member of the American Academy ofActuaries. He has experience performing valuations and experience studies for large publicretirement systems and is qualified to provide the opinions contained in this letter.Please let me know if you have any questions.Sincerely,John J. Garrett, ASA, FCA, MAAAPrincipal and Consulting ActuaryAttachment
TABLE OF CONTENTSSectionPageIExecutive Summary1IIFinancial Impact3IIIEconomic Assumptions4IVDemographic Assumptions15Rates of WithdrawalRates of Disability RetirementRates of RetirementRates of Pre-Retirement MortalityRates of Post-Retirement MortalityRates of Salary Increase162225303238Other Assumptions and Methods and Administrative Procedures39Historical June CPI (U) IndexCapital Market Assumptions and Asset AllocationSocial Security Administration Wage IndexRecommended Rates40414243VAppendixABCD
Section IExecutive SummaryThe following table summarizes the findings and recommendations with regard to the assumptionsutilized for the Teachers Retirement System of Georgia. Detailed explanations for therecommendations are found in the sections that follow.Summary of Recommended Economic and Demographic AssumptionsEconomic AssumptionsInflationInvestment Rate ofReturnReal Rate of WageIncreasePayroll Growth RateWithdrawalRetirementMortalityDisabilitySalary Increase AboveWage InflationRecommend no change in current assumption of 2.50%Composed of inflation assumption and real rate of return assumption.We recommend no change in the current assumption of 7.25%.Recommend no change in the current assumption of 0.50% annualrate of real wage increases.Recommend no change in the current assumption of 3.00%.Demographic AssumptionsRecommend changes to current assumed rates of withdrawal thatoverall increase the number of expected withdrawals.Recommend changes to current assumed rates of retirement thatoverall increase the number of expected retirements.Recommend adoption of the Pub 2010 Teachers Headcount WeightedBelow Median mortality tables with ages set forward one year andincreased 6%. Future improvement in mortality rates is assumedusing the adjusted MP-2019 projection scale generationally.Recommend lowering rates of expected disability retirement.Recommend no change in current assumption.Page 1
Recommended Other Assumption and Method ChangesThe table below lists the other assumptions and methods that are considered in our valuations thatshould be reviewed during the experience study.Assumption or MethodAdministrative ExpensesAmortization MethodRecommended ChangeRecommend change to current assumption from 0.25% to0.20% of payrollNo change to current method of level percent of payrollamortization with annual layers of changes to UAALAsset SmoothingNo change to current method of smoothing market gainsand losses over 5 year periodOption FactorsRecommend change in current option factors to reflectchange in mortality ratePercent MarriedRecommend no change to current assumptionUnused Sick LeaveRecommend changes to our loads on service for allowingmembers to convert forfeited sick leave to service atretirementValuation Cost MethodNo change in Entry Age Normal Cost MethodVested Termination BenefitRecommend change to current assumptionPage 2
Section IIFinancial ImpactThe following table highlights the impact of the recommended changes on the principal valuationresults. This table is for illustrative purposes only and not intended to modify the contributionrates set forth in the June 30, 2018 valuation report.Impact on Principal Valuation Results ( 1,000’s)Valuation Results2018RecommendedAssumptions 21,880,889 22,962,41177.4%76.6%7.25%7.40%Unfunded Accrued Liability Rate11.81%12.35%Total Rate19.06%19.75%25.625.8Unfunded Accrued LiabilityFunding RatioEmployer Annual Required ContributionNormal Rate*Amortization Period (in years)*Includes administrative expensesPage 3
Section IIIEconomic AssumptionsThere are three economic assumptions used in the actuarial valuations performed for the System.They are: Price InflationInvestment ReturnWage InflationActuarial Standard of Practice (ASOP) No. 27, “Selection of Economic Assumptions forMeasuring Pension Obligations”, provides guidance to actuaries in selecting economicassumptions for measuring obligations under defined benefit plans and was revised in September2013. The revised standard now requires that each economic assumption selected by the actuaryshould be reasonable which means it has the following characteristics: It is appropriate for the purpose of the measurement;It reflects the actuary’s professional judgment;It takes into account historical and current economic data that is relevant as of themeasurement date;It reflects the actuary’s estimate of future experience, the actuary’s observation of theestimates inherent in market data, or a combination thereof; andIt has no significant bias (i.e., it is not significantly optimistic or pessimistic), except whenprovisions for adverse deviation or plan provisions that are difficult to measure are includedand disclosed, or when alternative assumptions are used for the assessment of risk.Each economic assumption should individually satisfy this standard. Furthermore, with respect toany particular valuation, each economic assumption should be consistent with every othereconomic assumption over the measurement period.In conjunction with the June 30, 2018 valuation we reviewed the System’s economic assumptionsand recommended changes. Those changes were adopted by the Board on May 15, 2019. We haveupdated our analysis of the System’s economic assumptions but recommend no further revisionsat this time.In our opinion, the economic assumptions recommended in this report have been developed inaccordance with ASOP No. 27, as revised in September, 2013. The following table shows ourrecommendation followed by detailed discussions of each assumption.Page 4
ItemCurrentProposedPrice Inflation2.50%2.50%Real Rate of Return4.754.75Investment Return7.25%7.25%Price Inflation2.50%2.50%Real Wage Growth0.50%0.50%Wage Inflation3.00%3.00%Price InflationBackground: Assumed price inflation is used as the basis for both the investment returnassumption and the wage inflation assumption. These latter two assumptions will be discussed indetail in the following sections.It is important that the price inflation assumption be consistently applied throughout the economicassumptions utilized in an actuarial valuation. This is called for in ASOP No. 27 and is alsorequired to meet the parameters for determining pension liabilities and expenses underGovernmental Accounting Standards Board (GASB) Statements No. 67 and 68.The current price inflation assumption is 2.50% per year.Past Experience: The Consumer Price Index, US City Average, All Urban Consumers, CPI (U),has been used as the basis for reviewing historical levels of price inflation. The level of that indexin June of each of the last 50 years is provided in Appendix A.In analyzing this data, annual rates of inflation have been determined by measuring the compoundgrowth rate of the CPI (U) over various time periods. The results are as follows:Page 5
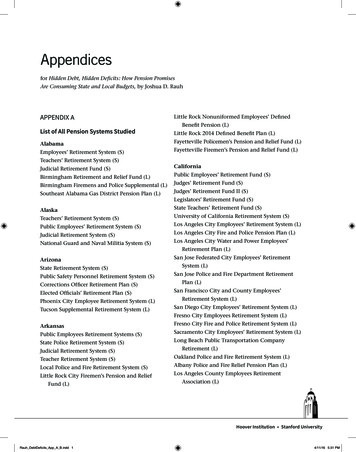
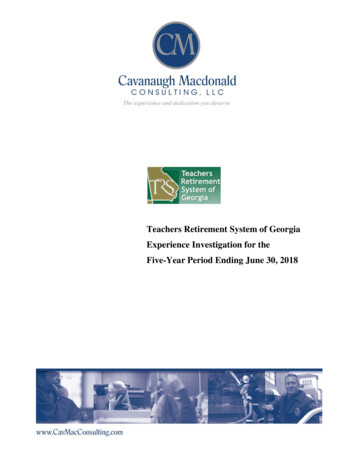
Period(Fiscal YearsEnding)2009-2018Number ofYearsInflationAnnualStandard 442.841969-2018504.042.991927-2018922.914.08The graph below shows the annual increases in the CPI (U) over the 50-year period (1969-2018)compared to the 2.50% currently assumed.Annual CPI(U) Rates of Increase by Fiscal 9901994199820022006201020142018-4%CPI-U2.50%Page 6
Over shorter historical periods, the average annual rate of increase in the CPI-U has been below3.00%. The period of high inflation from 1973 to 1982 has a significant impact on the averagesover periods which include these rates. Further, the average rate of 2.91% over the entire 92-yearperiod is higher than the average rate of 2.56% for the prior 30 years (1989 to 2018) but, moreimportantly, the volatility of the annual rates in the more recent years has been markedly lower asindicated by the significantly lower annual standard deviations. Many experts attribute the loweraverage annual rates and lower volatility to the increased efforts of the Federal Reserve since theearly 1980’s to stabilize price inflation. In our judgement, the post-1981 period of inflation is amore meaningful representation of historical price inflation than longer-term measures. The severerecession of 2007-2009 resulted in a short period of deflation followed by low levels of inflation.Although the quantitative easing program has ended, the Federal Reserve has disclosed an inflationtarget of 2.0% which has been higher than the post-recession average rate of inflation of 1.74% asmeasured from the CPI-U by fiscal years.The bond market’s measure of expected inflation is shown by the spread between the nominalyield on U.S. government bonds and Treasury Inflation Protected Securities (TIPS) of the samematurity. As of June 30, 2018, the spread at 10, 20 and 30 year maturities were all around 2.10%which is called the breakeven rate of inflation.Recommendation: Although the 10-year average price inflation rate of 1.42% is significantlylower than the System’s assumed rate of 2.50%, the longer 30-year average rate of 2.56% isslightly higher than the System’s assumed rate. We rely more heavily on longer-term historicaldata and note that both the Fed’s inflation target and the Bond market’s expectation are higher thanthe short-term historical rates.An additional reliable source of expected rates of inflation, the 2019 OASDI Trustees Report, theChief Actuary for Social Security bases the 75-year cost projections on an intermediate inflationassumption of 2.6% with a range from 2.0% to 3.2%. We consider that range to be reasonable andrecommend that TRS maintains the current price inflation rate assumption of 2.50%.Rate of Price Inflation AssumptionCurrent Assumption2.50%Recommended Assumption2.50%Page 7
Investment Rate of ReturnBackground: The assumed investment return is one of the most significant assumptions in theannual actuarial valuation process as it is used to discount the expected benefit payments for allactive, inactive and retired members of the System. Minor changes in this assumption can have amajor impact on valuation results. The investment return assumption should reflect the assetallocation target for the funds set by the Board of Trustees.The current assumption is 7.25%, consisting of a price inflation assumption of 2.50% and a realrate of return assumption of 4.75%. The return is net of investment expenses.Past Experience: The assets for the System are valued using a widely accepted asset-smoothingmethodology (5-year smoothing) that fully recognizes the expected investment income and alsorecognizes 20% of each year’s investment gain or loss (the difference between actual andexpected investment income). The asset smoothing methodology from 2010 to 2012 was basedon 7-year smoothing and actuarial value was set equal to market value in 2013. The recentexperience over the last five years is shown in the table uarial ValueMarket 0%8.60%The impact of the asset smoothing method can be observed in the table. Although the averagereturns over the five-year period are very close, the return on actuarial value is, as expected, lessvariable. We also note, as provided by the guidance of the Actuarial Standards of Practice (ASOP),that historical returns over a short time period are not credible for the purpose of setting the longterm assumed future rate of return.We next include in our analysis information concerning future expectations for the investmentreturn assumption. We prefer to base our investment return assumption largely on the capitalmarket assumptions utilized by the Board in setting investment policy and the System’s assetallocation. The investment rate of return assumption has two component parts: the rate of priceinflation and the real rate of investment return. This component approach is referred to as thebuilding block method in ASOP No. 27. The price inflation component was discussed previouslyin this report, therefore, this section will focus on the real rate of investment return component.Page 8
Analysis: The current capital market assumptions and asset allocation as provided by the Systeminvestment staff are shown in Appendix B. We further assumed that investment returnsapproximately follow a lognormal distribution with no correlation between years. The resultsbelow provide an expected range of real rates of return over up to a 50-year time horizon. Lookingat one year results produces an expected real return of 6.4% but also has a high standard deviationor measurement of volatility. By expanding the time horizon, the compound average returnapproaches the expected median of future real returns and the volatility declines significantly.The following table provides a summary of results. The geometric real rates of return are net ofinvestment expenses.TimeSpanInYears1510203050Real Returns by .6%7.2%6.8%30.2%15.9%12.8%10.6%9.6%8.7%Based on this analysis the median (50th percentile) real rate of return over a 50-year period is5.5%. It can also be anticipated that for the 10-year time span, 50% of the expected compoundaverage real rates of return were between 2.7%% and 8.4%. As the time span increases, thisspread begins to narrow. Over a 50-year time span, the analysis indicates there is a 25% likelihoodthat real returns will average below 4.2% and a 25% likelihood they will be above 6.8%. In otherwords, 50% of the distribution of expected compound average real returns will be between 4.2%and 6.8 %.Using the building block approach of ASOP No. 27 and the projection results outlined above, wehave determined a range for the investment return assumption of the 25th to 75th percentile realreturns over the 50-year time span plus the recommended inflation assumption. The followingtable details the range.25th Percentile50th Percentile75th PercentileReal Rate of Return*4.20%5.50%6.80%Inflation2.502.502.50Net Investment Return6.70%8.00%9.30%Item* net of investment expensesPage 9
Based on the capital market assumptions provided by the System’s investment experts, the medianexpected compound average return is 8.0% over a 50-year period. The current 7.25% assumed rateof return is approximately the 35th percentile of the distribution of expected average rate of returnsover a 50-year period. Although not in the center of the recommended range, in our opinion areturn of 7.25% is a reasonable expectation with a sufficient margin to account for adverseexperience. It should be noted that the capital market assumptions of investment professionals willvary from year to year and can differ substantially from investment professional to investmentprofessional. Different market expectations could impact the development of a recommendedassumptions.For a broader view of expected returns, we also reviewed the 2018 Survey of Capital MarketAssumptions produced by Horizon Actuarial Services, LLC to see what other investmentprofessionals are currently using for capital market assumptions. The Horizon survey includes both10-year horizon and 20-year horizon capital market assumptions of several investment consultants.Using the Board’s current target asset allocation, we applied the same statistical analysis to thesesurvey results as we did the capital market assumption of the investment staff with the followingresults for the 20-year horizon:TimeSpanInYears1510203050Real Returns by .3%5.9%5.6%25.9%13.6%10.8%8.9%8.1%7.3%Again, using the building block approach and the Horizon projection results, the following showsthe range for the investment return assumptions.25th Percentile50th Percentile75th PercentileReal Rate of Return3.35%4.47%5.61%Inflation2.502.502.50Net Investment Return5.85%6.97%8.11%ItemPage 10
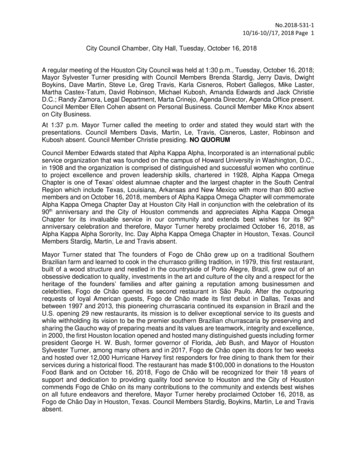
Using this basis, the 7.25% is slightly above the median expected return over a 50-year period.We prefer the use of the capital market assumptions of the Board’s investment professionals overthe assumptions from a survey of several consultants which do not serve the Board since the surveyassumptions were not the basis for the asset allocation decisions of the Board. By the guidance ofthe actuarial standards, we maintain a long-term perspective in setting all assumptions, especiallythe investment return assumption.In the course of constructing an investment return assumption, while we don’t develop therecommended investment rate of return based on those used by your peers, we also consider therange of assumptions used by other large public retirement systems. The graph below is from arecent Public Fund Survey, note that the current median return assumptions for the approximately125 large public plans in the survey is 7.25%. Further, note that the trend in the return assumptionsof these large plans is toward lower assumed rates of return.Page 11
Recommendation:remain at 7.25%.We are recommending that the long-term investment return assumptionInvestment Return AssumptionCurrentRecommendedReal Rate of Return*4.75%4.75%Inflation2.502.50Net Investment Return7.25%7.25%* net of investment expensesPage 12
Wage InflationBackground: The assumed future increases in salaries consist of a wage inflation component anda component for promotion and longevity, often called merit increases. Wage inflation normallyconsists of price inflation and a component for real wage growth which reflects the overall returnon labor in the economy. Merit increases are generally age and or service related, and will bediscussed in the demographic assumption section of the report.The current wage inflation assumption is 3.00% and is composed of a 2.50% rate of inflationassumption and a 0.50% real rate of wage inflation.Past Experience: The Social Security Administration publishes data on wage growth in the UnitedStates. Appendix C shows the last 50 calendar years’ data. We provide the rates of wage inflationand a comparison with the rates of price inflation over various calendar year time periods in thetable below. We remove the rate of price inflation for each calendar year for the data to result inthe historical real rate of wage inflation.Period(Calendar YearsEnding)2009-2018Numberof YearsWage InflationPrice InflationReal 18504.573.990.58As the analysis of the national wage growth data shows, the shorter-term historical average realrate of wage inflation (0.55% for latest 10 year period) is slightly less than the longer-term averagereal rate (0.58% over 50 years). The rate of real wage inflation over the prior 20 and 30 yearperiods is 0.84% and 0.88% respectively.The apparent annual real wage growth rate experience of TRS during the experience study periodaveraged a 1.07% above inflation compared to the real growth in the national average wages of1.53%. The 5-year historical period is not materially relevant for setting this assumption but it isimportant that the System’s experienced lower rates of increase than reflected nationally.Page 13
Recommendation:Based on the apparent real wage growth from the actual wage data andconsistent with the longer term real growth in the national average wage data, we recommend nochange to the current assumed rate of real wage growth of 0.50% per year.Wage Inflation AssumptionCurrentPrice InflationReal Wage GrowthWage yroll Growth Assumption: The current amortization method is level percent of payroll whichrequires the use of an assumed rate of annual payroll growth. This assumption typically rangesfrom the rate of inflation (2.50%) to the rate of wage inflation (3.00%). We recommend continueduse of the current 3.00% payroll growth assumption.Page 14
Section IVDemographic AssumptionsThere are several demographic assumptions used in the actuarial valuations performed for theTeachers Retirement System of Georgia. They are: Rates of WithdrawalRates of Disability RetirementRates of Service RetirementRate of MortalityRates of Salary IncreaseThe Actuarial Standards Board has issued Actuarial Standard of Practice (ASOP) No. 35,“Selection of Demographic and Other Noneconomic Assumptions for Measuring PensionObligations”, which provides guidance to actuaries in selecting demographic assumptions formeasuring obligations under defined benefit plans. In our opinion, the demographic assumptionsrecommended in this report have been developed in accordance with ASOP No. 35.The purpose of a study of demographic experience is to compare what actually happened to themembership during the study period (July 1, 2013, through June 30, 2018) with what was expectedto happen based on the assumptions used in the last five actuarial valuations.Detailed tabulations by age, service and/or gender are performed over the entire study period.These tabulations look at all active and retired members during the period as well as separatelyannotating those who experience a demographic event, also referred to as a decrement. In additionthe tabulation of all members together with the current assumptions permits the calculation of thenumber of expected decrements during the study period.If the actual experience differs significantly from the overall expected results, or if the pattern ofactual decrements, or rates of decrement, by age, gender, or service does not follow the expectedpattern, new assumptions are recommended. Recommended changes usually do not follow theexact actual experience during the observation period. Judgment is required to extrapolate futureexperience from past trends and current member behavior.The remainder of this section presents the results of the demographic study. We have preparedtables that show a comparison of the actual and expected decrements and the overall ratio of actualto expected results (A/E Ratios) under the current assumptions. If a change is being proposed, therevised A/E Ratios are shown as well. Salary adjustments, other than the economic assumptionfor wage inflation discussed in the previous section, are treated as demographic assumptions.Page 15
RATES OF WITHDRAWALCOMPARISON OF ACTUAL AND EXPECTED WITHDRAWALSFROM ACTIVE SERVICENUMBER OF WITHDRAWALSMALECENTRALAGEOF GROUPActualExpectedFEMALERatio ofActual toExpectedActualExpectedRatio ofActual toExpectedWithdrawals with less than 5 years
Teachers Retirement System of Georgia Suite 100, Two Northside 75 Atlanta, GA 30318 Members of the Board: We aresed plea to submit the results of an investigation of the economic and demographic experience for the Teachers Retirement System of Georgia. The investigation has been made in