Transcription
NRG: A Network Perspective on Applications’ PerformanceNoa ZilbermanAndrew W MooreBilly CooperUniversity of OxfordUniversity of CambridgeUnaffiliatedJackson WoodruffYuta TokusashiPietro BressanaUniversity of EdinburghUniversity of CambridgeUniversitá della Svizzera italianaMurali RamanujamDiana Andreea PopescuSalvator GaleaUCLAUniversity of CambridgeUniversity of CambridgeAbstract—Running an application in a data center, users havean important goal: performance. Even though mismatched application requirements and network resource assignments can leadto significant performance loss, the understanding of dynamicnetworking effects on data center applications’ performance isstill limited. In this paper we present NRG, an open sourcetoolset that enables reproducible experimentation and providesa networking perspective on applications’ performance. NRG isa portable and programmable solution operating at line rate,and enabling users to recreate data center network conditionsas a black box within controlled, small-scale experimentationenvironments. We demonstrate the potential of NRG to solveperformance issues and provide insights on several applications.Index Terms—Reproducibility, Data Center, PerformanceI. I NTRODUCTIONCloud computing is an appealing environment for manyusers: it is relatively cheap, does not require maintenance bythe user, promises availability, and provides performance thatis better than most users can achieve on their local systems.The data centers enabling these cloud environments are drivenby performance and cost, trying to appeal to end users andaspects of application performance within data centers havebeen extensively studied (e.g., [1], [2]).Network performance within the data center can be definedin many different ways: one application may target throughputas a performance metric, while another might prefer tail latency as the main performance goal. But the mapping betweennetwork performance metrics and application performancemetrics such as cost, power efficiency, and task completiontime is often not clear.In this paper, we assert that improving application performance requires understanding application interaction with theunderlying infrastructure, and as is the focus of this work:the network. Without understanding which applications arenetwork intensive and which are network agnostic, data centerresource allocation cannot be optimal. A mismatch betweenapplication requirements and network resources can lead toreduced application performance and affect resource utilization [3]. Unfortunately, the data center network is a black box,obscured from the user, and it is hard to infer the network’seffects on an application, let alone in a reproducible manner.978-3-903176-40-9 2021 IFIPSmall-scale experiments can provide the observability andreproducibility required, but lack realistic data center networkconditions, meaning performance can remain a mystery.We introduce NRG, a Network Research Gadget (pronounced en-er-gy). NRG enables reproducible networkingexperimentation through network emulation and monitoring— recreating realistic data center network conditions in smallscale environments. NRG is an open-source hardware-softwaretoolset with bandwidth and nanosecond-scale latency andjitter control, providing a black box representation of a datacenter network. NRG also provides a programmable, hardwareaccelerated, line-rate monitoring frameworks that offloads information processing from the end-host to the network andalleviates the need for frequent network probing. NRG canbe either standalone or a core within a network device. Weprototype NRG on NetFPGA SUME [4], port it to two moreFPGA platforms, and partially to Intel Tofino ASIC.We use NRG to generate Network Profiles, the combinationof an application’s performance and the characteristics ofthe underlying network. NRG considers high-level applicationperformance metrics (e.g., queries per second) over networkperformance metrics (e.g., flow completion time), allowingdirect understanding of how network configuration affects application performance. Using two case studies, we demonstratethat network profiles unveil application performance problemsand enable better network provisioning.In summary, this paper makes the following contributions: We introduce NRG, a hardware-software toolset for reproducible networking research. We introduce the concept of Network Profiles to characterizean application’s performance based on network characteristics,and a generation methodology using NRG. We describe a case-study using NRG to understand theperformance of four typical data center applications. We describe a case-study using NRG to debug users’ performance issues, and show the importance of the nanosecondand microsecond scale monitoring enabled by NRG.II. M OTIVATIONDetermining the best provision for a cloud application canbe challenging. Cloud computing provides compute resourcechoices, from the type of virtual machine (VM) to the CPU.
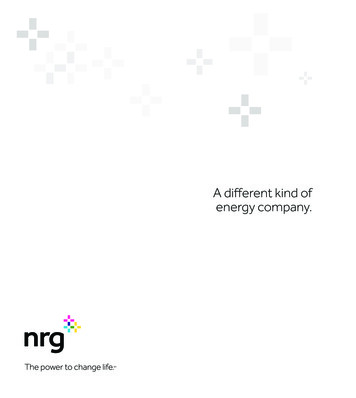
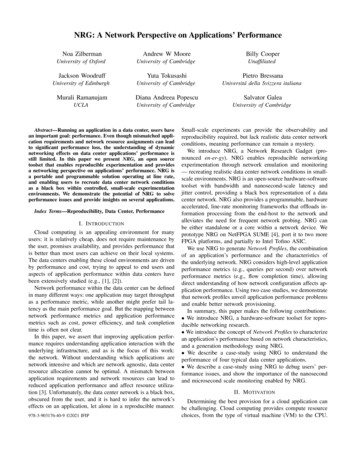
0.90.80.70.6MemcachedApacheSpark GLM(a) Local bare-metaliPerfNormalized Performance1.00.51.11.1Normalized PerformanceNormalized MemcachedApacheSpark GLM(b) Local VMiPerfMemcachedApacheSpark GLMiPerf(c) Cloud VMFig. 1: Normalized performance for applications operating on (a) bare-metal local machines, (b) within a VM on an otherwisequiescent local machine, and (c) within a VM in the cloud.Networking resource selection is limited, and CPU or VMclass often dictates available bandwidth and sometimes latency. Even if an application’s network properties are known,it is hard to infer the optimum choice of cloud resources.Once a cloud application is deployed, it is difficult to assessthe weight of different factors on the overall application’s performance. If a change in an application’s code unintentionallyaffects performance, it is hard to find and debug it, even if theeffect is at the scale of tens of percentages.To illustrate the challenge, we compare applications’ performance in three different environments: a local (self-controlled)data center, VMs within local data center, and a cloud environment (Azure). In each experiment we set two machines,e.g., one as a client and one as a server, and run an applicationbenchmark 100 times. There are no other running workloads orcross traffic in the local data center experiments. In the cloudenvironment, the VMs are set within the same data center.The applications we choose are Memcached (key-value store),Apache (web server), Spark GLM (machine learning) and iperf(throughput test). The applications are further described in ourartifact [5]. Figure 1 illustrates the performance variance perapplication, where the performance metric varies between applications (e.g., training time, requests/second). The maximumperformance achieved is normalized as 1.0, and the change inperformance is over 100 runs.As Figure 1 shows, the differences between running on alocal machine, either (a) on bare-metal or (b) on a VM, and(c) in a cloud environment are large. Locally, the differencesbetween the 25th and 75th percentiles are negligible forMemcached, Apache and iperf, and around 2% for Spark. Incontrast, in the cloud environment, there can be over 20%difference in performance between runs, and between the25th and 75th percentiles the differences in performance canreach 8%. These results demonstrate clearly that it is hard tobenchmark performance improvement of cloud applications,and to validate performance-related code changes.Our experiment does not show that the network is the causeof variance. It does demonstrate, however, the difficulty ofrunning reproducible experimentation in the cloud, especiallywhere the goal is applications’ performance benchmarking.Any approach to reproduction of a system exists on aspectrum of precision, accuracy, repeatability, correctness andso-forth. Balancing these allows many choices, from simulator to simplified test, and from emulation to a completeenvironment. Emulation environments such as Mininet [6]offer many desirable properties, but trade-in functionality withperformance and complexity. Simulators such as ns-2 and ns3, enable repeatability in results, yet have known drawbacks:often limited in completeness, unconstrained by CPU or memory usage in the same way an actual implementation wouldbe, and bounded by extremely long simulation times.Software-based emulation tools such as DummyNet [7]and NetEm [8] fail to emulate the network both at highdata rates and at microsecond-level latency [9]. To illustratethrough an experiment, in Figure 2 we measure the accuracyof microsecond-scale delay imposed by NetEm and NRG ona packet, using the setup described in §V-B and in [5]. As thefigure shows, the delay error (y-axis) increases as latency (xaxis) decreases. For 1µs delay, the median latency imposed byNetEm may be up to five times higher than requested. In contrast, NRG provides nanosecond-scale precision. Microsecondscale latency is increasingly important in data centers [2], withVM-to-VM latency being on few microseconds scale. Giventhe sensitivity of applications to microsecond scale latency [3],we need to be able to emulate network latency, using higherresolution and precision than provided by software emulation.In NRG, we focus on a subset of these challenges. NRGprovides a realistic local evaluation environment that can provide each and every time the same (network) test conditions.Coupled with that, NRG also provides an emulation of thedata center network as a “black box”, in terms of latency andbandwidth. NRG provides nanosecond-resolution control overlatency combined with support of line-rate traffic. The datarate supported by NRG is the same as an instantiated networkdevice (NIC, switch or bump-in-the-wire), and seamlesslyscales with it. By changing configuration seeds, NRG enablescreating similar-but-not-identical scenarios, yet still repeatable,enabling users to explore a wider range of “what can gowrong” scenarios. Beyond that, NRG depends on the user’snetwork and not on the user’s hosts, and is not constrained byCPU resource limitations.
105NetEm-Iperf3-10GMea ured Delay Error perf3-1G10310210110010 110 210 3100101Requested Delay (u )102Fig. 2: The measured error of median delay under variousloads, using NetEm and NRG. NetEm introduces up to 500%error for a microsecond delay, whereas NRG error is twoorders of magnitude smaller, in the order of erverNRGFig. 3: A cloud-based black box experimentation model. NRGreplaces part or all of the network black box.III. N ETWORK P ROFILESSmall network changes may produce large performancechanges. Network Profiles refer to a collection of networkrelated characteristics and their relation to an application’sperformance. Network profiles are designed for users with anapplication to deploy and a given system setup (e.g., servers,NICs, operating system) but who wish to know: Is my application bottlenecked by the network? Is the network well utilized? Can network changes improve applications’ performance?NRG allows to run on a local setup experiments that activelychange network conditions (bandwidth, latency, burst size) andpassively collect network statistics (e.g., inter-packet gap, linkutilization, flow size). This collection of network conditionsand statistics is the Network Profile of an application on agiven setup.While the uncontrolled black box cloud network behaviorcannot be predicted, it can be measured [10], [11]. NRGcan use these measurements to reproduce the cloud’s networkbehavior, by recreating similar latency (nanosecond-scale),bandwidth (Mbps resolution) and burstiness (byte-scale) scenarios. The operational model of NRG is the substitution ofan uncontrolled cloud-based black box experimentation modelwith a local user setup incorporating NRG, as shown in Figure 3. NRG can act as a bump in the wire or as a transparentmodule within a NIC or switch. Wherever NRG is instantiated,it can programmatically limit available bandwidth and increaselatency for a given link. This, when combined with otherconfiguration parameters for network: e.g., link MTU, andapplication: e.g., process and thread configuration, results inperformance measurements along a multidimensional surfacerepresenting the relationship between performance and thecontrol parameters.Figure 4 illustrates network profiles in 3D for a number ofapplications; for a given configuration, it illustrates the relationship between bandwidth and static latency on applicationperformance. This case study is discussed in § VII.IV. NRG A RCHITECTURENRG is a hardware/software toolset permitting fine-grainedcontrol and measurement of network characteristics for reproducible networked-systems research. NRG works in a controlled experimentation environment. NRG combines a set ofproperties required for reproducible experimentation: A software module for experiment orchestration, configuration and control of multiple nodes in a system. A hardware module, emulating the network black box, onnanosecond resolution and at line rate. A hardware module, monitoring the network and processingcollected information at line rate. A software module, collecting results from all nodes andhardware modules, and generating network profiles.An experiment begins by configuring a set of NRG-enableddevices within a networked-system. Once the setup is ready,the NRG’s orchestration module triggers the experiment. Atthe end of the experiment, the application’s results are collected. Monitoring information is also collected from thesystem and from NRG-enabled devices. Last, the collectedinformation is processed and network profiles are generated.Control and Orchestration: NRG targets networked systemsof multiple nodes (servers) and allows multiple NRG devices.A single control and orchestration node sets experiments on allthe participating nodes, by installing applications and settingsystem configurations. The same node sets up other NRGenabled devices, including platform configuration and loadingsoftware modules.Network Emulation: Network emulation is an in-band component of NRG. It can be a stand-alone bump-in-the-wire device, or part of a more complex device (e.g., switch).Figure 5illustrates a typical NRG-enabled device’s architecture. Thein-band network emulation module provides latency control(delay module), and bandwidth and burstiness control (ratecontrol module). The emulation module is instantiated afterthe data-plane enabling fine-grain functionality, e.g., applyingdelay to specific flows indicated by the data plane. Thedelay module inserts latency either as a constant, or froma distribution. Constant latency is equivalent to adapting thedistance between machines. Latency distributions describe acombination of static and variable latency, using either customor pre-defined distributions (e.g., uniform, normal, pareto andpareto-normal). Delay granularity is on a nanosecond timescale and depends on the target platform.
0200 400Latency 600(us) 80010001.00.8Normalized PerformancNormalized Performance0.60.60.40.4320 ConnectionsNormalized Performance1.00.8e1.00.80.60.40.20.20.20.0108 9 ps )76 Gb5 h(4 ndwit32 Ba0.0108 9 ps )76 Gb5 h(4 ndwit32 Ba0.0108 ps )6 (Gb4 withdn2 Ba0200 400Latency 600(us) 8001000(a) TensorFlow(b) Apache80 Connections0200 400Latency 600(us) 8001000(c) MemcachedFig. 4: Normalized performance of several applications when subject to a range of constrained bandwidths and static latencies.Experiments for these figures are discussed in § serDefinedControl PlaneFig. 5: An illustration of NRG hardware architecture. Dataplane and control plane connections are omitted for brevity.Network Monitoring: NRG uses hardware acceleration toprovide network insights with no host processing. NRG’smonitoring is passive, instantiated in parallel to the data plane.The module monitors properties such as link utilization, interpacket gap, user defined statistics and more. The module istriggered at the beginning of an experiment, and logs statisticsonly upon events, avoiding unnecessary resource consumption.Instead of saving individual counters, NRG automaticallygenerates (probability) distributions of monitored events. Thekey insight for the distribution generation is; for most researchand monitoring purposes, some accuracy can be sacrificedthrough binning to achieve feasibility.Data Collection and Processing: At the end of an experiment,a software module collects instrumentation information fromall nodes to a create network profile. This includes performance results from end hosts, statistics from NRG, etc. It alsocollects reproducibility data about the system under test. Themodule’s second role is processing results aggregated acrossexperiments, e.g., across a range of latencies. The data fromthe monitoring module can present insights, e.g., throughputas a function of burst size.A. Network Emulation ArchitectureNRG’s network emulation is divided between latency andrate control. Latency control is designed as a queue (FIFO)with a release mechanism. Every packet that enters NRGis timestamped (t), and assigned a delay d. The delay d iscomposed of a static latency component and a random latencycomponent, chosen from a (programmed) latency distribution.The packet is released from the queue whenever the currenttime is bigger than t d.To support variable latency, NRG uses small on-chip memories (1K-8K entries) that store distributions, and a pseudorandom bit sequence (PRBS) generator that points to randomaddresses within the memories. The depth of the memorydetermines the granularity of the distribution. The distribution memory can be populated by the user, or a predefineddistribution can be selected. While the memories define theshape of the latency distribution, the scale of the distributionis defined through a multiplier configuration.NRG’s queue design does not enable reordering, similarto packets traversing through an identical path. Reorderingis possible between packets of different flows, where somepackets go through the delay module while others don’t.Rate control is a common function in network devices. NRGimplements it as a FIFO (queue) with a release mechanismwhich dictates both bandwidth and burst size. The module isprimarily designed to imitate a lower-speed link. As such, iteffectively reduces the progression speed through the pipeline,and works on bus-width (byte) level granularity. Typically, therate control module will be located after the latency module,and use a FIFO that is an order of magnitude smaller thanthe latency queue. Propagating flow control allows to accountfor queueing effects within the rate control module whendischarging packets in the latency module.V. NRG I MPLEMENTATIONThe NRG implementation is open source, available at [5].It was prototyped on multiple FPGA platforms, and is opento community contributions. Already, NRG has been used inseveral projects (§VI), and has proved portable and useful.The implementations described below are the ones releasedwith this project, but users can easily adapt the tool to theirenvironment and needs. We explore in §V-D design portability.A. PrototypeThe control, orchestration and performance monitoring software components are implemented in Python, using C tointeract with the NRG. The prototype supports scripting environments, and a GUI for manual configuration and testing. Test
setup and application configuration are taken from files. Eachtest can sweep ranges of network parameters (e.g., latencyfrom 0 to 100µs in 1µs steps using jitter). Tests produce logsand generate performance graphs.NRG was first prototyped and evaluated on 4 10GENetFPGA SUME [4]. The platform allows 5ns latency controlresolution, and bandwidth of 1Mbps to 10Gbps per port.This is a standalone bump-in-the-wire design, supporting twoports (for maximum latency scalability). It does not changerelations between competing flows. The monitoring modulesupports monitoring per port, pattern match or of a flow.Multiple monitoring mini-blocks are implemented, such as linkutilization and packet rate, TCP window size and flow size.The monitoring module consumes few resources; just 0.62%of logic and 2.2% of memory resources.B. ValidationWe validate our NRG prototype’s functionality and performance using OSNT [12] as a traffic generator and CiscoNexus NIC HPT for packet capture, using an optical splitter.The latency accuracy of NRG is 30ns independent of theconfigured static latency, similar to a NetFPGA referencedesign. For latency distribution, we sweep the parametersof both distribution values, and scale of distribution (i.e.,from nanoseconds to hundreds of microseconds), and useKolmogorov-Smirnov to test fit, and visually compare expected and actual distributions. Rate control is validated fromzero to 10Gbps.Monitoring is evaluated using trace capture, comparing theproperties of captured traffic to NRG statistics. The accuracy iscapped by the level of data aggregation (e.g., 1ns, 1µs, 1ms).The validation shows that NRG works to its specification.It is not compared with a production data center network, noraims to fully recreate a data center environment.C. ProgrammabilityNRG enables drop-in custom monitoring mini-blocks. Theseare not language bound, and we have modules coded inVerilog, P4 and .NET. We used P4-NetFPGA [13] for a P4based implementation, including statistics such as bandwidth,packet size distribution, and inter-arrival time distribution. Ourimplementation of user statistics in .NET used Emu [14], forexample for monitoring packet reordering on a port and flowlevel, and for bandwidth statistics.NRG’s emulation active path, the delay and rate controlmodules, are implemented in Verilog. Such modules are lesssuitable for high-level languages (e.g., P4), except as externs.D. PortabilityFPGA: FPGA targets can operate as a bump-in-the-wire, asa NIC and as a limited-size switch. NRG was ported to twoFPGA targets: Xilinx VCU1525 (XCVU9P FPGA) and U280(XCU280 FPGA), each with 2 100G ports. Running on theseFPGA targets provides higher resolution than on NetFPGASUME (4ns vs. 5ns), more on-chip memory (35MB/41MBvs. 6.5MB) and different network interfaces (100G vs. 10G).SmartNIC: SmartNIC portability depends on the NIC’sarchitecture (ASIC, FPGA or SoC based). NRG can be fullyported to FPGA-based smartNICs. For other types, portabilitydepends on the level of programmability.Switches: We explored porting NRG’s monitoring to twoswitch ASICs: Barefoot Tofino and Broadcom Jericho 2. Ourobservations are based on coding (Tofino) and discussions withboth ASIC teams. In Tofino, the monitoring design could beported with some changes, e.g., using Tofino’s built-in externs,timestamp counter and registers. The Jericho 2 platform cansupport monitoring, but requires porting the code to C .Most high-end switches already support rate control with finegranularity. Latency control, on the other hand, is less feasible.E. ScalabilityMany NRG devices can be used within a system, andeach device is independent from the others. Device setup isasynchronous, and hardware mechanisms enable starting on atriggered event (e.g., first packet of a certain type), or on aconfiguration trigger. This assists in distributed systems anddoes not preclude synchronized operation.NRG also scales with data rate. Our 10G prototype and100G prototypes use similar libraries and can continue andscale with port rate. If we consider the monitoring functionality, NRG will process 150Mpps at the same ease that it processes 15Mpps. This is significantly different to the resourcesrequired by host-terminated monitoring application. Latencywise, while the number of packets NRG can buffer does notchange with data rate, if data rate increases, the maximallatency supported at full line rate decreases. Therefore, fasterport rates require deeper memories.VI. U SE C ASESNRG was developed for exploring, understanding and reproducing networked experiments. In this section, we describe afew potential use cases of NRG and network profiles.Reproducibility: NRG enables reproducible experiments,while varying network conditions and emulating a cloudnetwork as a black box. It enables a stable experimentalenvironment that recreates network conditions identically between experiments, and allows recreation of failure conditions.Latency distribution seeding allows reproducible creation of arange of congestion scenarios. NRG enables repeatable benchmarking and comparison of solutions. We envision an NRGenabled artifact evaluation environment, to test research artifacts prior to publication, and providing reliable performancecomparisons between solutions under different scenarios.Resource Allocation: Understanding distributed applicationperformance is hard. NRG enables studying the sensitivities ofapplications to bandwidth and latency through experimentationin controlled environments. Using network profiles, resourceallocation can be improved, such as the number of clients andtheir link capacity.Understanding and Debugging Applications’ Phenomena:Network Profiles provide a better understanding of applications’ performance, providing insights beyond a single resource. As we show in § VIII, when performance changes,
NRG enables debugging: is it due to congestion or highnetwork utilization? Has the burstiness changed? Is the network responsible at all, or was network behavior unchanged?Similarly, NRG enables a software development loop withnetwork-level application behavior.VII. C ASE S TUDY: E XPLORING THE E FFECTS OF THEN ETWORK ON P ERFORMANCEIt is known that bandwidth and bandwidth variability affectperformance [15], and that some applications are sensitive tosub-millisecond latency [3]. In this case study, we use NRGto explore in a reproducible manner how choices of networkresources affect the performance of different applications. Thisis done for a small-scale setup (24 cores), comparable with thedefault reserved instances quota in some cloud services [16].A. Setup and ApplicationsWe use an experimental setup [5] in our local data centercomposed of 6 hosts. Each host has an Intel Xeon E5-2637 v4CPU with four cores (24 total cores), running at 3.5GHz with64GB RAM. The hosts run Ubuntu Server 16.04, kernel version 4.4.0-131-generic, using default network configurations(e.g., TCP Cubic). Each host is equipped with an Intel X520NIC, connected at 10Gbps to an Arista 7124FX switch. Themedian round-trip time (RTT) between clients and server is10µs, and only one workload is running at a time (no othercross-traffic). We use one host as a server and five as clientmachines, and instantiate an NRG device between the serverand the switch, acting as a port-level bump-in-the-wire.We use several popular applications. Their choice exploresincreasing application complexity and a number of operatingmodels. We overtly prefer network intensive applications. Thesimplest application is a domain name server (DNS, measuredin requests per second). We also benchmark Apache webserver(measured in requests per second). We benchmark Memcached, a key-value store application, measured in queriesper second. As a workload, we use Facebook “ETC” [17].Last, we pick TensorFlow, a machine learning framework, anduse the MNIST dataset for training using distributed learning,measured with training time.We study the effect of bandwidth and static latency onapplication performance, varying these parameters between theserver and switch. In this way, we emulate a VM with differentbandwidth allocation and different data center location. Thisexperiment explores the effect of these parameters alone onthe end-to-end performance, and no other perturbations. Eachexperiment is run ten times. We generate a network profilefor each application, also containing the variance. Below, weexplore dependencies between application network presence(e.g., link utilization, packet size) and resource allocation.The scale of latency may vary significantly between cloudproviders, and over time. The latencies used in our experimentsmatch previous works [18]. We validated our latency scale inAzure (using AccelNet). We found [5] latencies on the orderof 128µs-173µs minimum latency and 300µs-500µs medianlatency (for different machines).Fig. 6: The effect of static latency on different applications.B. Experimental ResultsFigure 6 compares the effect of static latency on all fourapplications. The times indicate one-way latency and areapplied in both directions, similar to distancing a server froma switch. The switch-server bandwidth is 10Gbps. Memcachedis extremely sensitive to latency, losing 20% performance with25µs added, and 58% when 100µs are added. TensorFlowloses 2.5% performance with 25µs added, and 8.3% with100µs. At 500µs, or 1ms RTT, all applications lose between29% (Apache) and 90% (Memcached) performance. Whilesensitivity to latency is not new, these results show themagnitude of the effect even on very short timescale.Next, we vary both bandwidth and latency and explorethe performance effects (Figure 4). TensorFlow (Figure 4(a))is almost linearly sensitive to latency and bandwidth. Thereis little variability between experiments: 1.5% across allscenarios. We cannot determine whether TensorFlow is “moresensitive” to bandwidth or latency. However, we can say, forexample, that (on our setup) TensorFlow with 10G bandwidthand 100µs of added RTT, will perform slightly worse thanwhen allocated 9Gbps bandwidth and no added latency. Themonitored network properties (bandwidth utilization, packetrate, burst size and inter-packet gap) of TensorFlow on server’stransmit and receive side are similar. Other applications showsignificant differences between transmit and receive directions.One component of TensorFlow’s performance profile islink util
by performance and cost, trying to appeal to end users and aspects of application performance within data centers have been extensively studied (e.g., [1], [2]). Network performance within the data center can be defined in many different ways: one application may target throughput as a performance metric, while another might prefer tail la-