Transcription
RESEARCH ARTICLERegional Differences in HyoidMuscle Activity and LengthDynamics During MammalianHead ShakingSARAH E. WENTZEL1,2, NICOLAI KONOW1,3,1 AND REBECCA Z. GERMAN1Physical Medicine and Rehabilitation, Johns Hopkins University, Baltimore, MarylandDepartment of Orthodontics, University of Maryland, Baltimore, Maryland3Department of Ecology & Evolutionary Biology, Brown University, Providence, Rhode Island2ABSTRACTJ. Exp. Zool.313A, 2010The sternohyoid (SH) and geniohyoid (GH) are antagonist strap muscles that are active during anumber of different behaviors, including sucking, intraoral transport, swallowing, breathing, andextension/flexion of the neck. Because these muscles have served different functions through theevolutionary history of vertebrates, it is quite likely they will have complex patterns of electricalactivity and muscle fiber contraction. Different regions of the SH exhibit different contraction andactivity patterns during a swallow. We examined the dynamics of the SH and GH muscles duringan unrestrained, and vigorous head shaking behavior in an animal model of human head, neck, andhyolingual movement. A gentle touch to infant pig ears elicited a head shake of several revolutions.Using sonomicrometry and intramuscular EMG, we measured regional (within) muscle strain andactivity in SH and GH. We found that EMG was consistent across three regions (anterior, belly, andposterior) of each muscle. Changes in muscle length, however, were more complex. In the SH, midbelly length-change occurred out-of-phase with the anterior and posterior end regions, but with azero lag timing; the anterior region shortened before the posterior. In the GH, the anterior regionshortened before and out-of-phase with the mid-belly and posterior regions. Head shaking is arelatively simple reflex behavior, yet the underlying patterns of muscle length dynamics and EMGactivity are not. The regional complexity in SH and GH, similar to regionalization of SH duringswallowing, suggests that these anatomically simple hyoid strap muscles have more complexfunction than textbooks often suggest. J. Exp. Zool. 313A, 2010. & 2010 Wiley-Liss, Inc.How to cite this article: Wentzel SE, Konow N, German RZ. 2010. Regional differences inhyoid muscle activity and length dynamics during mammalian head shaking. J. Exp. Zool.313A:[page range].The supra- and infrahyoid musculatures are active during variousmammalian head and neck movements (Thompson, ’41; Brodie,’50; Doty and Bosma, ’56; Forsberg et al., ’85; Thexton et al., ’98,2007; Konow et al., 2010). Behaviors relying on this hyoidmusculature include suckling, drinking, eating, vomiting,breathing, and extension/flexion of the neck (Forsberg et al., ’85;van Lunteren et al., ’87a,b; Thexton et al., ’98; Lang et al., 2002).The evolutionary rationale for the form and function of the hyoidmusculature in mammals is that the tasks of these muscles are notones of strength, as is true of the muscles of mastication (Hiiemaeand Crompton, ’85). Their role is to move the hyoid precisely overshort distances. As such, these muscles are referred to as classicparallel fibered strap muscles (Hildebrand and Goslow, 2001).Grant Sponsor: NIHD; Grant number: C03604. Correspondence to: Rebecca Z. German, Physical Medicine andRehabilitation, Johns Hopkins University, Baltimore, MD 21231.E-mail: rzgerman@jhu.eduReceived 19 April 2010; Revised 10 September 2010; Accepted 3November 2010Published online in Wiley Online Library (wileyonlinelibrary.com).DOI: 10.1002/jez.655& 2010 WILEY-LISS, INC.
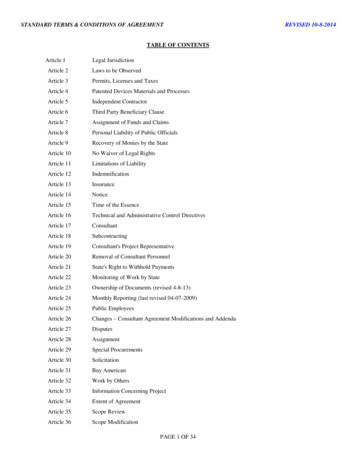
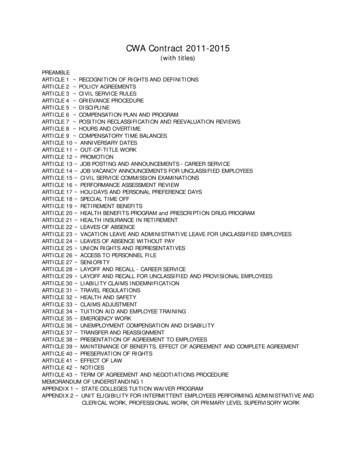
2Several muscles, in particular, sternohyoid (SH) and geniohyoid(GH), are antagonist strap muscles that are active during many ofthese movements and are important for moving and stabilizingthe hyoid bone. Yet, little is known about fascicle strainheterogeneity in the hyolaryngeal musculature, and specificallywhether the simple architecture of these muscles translates intohomogeneous patterns of activity and length change.Most studies of fascicle strain heterogeneity have examinedvertebrate limb muscles. For example, the turkey lateralgastrocnemius shows superficial to deep regional fascicle strainheterogeneity during ramp lengthening (Roberts and Azizi,2010), whereas the medial gastrocnemius in guinea fowl showsproximodistal fascicle strain heterogeneity during running(Higham and Biewener, 2008). Much of this work examinesmuscles that are biarticular and have pinnate fibers (Brainerd andAzizi, 2005; Azizi et al., 2008; Azizi and Roberts, 2009). Somenonpinnate muscles that have broad insertions, including thepigeon pectoralis, show complex fascicle strain heterogeneity(Soman et al., 2005). Here, heterogeneous fascicle strain over thecross-section of the muscle may be an anatomical avenue ofstreamlining the range of lengths across which the fasciclescontract. There are other highly parallel-fibred limb muscles withheterogeneous fascicle strain along their proximodistal axis, suchas the toad semimenbranosus (Ahn et al., 2003) and the humanbiceps brachii (Pappas et al., 2002).There are few examples of data on muscle fascicle strain fororopharyngeal or hyolaryngeal muscles (van Lunteren et al.,’87a,b, ’89; van Lunteren and Dick, 2000; Konow et al., 2010).van Lunteren et al. suggest that the relationship between musclelength and function is complex during respiration, particularly inGH and SH. They found the GH to be lengthening whileelectrically active.Recent work found that different regions of the SH havedifferent contraction patterns. The anterior, mid-belly, andposterior regions exhibit different contraction and lengtheningpatterns during a swallow (Konow et al., 2010). When lengthchange is measured for different regions within the same muscle,different regions (mid-belly vs. ends) change length at differenttimes. Furthermore, when infant pigs swallow, muscle activity inthe SH is most strongly correlated with shortening contraction ofthe mid-belly region. The mid-belly shortens more than the endregions, and this suggests that movements at the ends of themuscle are most likely influenced by antagonist muscles duringswallowing (Konow et al., 2010). The patterns of EMG activityand strain in the SH and GH, however, have not been analyzedduring other behaviors than swallowing.Here, we examine the dynamics of the SH and GH musclesduring a natural, unrestrained, and vigorous head shakingbehavior in an animal model of head, neck, and hyolingualmovement. Determining the muscle activity and length dynamicsrelationships during a cyclical, nonoral behavior that incorporatesall the hyoid musculature permits us to compare EMG activityJ. Exp. Zool.WENTZEL ET AL.and determine relationships of length changes within and amongmuscles. Whether the same regionalization exists in this behavioras during feeding behaviors is not known. Therefore, wemeasured SH and GH regional activity and length dynamics,(i.e. length changes), to test the hypothesis that muscle activityand muscle length dynamics (lengthening/shortening) would beequivalent in all three regions during head shakes. Specifically,our hypothesis was that, given the regional differences seen inthese muscles during feeding behaviors and respiration, therewould be differences or asynchrony between regional activityand length change in the SH and GH during a vigorous headshake, so that interregional activity and length changes wouldoccur asynchronously.MATERIALS AND METHODSAnimalsThe experiments were conducted at Johns Hopkins Universityand were approved under ACUC ]SW07M14. The subjects wereeight piglets from the Tom Morris Farm (Reisterstown, MD). Theirbody weights were 5–6 kg at an age of 10–16 days. Details aboutdata collection were given in (Konow et al., 2010) and themethods are, therefore, reviewed briefly here.Instrumentation of MusclesThe piglets were placed under anesthesia by 5% Isoflurane inhaledthrough a face mask. They were intubated, and aseptic conditionswere maintained through the surgery. The sternohyoid, genioglossus, geniohyoid, and thyrohyoid were carefully exposed usingblunt dissection (Sack, ’82). Only one muscle, the SH or GH, wasstudied for length dynamics per animal. Figure 1 shows the EMGelectrode and sonomicrometry crystal placements.We did two sets of parallel studies: the first set of fourexperimental animals (C, D, M, S), focused on the SH and thesecond set (T, U, V, W) on the GH. For each set, the focal musclewas divided into three areas—anterior, middle, and posterior—byfour 2 mm piezoelectric crystal (Sonometric Corp, London, ON).Between each pair of crystals, bipolar EMG patch electrodes wereattached to the muscle surface. The crystals were evenly spaced,approximately 17 mm apart (Fig. 1). The crystals emit ultrasoundenergy across the distance they are placed. Therefore, changes inlength can be recorded. For the first set of animals, bipolar patchEMG electrodes were attached to the surface of the SH musclebetween each pair of crystals (Loeb and Gans, ’86). In order toavoid any damaged muscle resulting from the crystal insertion,the electrodes were placed 3–4 mm away from the line of thecrystals (Fig. 1).We placed EMG electrodes in additional muscles that might beinvolved in the behaviors under study, or be antagonists to theSH or GH: the middle of the genioglossus, close to the origin ofthe TH, and the GH. EMG patch electrodes were placed on thesurface of the GH, between the three crystal pairs. These four
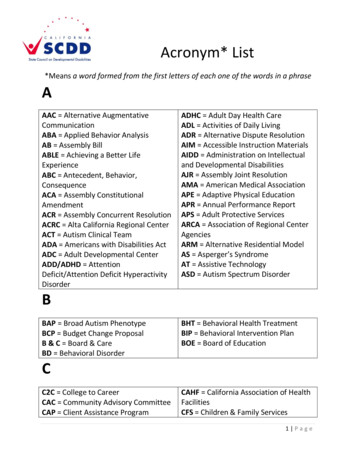
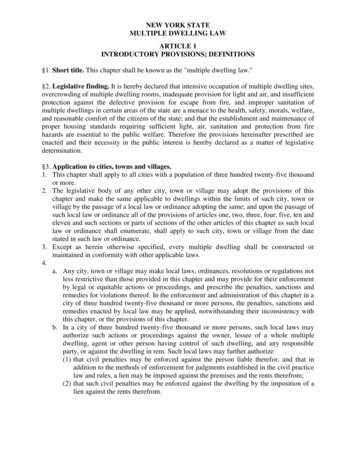
MAMMAL HYOID MUSCLE FUNCTION DURING HEAD SHAKESFigure 1. Ventral view of the supra- and infrahyoid musclesexamined. Four 2 mm piezoelectric crystals were placed on the leftaspect of the sternohyoid (SH), approximately 17 mm apart. Thefour crystals separated the SH into three regions: anterior, middle,and posterior. Bipolar EMG patch electrodes were attached to thesurface of the SH between each pair of crystals. A similarinstrumentation was used for the geniohyoid in the second set ofanimals.animals were additionally instrumented with fine wire bipolarelectrodes in the TH and SH (Fig. 1). Before surgery, thesonomicrometry crystals had a skin button connector attached(Sonomicrometrics, London, ON) and the electrode wires had amicroconnector attached (Glen-Air, Glendale, CA).Recording ProceduresThe wires from the crystals and electrodes exited out the ventralsurface of the neck through a submandibular incision. The extracutaneous wires were carefully folded and bandaged withVetwrap (3M, MN), and the connectors were sutured to thebandage. The piglets recovered from surgery within 3–5 hr, andwere fully alert and standing before feeding. Data was collectedover a 36–48 hr period, during which the pigs were fed and datawas recorded every 3–4 hr. We recorded length changes from thesonomicrometry crystals and EMG recordings from all theexperimental muscles (Fig. 2) for swallowing, suckling, vocalization, and head shaking.The piglet suckled from a baby bottle with a pig nipple (Nasco,Fort Atkinson, WI) while standing in a pet carrier. Several timesduring an experiment, we elicited a head shake by gentlybrushing inside one of the ears of the pig with a cotton swab. Thepig reliably responded with vigorous side-to-side lateral head3Figure 2. The principles of waveform cross-correlation analysis asused in this study. The cross-correlation function produces a lag, i.e.the relative timing cycles of two variables over time. If a wave fromone variable lines up in time with a wave of a second variable, thelag 5 0 and the activity is in synchrony. If there is a positive lag(A, C), the response vector (black line) must move in a positivedirection to the target vector (grey shading). The opposite occurs ina negative lag (B, D); the response vector moves in a negativedirection after to match the target vector. The r-value is thecorrelation between the two wave forms and measures the pairwise correlation between two waves at a given lag. The lag withthe highest r-value is the measure of the best fit of relative timingbetween the two waves. A negative r-value indicates an inversecorrelation of a given lag; the r-value sign indicates whether thewaves are in or out-of-phase with each other.movement. After the experimental period, the pigs were placed ina deep plane of inhalant anesthesia and euthanized withveterinary euthanasia solution (IC). A postmortem dissectionwas conducted to verify electrode and crystal position.A PC running Powerlab 16/30 recorded the data in LabChartv.6.1.3 (AD instruments, Colorado Springs, CO). The EMG signalswere amplified 1,000 times with a MA-300 EMG system (MotionLab Systems Inc, LA) and a high pass filter of 25 Hz was applied.The inputs to Powerlab, from the EMG amplifiers andsonomicrometer outputs, were digitized at 10 KHz. The sonomicrometer output was three crystal pair distances recorded at508 Hz with a transmit pulse of 220 msec and inhibit delay setbetween 2.2–2.6 mm to condition the signals.J. Exp. Zool.
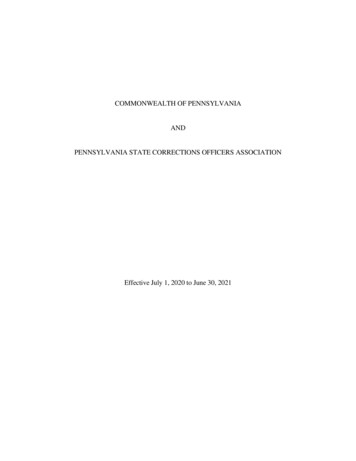
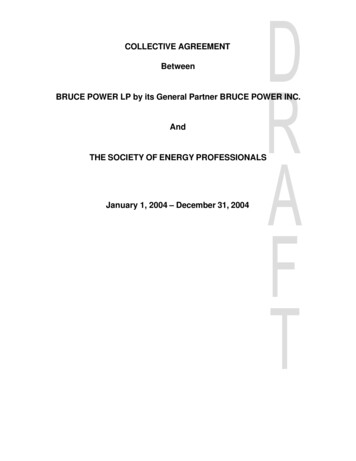
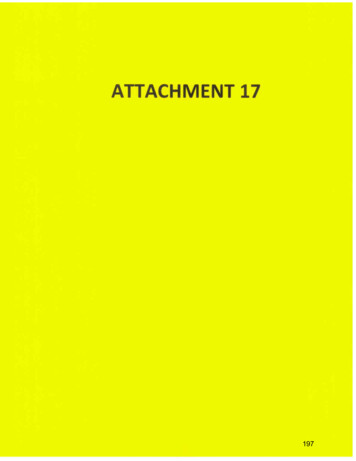
4Head Shake IdentificationData sequences were selected with clear shakes, containingseveral revolutions of the head. The quality of a sequence wasdetermined by the maximum number of channels recording datawithout artifacts or noise for all behaviors. From each datasequence, the head shakes were identified and found to becharacterized by several short cycles of EMG activity across allsix muscles and length changes in all the sonomicrometricchannels.The oscillations observed from the sonomicrometry crystaldata consisted of two to eight revolutions (Fig. 2A) in both the SHand GH, and lasted approximately 300–800 msec with simultaneous isolated bursts of EMG activity for SH, GH, genioglossus,and TH. Each set of shake oscillations was copied into a separatedata file and coded numerically. One hundred and fifty-two headshakes were compiled, 80 for the first four set of pigs,representing SH sonomicrometry data, and 72 for the secondset of pigs, representing the GH sonomicrometry data.Data ExtractionA script was coded in Matlab R2008a (v.7.6.0.3.2.4, TheMathworks, Natick, MA) to process the EMG signals (Germanet al., 2009). In brief, EMG signals were rectified and resetintegrated to a period of 10 msec, with the baseline noisesubtraction (Thexton et al., ’98). Sonomicrometer signals were leftunprocessed, other than a subsampling to 100 Hz to retainsynchronization with the processed EMG signals.In order to obtain a quantitative measurement and to evaluatesynchronization, a cross-correlation analysis was run for eachshake (Loeb et al., ’87; Wren et al., 2006; Thexton et al., 2009).The cross-correlation function (CCF) output provides two piecesof information. First, it measures the time relationship or lagbetween two sets of time series data (Fig. 2). If a wave from onevariable lines up in time with a wave of a second variable, thenthe lag 5 0 and the activity is in synchrony. If there is a positivelag, the response vector must move in a positive direction (to theright) relative to the target vector in order to align (Fig. 2A).The opposite occurs in a negative lag; the response vectormoves in a negative direction (to the left) to obtain peakcorrelation with the target vector. The second item the CCFindicates is if the vectors are in-phase or out-of-phase. Ther-value indicates the degree of correlation between the two waveforms; that is, the pair-wise correlation between two waves at agiven lag. A negative r-value indicates an inverse correlation(out-of-phase waveforms) at a given lag (Fig. 2C, D).StatisticsCross-correlation analyses were done in SYSTAT 12 (2009). Fromthis output, the lag with the strongest correlation was statisticallydetermined. All identification of shakes in LabCharts, dataextraction in Matlab, and assessment of shake quality were doneby one person (SEW). We carried out several subanalyses on theJ. Exp. Zool.WENTZEL ET AL.CCF results (also in Systat 12) to test our hypotheses. First, wetested if the lags among crystal pairs were different from zero,using a repeated measures linear model, including individual as afactor. Then, we tested if the lags among EMG electrodes weredifferent from zero, using repeated measures linear model,including individual as a factor. Lags with a negative correlationwere tested separately from lags with a positive correlation.Multiple comparisons included Bonferoni corrections.RESULTSGeneral BehaviorAnimals responded reliably and consistently to a brushing with acotton swab in their ear with vigorous head shaking. There wasregularity in the revolutions, i.e. the individual movements of eachshake, from midline to lateral, then contralateral and back tomidline (Fig. 3A). In the shake shown in Figure 3, an upward lineindicates lengthening of the muscle region. A downward lineoccurred when the muscle region was shortening. The bottom rowsshow the vigorous EMG activity during the head shaking behavior.SternohyoidThere were no differences in the timing of muscle length changebetween the anterior (hyoid) and middle region and between themiddle and posterior (sternal) region (Table 1). The majority ofthe correlations for these two comparisons were negative,indicating an out-of-phase relationship (Figs. 4A, 5A, C). Theaverage lag was zero, indicating that, on average, maximumshortening in one region occurred simultaneously with maximallengthening in another. However, the wide spread of values andhigh variation in the timing lags between these pairs of regionssuggests that either region could change length first, but thatone was shortening while the other was lengthening. Therelationship between anterior and posterior SH consistentlyreturned a positive correlation, with an average lag of 4.02 msec(Figs. 4B, 5B). Again, there is large variation in the lag, includingboth positive and negative lag values. The mean lag of 4.02 msecsuggests that length change in the anterior section tends to occurbefore the posterior (sternal) section.The timing of differences in EMG activity between each pairof regions was not statistically significant (Fig. 6), i.e. the lag wasnot statistically different from 0.0 (Table 1). When comparing theEMG activity between the SH and other muscles, we found smallbut significant lags between both SH and TH and SH and GG. Thelag between SH and GH was not statistically different from 0.0(Table 1; Fig. 7A).GeniohyoidThe timing of length change between the three pairs of regions inthe GH included a large number of both positively and negativelycorrelated relationships (Table 2; Fig. 8). Despite a large variationin lag values, there was some clustering of values. Approximately
MAMMAL HYOID MUSCLE FUNCTION DURING HEAD SHAKES5half of the anterior (mandibular) to middle distances had anegative relationship with no lag, but the other half had apositive relationship with a mean lag of 12.25 msec (Fig. 9A).The anterior to posterior (hyoid) relationship was generallypositive, with a significant lag of 6.37 msec (Fig. 9B). The middleto posterior relationship was largely negative, but with zero lag,and high variation around that lag (Fig. 9C). The CCFs for theEMG activity between all region pairs returned positive correlations and lags that were not different from zero (Fig. 10). The CCFfor EMG activity of GH relative to TH had a lag of 0.126 msecwith positive correlation, whereas the EMG of GH and SH had nolag and positive correlation (Table 2; Fig. 7B).Figure 3. Raw time series data for shakes. Top three rows showsternohyoid (SH) sonomicrometry waves for the anterior (hyoid),belly, and posterior (sternal) regions. EMG is shown below for thesame anterior (SHa) belly (SHb) and posterior (SHp) regions. Bottomfour rows show duplicate EMG signals for the geniohyoid (GH) andthe thyrohyoid (TH).Figure 4. Regional strain heterogeneity in the sternohyoid. (A) Thenegative correlation of middle to posterior regions. (B) Positivecorrelation of anterior to posterior regions, at a slight lag. Theanterior region lengthens slightly before the posterior region.Table 1. Results of t-tests for SH group.Regions CF 264Mean lag (msec)0.192.074.021.940.232.870.160.010.23SD .1220.007 0.2350.5400.078o0.001 0.82o0.001 Po0.05; Po0.001. H : mean lag 5 0.oJ. Exp. Zool.
6WENTZEL ET AL.Figure 5. Results from analyses of sternohyoid regional strain. Each regional comparison produced a lag when negatively ( 1) andpositively correlated (11). (A, C) The distribution of lags indicates that the origin insertion regions were negatively correlated (i.e. out-ofphase) and (B) from anterior to posterior, the regions are lengthening in-phase.Figure 6. Results from analysis of sternohyoid (SH) regional EMG.Comparisons are: Ant-mid, anteriormiddle (P 5 0.235); Ant-post,anterior–posterior (P 5 0.078); Mid-post, middle-posterior (P 5 0.54).P40.05 and, therefore, we accept Ho: mean lag 5 0. The distributionshows points cluster at zero lag. SH shows homogeneity amongregions in EMG activity signals.DISCUSSIONHead Shake Muscle ActivityDuring a head shake, there were rhythmic bursts of activityacross all hyoid muscles observed in this study. Contrary to ourhypothesis, the EMG of the anterior, middle, and posteriorJ. Exp. Zool.regions in both the SH and GH was synchronous, with littlevariation in lag. The intermuscular comparisons of EMG highlighted more similarities than differences between hyoidmusculature activities. The EMG of the SH and GH had zerolag and were, therefore, active at the same time; this is notsurprising, given that the principal function of these antagonistswould be to stabilize the hyoid bone during a vigorous behavior,such as a head shake.There was a statistical difference in EMG between the SH andTH, as well as between the SH and genioglossus (Table 1).However, the activity lags between pairs of these muscles werein the range of 0.1–0.2 msec, for a revolution that lastedapproximately 100 msec. The differences in activity timing ofthese muscles during a swallow is on the order of 20–50 msec, fora behavior that lasts about 400–500 msec (German et al., 2009). Itis questionable whether the very small differences in EMG timingmake a significant difference in the behavior. Likewise, thedifference in timing between EMG of GH and TH is less than0.15 msec (Table 2). Although statistically significant, the smallmagnitude of differences suggest that in terms of a single headshake revolution that lasts 100 msec, we are uncertain of theirbiological meaningfulness.Head Shake Length DynamicsThe results from the comparisons of regional length changes weremore complex than those for the EMGs. We found regionaldifferences in strain heterogeneity in both SH and GH, as well asa high amount of variation in the timing lags among muscleregions. These regional differences are consistent with previousfindings for the SH during swallowing (Konow et al., 2010). Thissupports our idea that the SH has complex behavior, even thoughits architecture is simple (Paniello et al., 2001; Peker et al., 2006).The most consistent results were that the ends of the SH were
MAMMAL HYOID MUSCLE FUNCTION DURING HEAD SHAKES7muscle activity. Our interpretation of this pattern is that themuscle was being stretched as the head turns, and the belly wascontracting eccentrically to resist this turn and to stabilize thehyoid bone against the pull of the muscles.For the GH, strains in the belly and posterior regions wereout-of-phase, whereas strain in the anterior region was in-phasewith one or the other of these regions. Given that the lengthchange in the belly and posterior regions are out-of-phase witheach other, if the anterior region is in-phase with one region itwill be out-of- phase with the other. There are two potentialinterpretations of this pattern. First, the anterior region of the GHcould be truly random in its behavior with respect to its timerelationship with the other regions. Sometimes, it could becontracting isontoically and other times actively lengthening oreven being stretched by the head turn. Without fluoroscopicvisualization, this is hard to resolve. Alternatively, it could bethat we are not measuring the ‘‘functional units’’ within thismuscle. That is, the end plates of the portion of the anteriorregion that is most consistently out-of-phase with the middlewere not aligned with the crystals measuring length change.With more crystals, and histologically guided divisions of theGH, more exact length change phase relationships between theregions could be resolved. It follows that with our largerdivisions, the observed length change could sometimes bedominated by a lengthening pool of motor units and sometimesby a shortening. The existence of multiple pools of motorneurons in the GH is already well documented (van Lunteren andDick, 2000; German et al., 2009; Thexton et al., 2009).The timing of changes in regional muscle length wascharacterized by a high level of variation for all regions in bothmuscles, complicating the interpretation of these results. For SHand GH, the large variation (Figs. 5 and 9) has an average lag, inmost cases near zero.Figure 7. (A) Results of sternohyoid (SH) EMG compared withgenioglossus, geniohyoid (GH), and thyrohyoid (TH) EMG. The EMGactivity between SH to GG and SH to TH are statistically significant(Po0.001 and P 5 0.007), meaning there is a lag; however, the lagis clustered under 0.5 msec. The lag of SH to GH is not significant(P 5 0.82). (B) Results of GH EMG compared with SH EMG and THEMG. EMG activity between GH and SH is not different from zero(P 5 1.0) and EMG activity between GH and TH does showstatistically significant lag, though small (P 5 0.001).lengthening and shortening out-of-phase with the middle of themuscle. Shortening of the belly correlated with the muscleactivity in this region, whereas the ends lengthened duringHead Movement Including ShakingOur results are consistent with some previous studies (Thompson,’41; Thompson and Brodie, ’42; Forsberg et al., ’85), but not all(Berzin, ’95). Previously, head shaking has only been described incats (Richmond et al., ’92). The cat head shakes consisted of 1–5rapid oscillations, usually completed in 100–150 msec andinvolving fast alternating movements from one side of themidline to the other. The EMG recordings for cat head shakesshowed large bursts of activity for all the paravertebral muscles(Richmond et al., ’92). We found similar large bursts for all of thehyoid musculature under study (Fig. 3A). These findings alsosupport previous research by Forsberg et al. (’85). Using bipolarsurface electrodes attached to the skin of the subject, Forsberget al. (’85) found variation in EMG activity of both the infra- andsuprahyoids during different amounts of head extension andflexion (Forsberg et al., ’85). Extension and 201 of flexion showedincreased activity relative to 5 or 101 of flexion. Interestingly, ourresults contradict the findings of Berzin (’95), who used needleJ. Exp. Zool.
8WENTZEL ET AL.Table 2. Results of t-tests for GH group.Regions emg-pGHemgaGHemg-pGHemgGHemg-SHemgGHemg-THemgCCF 269Mean lag (msec)12.251.190.986.370.050.080.010.000.13SD 83o0.0010.0670.561o0.0010.2070.0430.9660.9990.001 Po0.05; Po0.001. H : mean lag 5 0.oThe hyoid musculature is active in maintaining the posture of thehead (Thompson, ’41; Thompson and Brodie, ’42), but the activityof the hyoid musculature during flexion, extension, and lateralmovements of the head remains controversial (Brodie, ’50;Forsberg et al., ’85; Berzin, ’95; Last, ’95). Our study is consistentwith Brodie (’50), Thompson (’41), and Forsberg et al. (’85), whofound that the hyoid musculature shows motor activity during ahead turn. Because our research involved regional lengthdynamics of the SH and GH, we not only quantified electricalactivity, but also regional contraction specialization. The anteriorto posterior gradient of muscle lengthening during a forcefulbehavior, such as a head shake, shows heterogeneity that issurprising for these simple muscles.Figure 8. Regional strain heterogeneity in the geniohyoid. (A)Positive correlation, in-phase relationship, between anterior andposterior regions. Regions lengthen and shorten in synchrony, albeitwith a lag. (B) Negative correlation between middle and posteriorregions. One region lengthens, whereas the other shortens.Y-axis 5 scaled distance, X-axis 5 time (msec).electrodes inserted into the human neck musculature and foundthe SH to be inactive during neck rotation, flexion, and extensionmovements (Berzin, ’95).Head shaking is a cyclical and rapid representation of a headturn. Based on our results, the hyoid musculature, and inparticular the SH and GH muscles, seems to be active during sucha movement. Clearly, kinesiology of the head is principally drivenby the paravertebral and sternocleidomastoid muscles (Last, ’55).J. Exp. Zool.Head Shakes Compared With SwallowingSome aspects of the complex regional differences in lengthchange of SH and GH during head shakes mirror that of patternsin the SH during a more quiescent behavior, namely swallowing.The strain patterns in the belly region were negatively correlatedwith the anterior and posterior regions in swallows occurringearly during a feeding session, when the pigs were most hungry(Konow et al., 2010). The belly was contracting at a different timethan the end regions of the muscle. During later swallows, whenthe animal was less hungry, there was a difference between theanterior and posterior regions, with a posterior to anterior delayin muscle lengthening (Konow et al.
2Department of Orthodontics, University of Maryland, Baltimore, Maryland 3Department of Ecology & Evolutionary Biology, Brown University, . v.6.1.3 (AD instruments, Colorado Springs, CO). The EMG signals were amplified 1,000 times with a MA-300 EMG system (Motion Lab Systems Inc, LA) and a high pass filter of 25Hz was applied.