Transcription
PREFACEThe Health Resources and Services Administration (HRSA) is the key Federal agency responsible for nursingworkforce analysis and development in the United States. The Bureau of Health Professions (BHPr) withinHRSA provides national leadership to assure an adequate supply and distribution of qualified nursing personnelto meet the health needs of the Nation. This responsibility includes examination of the supply, composition, anddistribution of nurses on the national and State levels in order to assure an adequate supply of qualified nursingpersonnel against requirements. For several decades, the Division of Nursing (DN) had primary responsibilityfor the assessment and examination of the Nation’s nursing workforce. Since 2001, the analytical aspects ofthese efforts on the nursing workforce have resided in BHPr’s Evaluation and Analysis Branch (EAB). Theseactivities of the EAB have included leadership and direction in the administration of the 2004 National SampleSurvey of Registered Nurses (NSSRN), the reporting of findings from the Survey, and analytic support in shortterm and long-term assessments of both the supply of nurses in the workforce and the requirements for nurses inthe workforce. In pursuing these analytical efforts on the nursing workforce, BHPr has worked with otheragencies within the Federal Government, as well as with various State agencies and private nursingorganizations, in the development of methods for the study and acquisition of data on the RN population.The NSSRN is the Nation’s most extensive and comprehensive source of statistics on all individuals with activeregistered nurse licenses to practice nursing in the United States whether or not they are employed in nursing. Itprovides information on the number of registered nurses, their educational background and practice specialtyareas, their employment settings, position levels, job satisfaction and salaries. It also provides information ontheir geographic distribution and personal characteristics including gender, racial/ethnic background, age, andfamily status.The development of a design for collecting data through national sample surveys of registered nurses originatedin July 1975 in a contract with Westat, Inc. Subsequently, reports for seven studies, conducted in September1977, November 1980 and 1984, and March 1988, 1992, 1996, and 2000 have been published and madeavailable to people and organizations involved in health care planning and evaluation as well as to the public.This publication is the report of the eighth study, conducted in March 2004.The 2004 NSSRN benefited from a wide range of professional nurse associations and organizations with largeor diverse memberships of individual RNs that endorsed the study and encouraged their members to participatein it. The organizations included the American Academy of Nurse Practitioners, American Association ofCritical-Care Nurses, American Association of Nurse Anesthetists, American Nurses Association, AmericanCollege of Nurse-Midwives, Asian American Pacific Islander Nursing Association, Association of PerioperativeRegistered Nurses, Association of Women’s Health Obstetric and Neonatal Nurses, Emergency NursesAssociation, National Alaska Native/American Indian Nurses Association, National Association of HispanicNurses, National Black Nurses Association, and the National Council of State Boards of Nursing.The 2004 NSSRN survey application, including survey administration, data collection, and reporting, wascarried out by The Gallup Organization through a contract with the U.S. Department of Health and HumanServices (USDHHS), HRSA, and administered by the EAB. Under a subcontract with The Gallup Organization,Insight Policy Research, Inc. led the data analysis, sample design, and the development and writing of the finalreport. Funding for the 2004 NSSRN was provided by the Division of Nursing. EAB staff were responsible foroverseeing the study (Dr. Christine Hager, Steve Tise, Louis A. Kuta, William Spencer, and Marshall Fritz). Inaddition, other HRSA staff including, Dr. Denise Geolot, Donna English, Dr. Annette Debisette, Dr. Joan Weiss,and other members of their staff in the Division of Nursing provided guidance on nursing education and practiceduring the review of the questionnaire drafts, the interpretation of the raw response data, and the preparation ofi
the Findings Report. Members of the Interagency Collaborative on Nursing Statistics (ICONS) also reviewedthe questionnaire draft and offered suggestions prior to finalization. The report was authored by Darby MillerSteiger of the Gallup Organization and Sara Bausch, Bryan Johnson, and Dr. Anne Peterson of Insight PolicyResearch. Zac Arens of the Gallup Organization programmed and summarized the data into tables. HRSA’sBHPr is pleased to make this important information on the Nation’s RNs population available to the publicthrough this report.ii
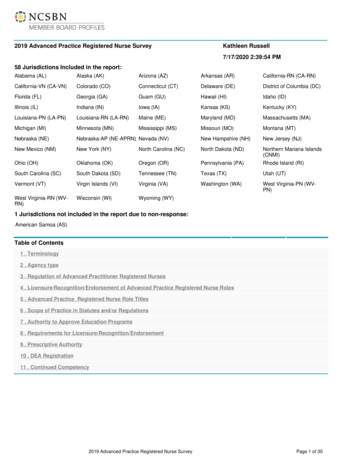
TABLE OF CONTENTSChapterI. INTRODUCTION . 1EARLY REGISTERED NURSE WORKFORCE STUDIES . 1DEVELOPMENT OF NSSRN METHODOLOGY. 2THE 2004 NATIONAL SAMPLE SURVEY OF REGISTERED NURSES (NSSRN) . 2ORGANIZATION OF THE REPORT. 4REFERENCES . 5II. THE REGISTERED NURSE POPULATION 1980 – 2004 . 7REGISTERED NURSES IN THE U.S. 7EDUCATIONAL PREPARATION . 9AGE . 12GENDER . 13RACIAL/ETHNIC BACKGROUND. 14FAMILY STATUS . 17EMPLOYMENT SETTINGS. 17LONG-TERM TRENDS IN AVERAGE SALARIES/EARNINGS. 20III. THE REGISTERED NURSE POPULATION 2004 . 23AGE . 23GENDER . 25RACIAL/ETHNIC BACKGROUND. 26EDUCATION AND EMPLOYMENT PRIOR TO INITIAL NURSING EDUCATION . 28NURSING EDUCATIONAL PREPARATION. 29ADVANCED PRACTICE NURSES . 32Nurse Practitioners . 33Clinical Nurse Specialists. 34Nurse Practitioners and Clinical Nurse Specialists . 35Nurse Anesthetists . 35Nurse Midwives . 36Nurse Practitioners and Nurse Midwives . 36Non-White, Hispanic, or Latino Advanced Practice Nurses . 37REGISTERED NURSES IN THE WORKFORCE. 37Characteristics within Employment Setting . 39Registered Nurses in Nursing Faculty Positions . 42Base of Employment . 43Position Levels . 44Functions During Usual Workweek . 48Recent Indices of Annual Salaries/Earnings Trends . 49Job Satisfaction. 52REGISTERED NURSES NOT EMPLOYED IN NURSING. 55Nurses Seeking Nursing Employment. 56iii
Nurses Employed in Non-Nursing Occupations . 56Registered Nurses Not Employed in Nursing And Not Seeking Nursing Employment . 57GEOGRAPHIC AND EMPLOYMENT MOBILITY. 57Location of Initial Nursing Education. 57Registered Nurses Educated outside the U.S. 58Residence in March 2004 and 2003 . 59Employment Status in 2004 and 2003. 59Employment Setting Changes . 59GEOGRAPHIC DISTRIBUTION OF THE REGISTERED NURSE POPULATION . 60Distribution by State. 60Metropolitan Areas. 61Educational Background . 61Racial/Ethnic Background. 62Age Distribution . 62Employment Settings . 63Changes in Employers and/or Positions . 63Average Earnings within Geographic Area for Staff Nurses . 64Compact States . 64AppendixA. TablesB.Survey MethodologyC.QuestionnaireList of ChartsChart 1.Registered nurse population, by nursing employment status, 1980-2004 . 9Chart 2.Distribution of registered nurses according to initial nursing education, 1980-2004 . 10Chart 3.Distribution of the registered nurse population by highest nursing or nursingrelated educational preparation, 1980-2004. 12Chart 4.Age distribution of registered nurse population 1980-2004 . 13Chart 5.Trend in the number of racial/ethnic white, non-Hispanic and non-white RNs,1980-2004 . 15Chart 6.Distribution of registered nurses by racial/ethnic background, March 2004 . 16Chart 7.Distribution of registered nurses by employment settings, in thousands, 1980-2004. 19Chart 8.Percent change in the number of registered nurses employed in selected settings,1980 to 2004 . 20Chart 9.Actual and "real" income for registered nurses, 1980 to 2004 . 22Chart 10.Average age of graduation from initial nursing education programs, March 2004 . 24iv
Chart 11.Percent distribution of registered nurses by initial nursing and highest nursing ornursing-related educational preparation, March 2004 . 25Chart 12.Percent distribution of registered nurses in each reported racial/ethnic group byhighest nursing or nursing-related educational preparation, March 2004. 28Chart 13.Registered nurses whose highest nursing or nursing-related education was amaster's or doctoral degree, by type of initial nursing education, March 2004 . 31Chart 14.Registered nurses prepared for advanced practice, March 2004. 33Chart 15.Distribution of registered nurses employed in hospitals by dominant function,March 2004 . 38Chart 16.Selected hospital work units for registered nurses providing some direct patientcare, 2000 and 2004 . 39Chart 17.Average age of employed registered nurses for selected employment settings,March 2000 and 2004 . 41Chart 18.Distribution of employed registered nurses by highest nursing or nursing-relatededucational preparation for selected employment settings, March 2004. 43Chart 19a.Distribution of registered nurses by selected position titles, 1988-2004 . 45Chart 19b.Distribution of registered nurses by selected position titles, 1988-2004 . 46Chart 20a.Distribution of registered nurses with selected position titles by highest nursing ornursing-related educational preparation, March 2004 . 47Chart 20b.Distribution of registered nurses with selected position titles by highest nursing ornursing-related educational preparation, March 2004 . 48Chart 21.Average percent of time in work week spent by registered nurses in each function,March 2004 . 49Chart 22.Percent of registered nurses who reported being moderately or extremely satisfiedwith their jobs by employment setting, March 2004 . 53Chart 23.Percent of staff nurses and non-staff nurses satisfied in their jobs by employmentsetting, March 2004 . 54Chart 24.Percent of staff nurses and non-staff nurses satisfied in their jobs by highestnursing or nursing-related educational preparation, March 2004 . 55Chart 25.Changes in registered nurses employment status, 2003 to 2004. 60Chart 26.Average age of registered nurses by region . 63v
List of TablesTable 1.Registered nurse population, by employment status, gender, racial/ethnicbackground, and age group, March 2004.A-1Table 2.Year of graduation from initial nursing education and the average age at graduationfor the registered nurse population, by type of initial nurse education, March 2004 .A-2Table 3.Health occupation prior to initial nursing education, by type of initial nursingeducation, March 2004 .A-3Table 4.Registered nurses who were ever licensed as practical/vocational nurse, by type ofinitial nursing education, March 2004 .A-4Table 5.Characteristics of registered nurses with post-high school academic degree beforeentering initial nursing education, by type of initial nursing education,March2004 .A-5Table 6.Marital status and presence of children, by employment status in principal nursingposition, March 2004 .A-6Table 7.Marital status and caring for other adults at home or others elsewhere, byemployment status in principal nursing position, March 2004 .A-7Table 8.Financial resources used for tuition and fees for initial nursing education, by typeof initial nursing degree, March 2004.A-8Table 9.Distribution of registered nurses according to total household income, by maritaland employment status, March 2004 .A-9Table 10.Registered nurse population, by initial nursing and highest nursing or nursingrelated education, March 2004.A-10Table 11.Primary focus of post-RN master's and doctoral degree, March 2004 .A-11Table 12.Current enrollment of registered nurses in nursing or nursing-related academicdegree educational programs, by employment status and student status,March2004 .A-12Table 13.Distribution of advanced practice nurses by employment status, and by nationalcertification and state nursing board recognition, March 2004 .A-13Table 14.Distribution of registered nurses with specialties in advanced practice nursingpreparation and credentials, March 2004.A-14Table 15.Distribution of registered nurses with national certifications in advanced practicenursing, March 2004 .A-15Table 16.Employment setting of primary positions of registered nurses employed in nursing,March 2004 .A-16/17vi
Table 17.Type of patient treated in organization or unit for principal position in nursing, byemployment status, March 2004 .A-18Table 18.Type of hospital work unit where hospital-employed registered nurses spent morethan half their direct patient care time, by employment status in principal nursingposition, March 2004 .A-19Table 19.Registered nurses employed in each employment setting, by employment statusand average annual hours worked, March 2004 .A-20Table 20.Average hours worked per week and overtime hours per week of employedregistered nurses in their principal nursing position, by employment setting, March2004 .A-21Table 21.Average overtime and mandatory overtime hours for full time nurses byemployment setting and position title, March 2004.A-22Table 22.Employed registered nurses, by employment setting and age group, March 2004.A-23Table 23Employment setting, by highest nursing or nursing-related educational preparationof registered nurses employed in nursing, March 2004 .A-24Table 24.Employment setting of registered nurses in principal nursing position, by workbasis, March 2004 .A-25Table 25.Position titles in primary nursing jobs for registered nurses employed in nursing,March 2004 .A-26Table 26.Employment setting and type of principal nursing position of employed registerednurses, March 2004.A-27Table 27.Type of principal nursing position and highest nursing or nursing-relatededucational preparation of registered nurses employed in nursing, March 2004. A-28Table 28.Percentage of time spent in each functional area in principal nursing positionduring usual work week for employed registered nurses, March 2004 .A-29Table 29.Average percent of time in work week in principal nursing position spent byemployed registered nurses in each function, by highest nursing or nursing-relatededucational preparation, March 2004 .A-30Table 30.Average annual earnings in principal nursing position for registered nursesemployed full time, by employment setting and position title, March 2004 .A-31Table 31.Average annual earnings in principal nursing position of nurses employed full-time, bytype of position and highest nursing or nursing-related educational preparation,March 2004 .A-32Table 32.Distribution of employed registered nurses with one and more than one nursingposition, by employment status and average total earnings, March 2004 .A-33vii
Table 33.Job satisfaction of registered nurses employed in nursing, by position title inprincipal nursing position, March 2004 .A-34Table 34.Job satisfaction of registered nurses employed in nursing, by highest nursing ornursing-related educational preparation, March 2004 .A-35Table 35.Distribution of registered nurses not employed in nursing, by length of time sincelast worked as a nurse and whether or not nurse was seeking nursing position orhad other occupation, March 2004.A-36Table 36.Age distribution of registered nurses not employed in nursing, by length of timenot working in nursing, March 2004.A-37Table 37.Registered nurses not employed in nursing actively seeking employment innursing, by type of employment sought and number of weeks looking,March 2004 .A-38Table 38.Type of employment of registered nurses in non-nursing occupations,March 2004 .A-39Table 39.Detailed type of employment of registered nurses in non-nursing occupations,March 2004 .A-40Table 40.Reasons for registered nurses to have occupation other than nursing, March 2004 .A-41Table 41Marital status and presence of children at home of nurses who were not employedat all and not seeking nursing employment, by age group, March 2004 .A-42Table 42.Marital status and presence of others provided care by nurses who were notemployed at all and not seeking nursing employment, by age group,March2004 .A-43Table 43.Comparison between state of location of registered nurses as of March 2004 andstate of graduation, by type of initial nursing education and number of years sincegraduation, March 2004 .A-44Table 44.Top countries where nurses received initial nursing education, by employmentstatus, March 2004.A-45Table 45.Top states employing foreign-educated nurses, March 2004 .A-46Table 46.Employment setting of foreign-educated nurses, by position of employment,March 2004 .A-47Table 47.Comparison between resident states in 2003 and 2004 for the registered nursepopulation, by age group, March 2004 .A-48Table 48.Comparison of employment status of registered nurse population in 2003 and2004, March 2004 .A-49Table 49Percent distribution of registered nurses in each employment setting in 2004, byemployment setting in 2003, March 2004 .A-50viii
Table 50.Percent distribution of the registered nurse population in each geographic area whochanged employer or position between March 2004 and 2003, by principal reasonfor change .A-51Table 51.Registered nurse population in each state and geographic area by activity status,March 2004 .A-52/53Table 52.Supply of registered nurses in each state and geographic area according to whetheremployed in nursing on a full-time or part-time basis, March 2004.A-54/55Table 53.Registered nurse population, by activity status and geographic location,March 2004 .A-56Table 54.Registered nurses employed in nursing in each state and geographic area, byhighest nursing or nursing-related educational preparation, March 2004. A-57/58Table 55.Racial/ethnic background distribution (percents) of registered nurses, bygeographic area, March 2004.A-59Table 56Age distribution (percents) and average age of registered nurses, by geographicarea, March 2004 .A-60Table 57.Employme
Clinical Nurse Specialists34 . Nurse Practitioners and Clinical Nurse Specialists35 . Nurse Anesthetists35 . Nurse Midwives36 . Nurse Practitioners and Nurse Midwives36 . Non-White, Hispanic, or Latino Advanced Practice Nurses37 . REGISTERED NURSES IN THE WORKFORCE37 . Characteristics within Employment Setting39 . Registered Nurses in Nursing .