Transcription
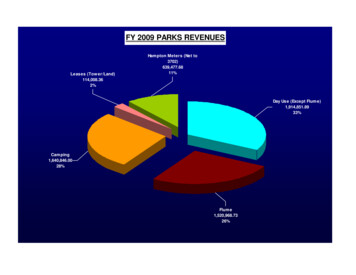
FY 2009 PARKS REVENUESLeases (Tow er/Land)114,008.362%Ham pton Meters (Net to3702)639,477.6811%Day Use (Except Flum e)1,914,851.8933%Cam ping1,640,846.0028%Flum e1,520,968.7326%
About the previous slide¾ Parks earns 5.8 - 6.5 million annually; very weatherdependent¾ Total FY 2009 earnings approximately 5.9 million¾ Parks expenses may not exceed revenues otherwise willincur loss carry-forward¾ Loss carry-forward consumes “first dollars” of eachsucceeding year’s revenues until extinguished¾ Expenses have always exceeded revenues because firstyear of self-funding had no revenues “in the bank” towork with¾ Enhancing revenues requires investment to add newamenities and activities i.e. zip lines, swimming pools,more cabins/yurts, wi-fi, cable capabilities, etc. plusstaffing to support a year-round park system
FY 2009 HAMPTON METERS REVENUES/EXPENSESNet Meters Revenue to HamptonCapital Improvement Account302,353.4623%Meters Expenses385,535.4129%Net Meters Revenue to Parks639,477.6848%
About the previous slide¾ Total FY 2009 earnings from Hampton Meters 1,327,366.55¾ Parks total budget for Meters capped at 1,025,000.00; all over 1,025,000 must be paid into Hampton Capital ImprovementAccount¾ Parks expenses (which must be paid from 1,025,000 cappedfunds) 385,535.41¾ Therefore, earnings to the Park Fund after expenses from Meters 639,477.68¾ Revenues credited to Capital Improvement Account 302,353.46¾ Problem: No matter what the Division does to increase revenues atHampton with meter program, under current legislation, it can neverearn more than 1,025,000.00. As expenses continue to increase(new meters/software/etc., maintenance, staffing, dispute resolution,etc.) the revenue to the Park Fund will continue to decrease
FY 2009 FLUME (TOT REVS 1,520,968.73)Expenses485,782.0332%Net to Parks1,035,186.7068%
About the previous slide¾ Flume shown separately because it is soimportant to the stability of the Park Fund andthe system’s ability to operationally support itself¾ Revenues earned at The Flume Gorge are notcapped as with Hampton Meters thus far moreability to control expenses and increaserevenues to the park system as a whole¾ When Day Use revenues and Flume revenuesadded together, they equal 59% of total ParkFund revenues
FY 2009 PARKS EXPENSESUnemployment Compensation56,316.201%Design, Development &Maintenance448,933.257%Parks Field Ops (not Concord)4,787,264.4072%Workmen's Compensation149,762.762%Parks Admin (Concord)1,186,735.2418%
About the previous slide¾ This slide shows how revenues paid to the Park Fund are divided upamong its various expense accounts¾ Parks Admin (Concord) includes staff, offices, etc. of ConcordHeadquarters¾ Parks Field Operations (not Concord) includes all field staff(permanent and seasonal), plus all operations specific to the parkproperties (maintenance, utilities, equipment, vehicles, supplies,travel, etc.)¾ Design, Development & Maintenance (DD&M) is office under theCommissioner which provides design, development, planning,construction, maintenance, etc. to all DRED divisions.¾ However, the DRED Business Office calculates that the Division ofParks & Recreation requires 53% of DD&M’s resources thus theDivision is charged that much of DD&M’s annual budget (FY 2009 448,933.25) to the Park Fund.¾ The rest of DD&M’s budget is generally funded.¾ Unemployment Comp and Workmen’s Comp self-explanatory
FY 2009 PARKS LABOR EXPENSESDesign, Development ,316.20 Workmen's Compensation149,762.761%3%Parks Admin (Concord)1,060,448.6720%Parks Field Ops (notConcord)3,536,674.5568%
About the previous slide¾Labor costs (full-time, part-time, benefits,holiday and overtime pay) total 5,195,216.43 or 78% of parks totalexpenses¾As shown in the chart, of that total, ParksAdmin (Concord) accounts for 20% of thelabor budget; Parks Field Ops (notConcord) accounts for 68% of the laborbudget; DD&M accounts for 8%;Unemployment and Workmen’s Compaccount for a combined 4%
ADMINISTRATIVE EXPENSESUtilities0.000%Other75,351.266%Current Exp50,935.314%Labor1,060,448.6790%DRED - Division of Parks and RecreationSTRATEGIC DEVELOPMENT and CAPITAL IMPROVEMENT PLAN, 2009Appendix 16 - FY09 Division Income and Expense PresentationPage A16 -11
About the previous slide¾Total Administrative (Concord) expensesfor FY 2009 1,186,735.24¾Breaking down the previous chart one stepfurther, Parks Admin (Concord) expensesare consumed 90% by labor costs¾7 positions lost or laid-off in FY 2009DRED - Division of Parks and RecreationSTRATEGIC DEVELOPMENT and CAPITAL IMPROVEMENT PLAN, 2009Appendix 16 - FY09 Division Income and Expense PresentationPage A16 -12
FIELD OPS (NOT CONCORD) ent Exp721,907.4515%Labor3,536,674.5574%DRED - Division of Parks and RecreationSTRATEGIC DEVELOPMENT and CAPITAL IMPROVEMENT PLAN, 2009Appendix 16 - FY09 Division Income and Expense PresentationPage A16 -13
About previous slide¾ Total Field Ops (not Concord) expenses FY2009 4,787,264.40¾ Parks Field Operations (not Concord) totalexpenses are consumed 74% by labor costs(43% seasonal, 57% full-time)¾ Current expense includes supplies, telephones,uniforms, trash collection, etc. etc.¾ Utilities are heat/electricity/water¾ Other includes debt service, travel, equipmentmaintenance, etc.DRED - Division of Parks and RecreationSTRATEGIC DEVELOPMENT and CAPITAL IMPROVEMENT PLAN, 2009Appendix 16 - FY09 Division Income and Expense PresentationPage A16 -14
TOTAL DIVISION FINANCIAL RESPONSIBILITIESBureau of Parks6,092,787.8817%Capital Budget18,565,000.0049%Bureau of Trails4,800,000.0012%Ski Operations4,154,451.5411%Conservation Plate Funds500,000.001%Connecticut Lakes50,000.000%Unemployment Comp56,316.200%Mount Washington1,251,889.833%Workers Comp149,762.76DRED - Division of Parks and Recreation0%STRATEGIC DEVELOPMENT and CAPITAL IMPROVEMENT PLAN, 2009Appendix 16 - FY09 Division Income and Expense PresentationBureau of Historic Sites151,929.540%DD&M (Parks 53%)480,000.001%Hampton Meters1,327,366.553%Retail1,200,000.003%Page A16 -15
About previous slide¾ It is important to keep in perspective that while“Parks” is viewed as a unique Bureau with a 6,000,000 /- budget, it is part of a much largerwhole that includes responsibility to varyingdegrees for the other bureaus, managementunits, offices, and programs shown above(totaling 38,779,504.30)¾ Resources including staff, equipment, andfunding overlap among all these units in order tosupport combined outputs for the greater goodof the Park System as a wholeDRED - Division of Parks and RecreationSTRATEGIC DEVELOPMENT and CAPITAL IMPROVEMENT PLAN, 2009Appendix 16 - FY09 Division Income and Expense PresentationPage A16 -16
POTENTIAL FUNDING SCENARIOPark Fund6,207,000.0015%Generally ED - Division of Parks and RecreationSTRATEGIC DEVELOPMENT and CAPITAL IMPROVEMENT PLAN, 2009Appendix 16 - FY09 Division Income and Expense PresentationPage A16 -17
About the previous slide¾ Purely Operations (Park Fund): OperatingBudget plus Unemployment Comp andWorkmen’s Comp¾ Request General Funds for: Deficit (extinguishloss carry-forward), Administration (ConcordHeadquarters), Historic Sites (all expenses), andParks portion of DD&M¾ Self-contained budgets include: Bureau of Trails,Ski Operations, Hampton Meters,Retail/Concessions, Mount Washington StatePark, Connecticut Lakes HeadwatersStewardship and Road Maintenance,Conservation Plate (historic preservation), andthe biennial Capital BudgetDRED - Division of Parks and RecreationSTRATEGIC DEVELOPMENT and CAPITAL IMPROVEMENT PLAN, 2009Appendix 16 - FY09 Division Income and Expense PresentationPage A16 -18
Unemployment Compensation 1% Workmen's Compensation 2% Parks Admin (Concord) 18%. DRED - Division of Parks and Recreation STRATEGIC DEVELOPMENT and CAPITAL IMPROVEMENT PLAN, 2009 Appendix 16 - FY09 Division Income and Expense Presentation Page A16 -7