Transcription
LLNL-AR-411431-20-3Lawrence Livermore National Laboratory (LLNL)Experimental Test Site (Site 300) ComplianceMonitoring Report for Waste DischargeRequirements (WDR) Order No. R5-2008-0148,Second Semester/Annual 2019 ReportA. M. ChanFebruary 28, 2020
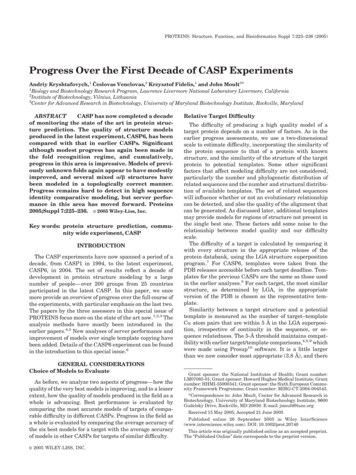
This work performed under the auspices of the U.S. Department of Energy by Lawrence LivermoreNational Laboratory under Contract DE-AC52-07NA27344.
Lawrence Livermore National LaboratoryFebruary 27, 2020Aimee C. Phiri, P.E.Water Resources Control EngineerRWQCB Central Valley11020 Sun Center Drive, Suite 200Rancho Cordova, CA 95670-6114—Subject:Lawrence Livermore National Laboratory (LLNL) Experimental Test Site (Site 300)Conpliance Monitoring Program for the Closed Pit] Landfill, Fourth QuarterReport for 2019Dear Ms. Phiri:Enclosed please find a copy of the Lawrence Lii’er,nore National Laboratory (‘LLNL)Experimental Test Site (Site 300,) Compliance Monitoring Program Report for the Closed Pit 1Landfill, Fourth Quarter Report for 2019 that includes a summary and discussion ofgroundwater monitoring results for this reporting period.This report was prepared in accordance with the Central Valley Regional Water Quality ControlBoard (CVRWQCB) Revised Pit 1 Monitoring and Reporting Program (MRP) for permittedWaste Discharge Requirements (WDR) Order 93-100, dated February 18, 2010. All thereporting requirements and results are discussed in the Description of Report Contents orSummary of Analytical Results sections of this report.No evidence of a new release of constituents of concern from Pit I was indicated by the fourthquarter groundwater measurements. However, four constituents of concern (COC5), beryllium,cadmium, zinc, and uranium, were detected above their respective statistical limits (SL).Beryllium and cadmium had not been previously detected in samples from well K1-09 during theentirety of the monitoring program since 2007, when sampling and analysis for beryllium andcadmium was first conducted. Zinc was detected in the duplicate sample for well K1-09 with thelast SL exceedance during the first quarter 2019. Total uranium was detected in well W-PITI2326, however, previous studies and mass spectrometric uranium isotope testing discuss thenatural background variability of total uranium at the pit. The presence of these COCs does notindicate significant evidence of a release from Pit 1. Retest samples have been requested for allfour COCs and will be discussed in an upcoming 7-Day letter or the next quarterly report.Should you have any questions regarding this letter or the enclosed report, please contact AdaChan in the Water, Air, Monitoring and Analysis Group at LLNL at (925) 422-7758.ESH-EFA-WQ-20-17014— CQ/AC:rngpAn Equal Opportunity Employer. Lawrence Livermore National Security, LLC Operated for the US Department of EnergyP.O. Box 808 Livermore, California 94551-0808 . Telephone (925) 422-1100 http:f/www.llnl.gov76OO6i23O
Lawrence Livermore National LaboratoryCERTIFICATION STATEMENTI certify under penalty of law that this document and all attachments were prepared under mydirection or supervision in accordance with a system designed to assure that qualified personnelproperly gather and evaluate the information submitted. Based on my inquiry of the person orpersons who manage the system, or those persons directly responsible for gathering theinformation, the infonnation submitted is, to the best of my knowledge and belief, true, accurateand complete. I am aware that there are significant penalties for submitting false information,including the possibility of fine and imprisonment for knowing violations.Quinly, ManagerEnvironmental Functional AreaEnvironment, Safety & HealthEnclosure:Lawrence Livermore National Laboratory Experimental Test Site (Site 300)Compliance Monitoring Program for the Closed Pit 1 Landfill, Fourth QuarterReport 2019ESH-EFA-WQ-20-17014-- CQ’AC:rngpAn Equal Opportunity Employer. Lawrence Livermore National Security, LLC . Operated for the US Department of EnergyP.O. Box 808 Livermore, California 94551-0808. Telephone (925)422-1100. http:/Iwww.lln[govRecyc’e7600-61230
Aimee Phiri, CVRWQCBLLNL Site 300 Compliance Monitoring Program for the Closed Pit I Landfill,Fourth Quarter Report for 2019Distribution w/enclosure (PDF):Aiston, FrancesBain, Andy (EPA)Bibby, StephanieBrasaemle, Karla (TechLaw. Inc.)Brigdon, ShariBurruss, DellaCampbell, ChrisChamberlain, SuzieChan, AdaDaRosa, LizDernir, ZaferDibley, ValerieDjuth, Gerald (CVRWQCB)Donnelly, Arid (NNSA/LFO)Grim, Tom (NNSA/LFO)Graves. LisaHsu, Yun-ho (DTSC)Jackson, TylerKato, ThomasLoll, DoloresLuong, DominiqueMcKaskey, JonathanMcKereghan, PeterMishra, Vijay (NNSA/LFO)Nakasaki, StevenQuinly, CrystalSmith, KarenTaffet, MichaelThomas, SharonWalter, EricWoollett, JimUCM: W/GW; Pit 1, Fourth Quarter 2019, Site 300FileESH-EFA-WQ-20-17014— CQ/AC:mgpFebruary 27, 2020Page 3
Environmental Functional AreaWater, Air, Monitoring and Analysis GroupUCRL-AR-10191-19-4Lawrence Livermore National Laboratory(LLNL)Experimental Test Site (Site 300)Compliance Monitoring Program forClosed Pit 1 LandfillFourth Quarter Report for 2019AuthorAda Chan
Lawrence Livermore National Laboratory is operated by Lawrence Livermore National Security, LLC,for the U.S. Department of Energy, National Nuclear Security Administrationunder Contract DE-AC52-07NA27344.
UCRL-AR-10191-19-4LLNL Site 300 Compliance Monitoring Program for the Closed Pit 1 LandfillFourth Quarter Report for 2019ContentsCertification . iiiSummary . ivIntroduction . 1Compliance Monitoring Program Overview . 4Quality Assurance . 4Description of Report Contents . 5Summary of Analytical Results . 6Detection Monitoring Wells . 6Evaluation Monitoring Wells . 8Inspection and Maintenance Summary . 9Regulatory Correspondence and Activities. 9References . 11Acknowledgments . 13Abbreviations and Acronyms . 14AppendicesAppendix A.Tables of Groundwater Measurements A-1Appendix B.Statistical Methods for Release Detection . B-1Appendix C.Quality Assurance Samples . C-1Appendix D.Constituents of Concern and Monitoring Frequencies D-1Appendix E.Well Specification and Construction Details for Detection Monitoring andEvaluation Monitoring Wells . E-1Appendix F.Hydrographs for All Compliance Monitoring Wells F-1Appendix G.Field Logs for Compliance Monitoring and Evaluation Monitoring Wells . G-1Appendix H.Statistical Limits and Graphs of Groundwater Measurements. H-1ESH-EFA-WQ-19-17014– CQ/AC:mgpi
UCRL-AR-10191-19-4LLNL Site 300 Compliance Monitoring Program for the Closed Pit 1 LandfillFourth Quarter Report for 2019FiguresFigure 1.Location of LLNL Site 300 . 1Figure 2.Location of the closed Pit 1 landfill at LLNL Site 300 .2Figure 3.Locations of Pit 1 detection and compliance monitoring wells . 3Figure 4.Freon-113 concentrations in groundwater samples from detection groundwatermonitoring wells around Pit 1 .7Figure 5.Perchlorate concentrations in groundwater samples from evaluation groundwatermonitoring wells at Pit 1 . 8Figure 6.Tritium concentrations in groundwater samples from evaluation groundwatermonitoring wells at Pit 1 . 9Figure A-1. Potentiometric surface map for the Tnbs1/Tnbs0 HSU in the Pit 1 area, fourthquarter 2019 . A-9TablesTable 1.MCLs for radioactivity in drinking water. 5Table A-1.Pit 1 Detection monitoring wells, constituents of concern, SLs, and quarterlyanalytical results for 2019 . A-1Table A-2.Pit 1 Additional PCP constituents for the fourth quarter 2019 analyticalresults for detection monitoring wells . A-5Table A-3.Pit 1 Evaluation monitoring wells, constituents of concern, physicalparameters, and analytical results for the fourth quarter 2019.A-6Table A-4.Pit 1 Groundwater well routine sampling dates . A-7Table A-5.Pit 1 VOC Reporting Limits. A-8Table B-1Monitoring periods for the current statistical limits (SLs) for each analyte and well . B-2Table C-1.Pit 1 Quality assurance for routine, duplicate, and field blank samples for the fourthquarter 2019 . C-1Table D-1.Pit 1 Constituents of concern and monitoring frequencies. D-1Table E-1.Well specification and construction details of the Pit 1 monitoring network .E-1ESH-EFA-WQ-19-17014– CQ/AC:mgpii
UCRL-AR-10191-19-4LLNL Site 300 Compliance Monitoring Program for the Closed Pit 1 LandfillFourth Quarter Report for 2019SummaryThis fourth quarter report for 2019 summarizes compliance activities performed at the LawrenceLivermore National Laboratory (LLNL) Experimental Test Site (Site 300) Pit 1 landfill.Compliance activities at the pit consist of groundwater sampling and analysis, pit cap inspections,and reporting of analytical results. Groundwater monitoring data are contained in Appendix A,Tables A-1 to A-4.No evidence of a new release of constituents of concern (COCs) from Pit 1 was indicated by thefourth quarter groundwater measurements. However, four constituents of concern (COCs) –beryllium, cadmium, zinc, and uranium – were detected above their respective statistical limits(SLs). Zinc was detected in the duplicate sample for well K1-09 with the last SL exceedanceduring the first quarter 2019. Details of SL exceedances have been described in past reports andcurrent exceedances are discussed in detail in the Summary of Analytical Results section of thisreport. The presence of these COCs does not indicate evidence of an actual release from Pit 1.ESH-EFA-WQ-20-17014– CQ/AC:mgpiv
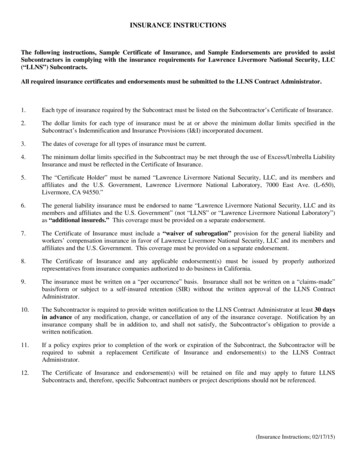
UCRL-AR-10191-19-4LLNL Site 300 Compliance Monitoring Program for the Closed Pit 1 LandfillFourth Quarter Report for 2019IntroductionThis fourth quarter report for 2019 summarizes compliance monitoring results for closed landfillPit 1 at LLNL’s Site 300. Site 300 is a 28.3 square kilometer (km2) (10.9 square miles [mi2]) sitelocated in the Altamont Hills approximately 10.5 km (6.5 mi) southwest of downtown Tracy,California (Figure 1). The landfill is located in the northern portion of the site (Figure 2). Closureof this unlined Class I waste management unit was completed with waste in place in December1992 following a California Department of Health Services (now Department of Toxic SubstancesControl, or DTSC) approved Resource Conservation and Recovery Act (RCRA) Closure and PostClosure Plan (PCP) using the LLNL Comprehensive Environmental Response, Compensation, andLiability Act (CERCLA) Federal Facilities Agreement (FFA) process. Site 300 is owned by theU.S. Department of Energy (U.S. DOE) and is operated by Lawrence Livermore National Security,LLC.Because Pit 1 is not part of a response action conducted under CERCLA, the post-closuremonitoring and reporting for the Pit 1 Landfill is conducted under Waste Discharge RequirementsOrder 93-100 and the February 18, 2010 Revised Monitoring and Reporting Program Order 93100 issued by the California Regional Water Quality Control Board (CRWQCB), Central ValleyRegion.Figure 1. Location of LLNL Site 300.ESH-EFA-WQ-20-17014– CQ/AC:mgp1
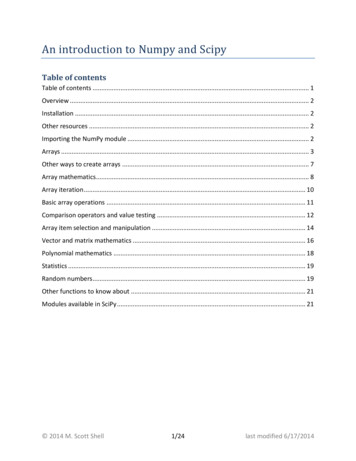
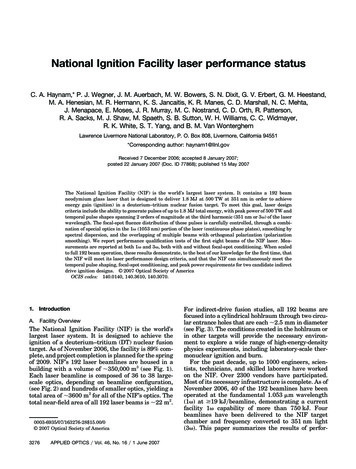
UCRL-AR-10191-19-4LLNL Site 300 Compliance Monitoring Program for the Closed Pit 1 LandfillFourth Quarter Report for 2019Figure 2. Location of the closed Pit 1 landfill at LLNL Site 300.Pit 1 is located in the Elk Ravine drainage area about 300 meters (m) or 984 feet (ft) above meansea level (MSL). Groundwater generally flows in an east-northeast direction beneath Pit 1 (Figure3), following the inclination (dip) of underlying Miocene-age sedimentary rocks (WebsterScholten, 1994).The current monitoring network at Pit 1 consists of twelve monitoring wells. These include eightdetection monitoring wells and four evaluation monitoring wells (Figure 3). The detectionmonitoring wells used to sample the ground water in the vicinity of Pit 1 include: wells K1-01Cand K1-07 located hydrologically upgradient from Pit 1; down-gradient wells K1-02B, K1-04, K105, and W-PIT1-2326; and cross-gradient wells K1-08 and K1-09. The primary purpose of thedetection monitoring wells is to detect any new release of COCs to groundwater. COCs, as definedby Title 23 of the California Code of Regulations (CCR), Chapter 15, are waste constituents,reaction products, and hazardous constituents that are reasonably expected to be in or derived fromwaste buried in the Pit 1 Landfill. LLNL collects, analyzes, and statistically evaluates one samplequarterly from each detection monitoring well.The evaluation monitoring wells are all downgradient of the Pit 1 detection wells and include K106, W-PIT1-2620, W-PIT1-2209, and W-865-2005, as required by the Monitoring ReportingProgram (MRP). Well W-PIT1-02 is no longer sampled because it was abandoned and replacedby well W-PIT1-2620 during the third quarter of 2011 due to well damage. These evaluationmonitoring wells were added to the Pit 1 monitoring and reporting requirements to track existingplumes of perchlorate and tritium from up-gradient sources. LLNL collects and analyzes oneESH-EFA-WQ-20-17014– CQ/AC:mgp2
UCRL-AR-10191-19-4LLNL Site 300 Compliance Monitoring Program for the Closed Pit 1 LandfillFourth Quarter Report for 2019sample quarterly from each evaluation monitoring well and annually conducts trend analyses oftritium and perchlorate concentrations.All the wells are screened in the uppermost water-bearing zone (hydrostratigraphic unit or HSU),which occurs in the Neroly Formation lower blue sandstone (Tnbs1/Tnbs0) HSU. The NerolyFormation contains the main aquifer beneath Site 300. Pit 2, which was closed before RCRA wasenacted, is hydrologically upgradient of Pit 1. In 1992, a 2.4 m (8 ft) thick RCRA cap containingan impermeable layer of clay that is 0.6 m (2 ft) thick was constructed over Pit 1. The cap preventsrainwater from percolating through the waste buried in the pit. A water diversion channel wasconstructed around the pit cap to divert storm water runoff away from the landfill. The diversionchannel empties into the adjacent arroyo, which in turns conveys flow towards Elk Ravine.Figure 3. Locations of Pit 1 detection and compliance monitoring wells.ESH-EFA-WQ-20-17014– CQ/AC:mgp3
UCRL-AR-10191-19-4LLNL Site 300 Compliance Monitoring Program for the Closed Pit 1 LandfillFourth Quarter Report for 2019Compliance Monitoring Program OverviewThis report fulfills quarterly requirements set forth in the following two sets of documents: (1)Waste Discharge Requirements (WDR) Order 93-100 and the February 18, 2010, MRP No. 93100, administered by the California CVRWQCB (CVRWQCB 1993 and 2010) and (2) LLNL Site300 RCRA Closure and Post-Closure Plans (PCPs), Landfill Pits 1 and 7 (Rogers/PacificCorporation 1990). The PCP was approved by the California Department of Health Services (nowthe California Department of Toxic Substances Control). The combined requirements includequarterly groundwater sampling and analyses to detect potential releases of COCs from the landfill,annual and post-major storm event visual inspections of pit cap integrity, repairs as necessary tomaintain the integrity of the landfill and its water-diversion system, annual elevationmeasurements of cap survey markers to detect subsidence, an annual inspection of the cap by anindependent engineer, and these quarterly written monitoring reports. The fourth quarter Pit 1report provides statistical limits and graphs of groundwater measurements (Chan, 2018).Quality AssuranceTo ensure quality data, LLNL works within the established Quality Assurance (QA) program ofthe LLNL Environment, Safety & Health Directorate. LLNL uses protocols and procedures thatcover all aspects of groundwater sampling, sample tracking, and data management. These writtenprotocols and procedures are contained in the LLNL Livermore Site and Site 300 EnvironmentalRestoration Project Standard Operating Procedures (SOPs) (Goodrich and Lorega, 2016), and theEnvironmental Monitoring Plan (Brunckhorst, 2019). SOPs are used to minimize inadvertentsample contamination and maintain sample integrity from the well to the analytical laboratory Datamanagement SOPs ensure that all laboratory measurements are received, accurately recorded, andproperly stored both in a computer database and in hardcopy format.Each quarter, a duplicate (collocated) set of groundwater samples is collected from eachmonitoring network and a set of blank samples is prepared from a randomly chosen well. Inaddition, equipment blanks are prepared and analyzed to ensure that sampling equipment isproperly cleaned before use. Each day, when samples are collected for volatile organic compound(VOC) analysis, a trip blank (prepared at the analytical laboratory) is carried into the field. It isreturned unopened to the analytical laboratory for VOC analysis. If VOCs are detected in a tripblank and in any of the routine samples obtained that day, sample results may be discounted, andnew sampling may be performed.As required by Executive Order 12770, measurements are reported in Système Internationale (SI)units. The SI unit for radioactivity is the becquerel (Bq), equal to 1 nuclear disintegration persecond. The more commonly used unit, picocurie (pCi), is equal to 1 nuclear disintegration per 27seconds. As a convenience, maximum contaminant levels (MCLs) for radioactivity in drinkingwater are given in both becquerels per liter (Bq/L) and picocuries per liter (pCi/L) in Table 1.Note that MCLs are provided for reference only, because this report does not involve wells usedfor potable domestic, livestock, or industrial water supply.ESH-EFA-WQ-20-17014– CQ/AC:mgp4
UCRL-AR-10191-19-4LLNL Site 300 Compliance Monitoring Program for the Closed Pit 1 LandfillFourth Quarter Report for 2019Table 1. MCLs for radioactivity in drinking water.Radiological parameterGross alphaGross betaTritiumRadium (total)Uranium (total)MCL (Bq/L)0.5551.857400.1850.74MCL (pCi/L)155020,000520Description of Report ContentsThe “Summary of Analytical Results” section summarizes any COC concentrations detected ingroundwater samples from detection monitor wells during the fourth quarter of 2019. COCmeasurements that exceeded SLs or MCLs in drinking water are also discussed in this report.Appendix A Tables A-1, A-2, and A-3 contain the groundwater analytical measurements for Pit1 for the fourth quarter of 2019. Table A-4 shows the sample dates and A-5 shows the reportinglimits (RLs) for the Pit 1 VOC COCs. In Tables A-1 through A-3, results that are less than theRL are prefaced with a less than sign ( ). Note that the Appendix A tables may include somesmall negative values for radioactivity measurements. These are below the method RLs and arecalculated values. They simply indicate that the radioactivity for that groundwater sample is lessthan a low activity reference standard. Appendix A also contains a groundwater elevation contourmap (Figure A-1) for the Tnbs1/Tnbs0 HSU at Pit 1. This map is only presented in the second andfourth quarter compliance monitoring program reports.Appendix B explains the methods used to determine the SL for a COC at a monitoring well.Requirements for statistical treatment of groundwater data are established in the CCR, Title 23,Division 3, Chapter 15, Section 2550.7. LLNL uses a statistical prediction limit method toimplement intrawell comparisons. The method uses the average and standard deviation ofhistorical measurements to calculate a SL value. If a routine quarterly COC measurement exceedsits SL and is confirmed by retesting, it is reported to the CVRWQCB as statistically significantevidence of a release.Appendix C contains the results for QA sample analyses performed during the fourth quarter of2019 at Pit 1 in Table C-1.Appendix D consists of Table D-1 summarizing COCs and the sampling frequencies in themonitoring network for the pit. The regulatory drivers for each constituent of concern are alsoincluded in Table D-1.Appendix E consists of Table E-1 and presents well specification and construction details fordetection monitoring and evaluation monitoring wells.Appendix F contains hydrographs for all compliance monitoring wells.ESH-EFA-WQ-20-17014– CQ/AC:mgp5
UCRL-AR-10191-19-4LLNL Site 300 Compliance Monitoring Program for the Closed Pit 1 LandfillFourth Quarter Report for 2019Appendix G contains field logs for all compliance monitoring wells.Appendix H consists of the statistical limits and graphs of groundwater measurements.Summary of Analytical ResultsThis section summarizes the analytical results for Pit 1 for the fourth quarter of 2019 and reportson the requirements of the CVRWQCB Pit 1 MRP and post-closure plan requirements. During thefourth quarter monitoring period, no new releases of COCs to groundwater from the pit are evidentin the data. As part of the MRP, SLs used to monitor groundwater COCs are shown on Table A1. The MRP requires that two confirmation samples be collected from wells where COCs exceedSLs. If either of the two confirmation sample concentrations exceeds the SL, a finding ofstatistically significant evidence of a release is confirmed and a seven-day notification letter mustbe submitted to the CVRWQCB. The statistical tests used to evaluate these data are identified inAppendix B.Detection Monitoring WellsAnalytical results indicate that there were three COCs (beryllium, cadmium, and uranium) detectedin routine samples above their respective SLs from the Pit 1 wells and one COC (zinc) detected ina duplicate sample above the SL. The presence of these COCs does not indicate an actual releasefrom Pit 1 and details of these SL exceedances are explained below. No other COCs exceeded anSL this quarter and no COCs exceeded an MCL.Several statistical limit exceedances occurred at cross-gradient well K1-09 during the fourthquarter for the following constituents of concern – beryllium, cadmium, and zinc (in the duplicatesample). Sampling performed on November 4th yielded a beryllium concentration of 1.2 µg/L (SL 0.5 ug/L), cadmium concentration of 1 ug/L (SL 0.5 ug/L), and zinc concentration of 21 µg/L(SL 20 µg/L) in the duplicate sample. Email correspondence was made to Aimee Phiri onJanuary 6th noting the SL exceedance and the collection of two retest samples for the COCs.Beryllium and cadmium had not been previously detected in samples from well K1-09 since 2007,when sampling and analysis for beryllium and cadmium were first conducted. In the duplicatesample for zinc, a SL exceedance was observed, and two retest samples were requested. Zinc waslast detected at 36 µg/L in the first quarter of 2019. LLNL will evaluate the beryllium, cadmium,and zinc concentrations from this well when the retest sample results are available, and reportresults in the next quarterly report or in a 7-Day letter.Sampling performed on December 17th at down-gradient well W-PIT1-2326 yielded total uraniumactivities of 0.146 Bq/L and 0.179 Bq/L (SL 0.139 Bq/L) in the routine and duplicate samplerespectively. The total uranium activities in this wells and other Pit 1 wells have been discussedin past reports (Blake, 2011; Blake, 2015, Chan, 2019) and in letters to the CVRWQCB (Schultz,2010 [90-Day Letter]; Pierce, 2011 [Seven-Day Written Notification]). As stated in these lettersand reports, the analyses and information that LLNL has provided to the CVRWQCB indicate thatthe total uranium activities in the Pit 1 wells have historically been within background ranges.Moreover, the mass spectrometric uranium isotope analysis of a fourth quarter 2018 sample fromESH-EFA-WQ-20-17014– CQ/AC:mgp6
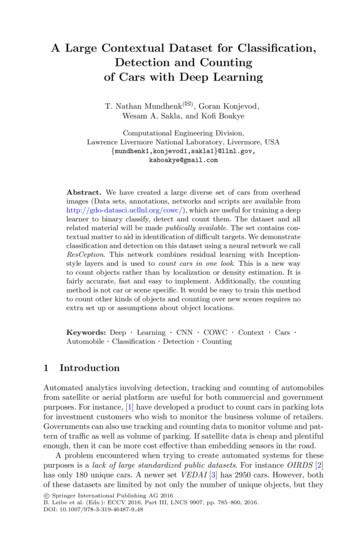
UCRL-AR-10191-19-4LLNL Site 300 Compliance Monitoring Program for the Closed Pit 1 LandfillFourth Quarter Report for 2019well W-PIT1-2326 yielded a 235U/238U atom ratio of 0.00728, within the natural range near 0.0072.Thus, the SL exceedances of total uranium in Pit 1 well samples do not indicate actual evidence ofa release of total uranium from the pit, but rather reflect background variability in total uranium inground water within a volcaniclastic aquifer. Two retests for total uranium from this quarter wererequested and the results will be evaluated in a 7-day letter or in the next quarterly report.In addition to the normal reporting for detection monitoring wells with COCs and correspondingSLs, this report evaluates additional constituents that have shown elevated concentrations and aremonitored under the PCP or under LLNL’s surveillance monitoring program per DOE Order458.1. The concentrations of selected VOCs detected in groundwater samples from detectionmonitoring wells are summarized and presented as total VOCs (Table A-2). VOCs were detectedin groundwater samples from upgradient well K1-07 (0.92 µg/L) and cross-gradient wells K1-08(25 µg/L) and K1-09 (42g/L). Total VOC concentrations are similar to those reported last quarter.The only VOC observed in these samples was Freon-113. The Freon-113 arises from a source atBuilding 865, about 300 m (984 ft) northwest of Pit 1 (Taffet et al., 2019b). The Freon-113concentrations for ground water samples collected from wells K1-05, K1-08, and K1-09 are plottedon Figure 4, below. The Freon-113 concentration trends for these detection monitoring wells havebeen relatively similar and have each varied within narrow ranges since 2002. The maximumconcentrations of Freon-113 measured in these detection monitoring wells are well below the 1,200µg/L MCL.Figure 4. Freon-113 concentrations in groundwater samples from detection monitoring wells at Pit 1.ESH-EFA-WQ-20-17014– CQ/AC:mgp7
UCRL-AR-10191-19-4LLNL Site 300 Compliance Monitoring Program for the Closed Pit 1 LandfillFourth Quarter Report for 2019Evaluation Monitoring WellsEvaluation monitoring wells are required by the MRP and analytical results for samples from thesewells are tabulated in Table A-3. The table lists physical parameters as well as perchlorate andtritium analytical data. These wells are used to track the existing plumes of perchlorate and tritiumfrom an up-gradient source. As required by the MRP, annual time-series plots of perchlorate andtritium concentrations in evaluation monitoring wells are presented in each fourth quarter/annualreport.Of the four current evaluation monitoring wells (W-PIT1-2209, W-865-2005, K1-06, and W-PIT12620), one well, K1-06, has not been sampled since 2018 due to a non-working pump. However,the well is scheduled to receive a new pump in the coming months. The fourth quarter 2019 samplefrom one of the evaluation monitoring wells, W-PIT1-2620, yielded 6.2 µg/L of perchlorate,similar to concentrations reported in previous quarterly reports. This is the only evaluationmonitoring well that yielded a detection of perchlorate this quarter, exceeding the 6 µg/L MCL forperchlorate. LLNL will continue to monitor the perchlorate concentrations in the evaluationmonitoring wells. Perchlorate concentrations in ground water samples collected from the currentevaluation monitoring wells and W-PIT1-02 (replaced.by W-PIT1-2620) since 2005 are plottedon Figure 5, below.Figure 5. Perchlorate concentrations in groundwater samples from evaluation monitoring wells atPit 1.ESH-EFA-WQ-20-17014– CQ/AC:mgp8
UCRL-AR-10191-19-4LLNL Site 300 Compliance Monitoring Program for the Closed Pit 1 LandfillFourth Quarter Report for 2019The tritium activities in fourth quarter 2019 samples from the evaluation monitoring wells wereall consistent with recent d
The current monitoring network at Pit 1 consists of twelve monitoring wells. These include eight detection monitoring wells and four evaluation monitoring wells Figure 3). The detection (monitoring wells used to sample the groundwater in the vicinity of Pit 1 include: wells K1 -01C