Transcription
(2022) 10:164Nishimura et al. BMC -1Open AccessRESEARCHInterpersonal predictors of lonelinessin Japanese children: variable‑and person‑centered approachesTakuma Nishimura1* , Tatsuya Murakami2 and Shigeo Sakurai3AbstractBackground: Loneliness in children has been a major topic of interest in both clinical and developmental psychology. Further studies to investigate predictors of loneliness are needed for educational practices.Methods: A total of 1088 late elementary school-aged children (48.81% boys, Mage 10.35) participated in a 1-yearlongitudinal survey. We used hierarchical linear modeling and mover-stayer latent transition analysis.Discussion: Findings from the variable- and person- centered approaches suggested that less positive peer relations,higher victimization, and higher relational aggression are predictors of higher future loneliness. Meanwhile, bothapproaches did not reach an agreement concerning predictors to reduce loneliness. This result highlighted a utilityof a combined approach and sounded an alarm for overreliance on the variable-centered approach dominating childresearch.Conclusion: To protect young children from loneliness, it will be more beneficial to prevent the development ofloneliness rather than to apply interventions to reduce loneliness once established. Preventive practices need to beimplemented to protect children from loneliness.Keywords: Children, Hierarchical linear modeling, Loneliness, Longitudinal study, Mover-stayer latent transitionanalysisBackgroundFeelings of loneliness in children have been a major topicof interest in clinical and developmental psychology [13].Considerable research has revealed that loneliness isrelated to numerous problems of clinical relevance andrisks including depression, anxiety, social withdrawal andsuicide ideation [4, 11, 15, 34]. Additionally, lonely individuals tend to suffer from a cognitive bias toward threatening social stimuli, and easy access to the experience ofloneliness [39]. This means that an experience of loneliness makes the individual more sensitive to lonelinessand makes memories of maladaptive experiences morereadily accessible.According to van Dulmen and Goossens [41], 3–14%of children or adolescents experienced stable high orchronic loneliness; this means that they were exposed toloneliness longitudinally. Therefore, research involvingits predictors is significant in terms of elucidating howto prevent loneliness in children. The primary interest ofthe present study was to examine interpersonal predictors of loneliness in late elementary school-aged childrenthrough a combination of variable- and person- centeredapproaches.*Correspondence: t-nishimura@fcu.ac.jp1Faculty of Education, Fukuyama City University, Hiroshima, Fukuyama, JapanFull list of author information is available at the end of the article The Author(s) 2022. Open Access This article is licensed under a Creative Commons Attribution 4.0 International License, whichpermits use, sharing, adaptation, distribution and reproduction in any medium or format, as long as you give appropriate credit to theoriginal author(s) and the source, provide a link to the Creative Commons licence, and indicate if changes were made. The images orother third party material in this article are included in the article’s Creative Commons licence, unless indicated otherwise in a credit lineto the material. If material is not included in the article’s Creative Commons licence and your intended use is not permitted by statutoryregulation or exceeds the permitted use, you will need to obtain permission directly from the copyright holder. To view a copy of thislicence, visit http:// creat iveco mmons. org/ licen ses/ by/4. 0/. The Creative Commons Public Domain Dedication waiver (http:// creat iveco mmons. org/ publi cdoma in/ zero/1. 0/) applies to the data made available in this article, unless otherwise stated in a credit line to the data.
Nishimura et al. BMC Psychology(2022) 10:164Predictors of loneliness in childrenLoneliness is a subjective experience and an emotionaltendency described as sadness or pain, which is causedby an absence of connection with others [31]. Abundantresearch to date has focused on interpersonal experiences as predictors of loneliness because the primarytrigger in children of loneliness is thought to be a lack ofor difficulties in peer relations [1, 2]. Under this assumption, which provides a rationale for research regardingpredictors of loneliness, poor peer relations (such aslower peer acceptance and social competence) and peervictimization have been examined whether they are validpredictors of loneliness. For instance, Ladd, Kochenderfer, and Coleman [21] reported that a significant proportion of variance in loneliness accounted by positive peerrelations was of medium effect size in both cross-sectional (R2 0.19) and longitudinal studies (R2 0.13) andthat victimization also predicted changes in lonelinesslongitudinally. Ladd and Troop-Gordon [22] conducted a5-year longitudinal study and found that chronic friendlessness and rejection accounted for a proportion of thevariance in loneliness. Further, other studies using sociometric methods to obtain group members’ ratings ornominations of liked or disliked others showed that victimized children (i.e., those rejected) reported high loneliness compared to the accepted or liked children [6, 26].Aggression, which may be classified as overt aggression (e.g., punching, kicking, threatening) and relationalaggression (e.g., excluding, manipulating others’ relationships, spreading rumors [7]), which could push othersaway, resulting in rejection by peers because aggressivebehaviors are negatively viewed [10] and unacceptable in peer relation [5, 30]. Such experiences made children easily feel lonely. In this way, aggression has beenhypothesized to produce feelings of loneliness in a seriesof loneliness studies for children. However, as a potentialinterpersonal predictor of loneliness, the predictive roleof aggression remains undefined. Prinstein, Boergers, andVernberg’s [32] cross-sectional study showed no overallrelation between the two types of aggression and loneliness. While Putallaz et al. [33] reported a positive relation between overt aggression and loneliness, no relationwas shown between relational aggression and loneliness.Thus, further investigation is needed.The above review shows that loneliness in childrenis deeply related to their interpersonal experience.Although many other potential antecedents such asfriendship quality, social network, and individual characteristics has been explored [8], the present study focusedon the role of key interpersonal predictors: positive peerrelations, victimization, and the two types of aggression(overt and relational aggression). In addition, the theoryof loneliness has given much attention to the causes ofPage 2 of 11loneliness such as poor peer relations, higher victimization, and higher aggression. However, researchers ofchild loneliness should also focus on positive aspects ofinterpersonal experiences as resilience such as healthypeer relations, lower victimization, and lower aggression.As described below, by utilizing analysis of person-centered approach, we can more precisely investigate bothpotentials of interpersonal relations for child loneliness.Person‑centered approachThough several variable-centered approaches havedominated this research area, incorporation of personcentered approaches for interpretation has been recommended in developmental psychopathology [39]. Theperson-centered approaches focus on the identificationof groups that share specific attributes or individual differences in developmental patterns [24]. As evident inKochenderfer-Ladd and Wardrop’s [18] study on victimization trajectories, one of the strengths of personcentered approaches is to provide more detailed insightsinto relations. Besides adopting a variable-centered view,in which a clear connection exists between victimizationand loneliness, they adopted a person-centered view byfocusing on trajectory patterns. A person-centered viewillustrated that while children moving toward victimization status tended to experience greater loneliness, theydid not necessarily become less lonely when moving awayfrom victimization status.In the first place, previous research on children’s loneliness focusing on predictors seems to have relied ona variable-centered approach with not much attentiongiven to the potential over-interpretation of covariates. For example, when a negative longitudinal relationis found between an independent variable (i.e., potential predictors) and loneliness, researchers can interpretthe relation as indicating both that a lower score on theindependent variable is predictive of increased feelingsof loneliness and that a higher score on the independentvariable is predictive of decreased feelings of loneliness.However, this interpretation is not always applicablebecause a mere correlation does not necessarily meanthat both conditions are simultaneously satisfied; that is,only one condition is well established and then the negative relation emerges. Therefore, in addressing the issueof potential over-interpretation of covariates, a personcentered approach is useful.To investigate the predictors of loneliness from a person-centered approach, mover-stayer latent trajectoryanalysis (mover-stayer LTA) is applicable. The moverstayer LTA explores transitional patterns between latentprofiles across time. It differs from typical LTA in beingable to identify participants whose latent profiles change(i.e., movers) or remain the same (i.e., stayers) during the
Nishimura et al. BMC Psychology(2022) 10:164study period. Additionally, we can confirm whether theresults of a variable-centered approach are in the samedirection by applying mover-stayer LTA by comparingthe scores of potential predictors at specific time points.For example, if positive peer relations are strongly relatedto reduced loneliness (variable-centered view), individuals with latent profiles characterized by decreasing loneliness should have higher scores for positive peer relationsduring the period of the assessments (person-centeredview).The other advantage of mover-stayer LTA is towidely cover potential patterns of trajectories. Here, wereviewed seven empirical research that identified loneliness trajectories in children [3, 12, 14, 20, 35, 38, 42],revealing specific subpopulation of trajectory patternssuch as low levels of loneliness, decreasing, increasing,and chronically high patterns. However, sub-groups ofloneliness trajectories were not consistent among theprevious studies; for example, almost all studies reporteda trajectory of individuals with decreasing lonelinessexcept for Benner [3]. Moreover, five studies reportedan increasing trajectory, but Harris et al. [12] and Laddand Ettekal [20] did not report the increasing pattern. Asreviewed, there were several types of loneliness trajectories; however, the largest percentage of children belongedto a low stable pattern among reported trajectories ineach study. Although there was some variation amongthe studies, approximately 40–80% of children were classified into a pattern of low or no loneliness. Specifically,four studies [3, 12, 14, 42] reported that more than halfof children in each sample are categorized low stable pattern of loneliness. In contrast, around 10% of the childrenwere exposed to chronic loneliness and approximately10–20% belonged to increasing or decreasing patterns ofloneliness. Thus, there is an interindividual variation inthe developmental changes in children’s sense of loneliness. The mover-stayer LTA can help to detect the diversity of the differentiation.Overview of the present studyThe purpose of the present study was to identify predictors of loneliness through variable- and person-centeredapproaches. First, using hierarchical linear modeling(HLM) as the variable-centered approach, we investigatedthe effect of positive peer relations, victimization, andthe two types of aggression on loneliness. Second, usingmover-stayer LTA as the person-centered approach, wetested the replication of the results by HLM. The hypothesis regarding the predictors of loneliness in HLM wasthat victimization and relational aggression would bepositively correlated, and positive peer relations wouldbe negatively correlated with loneliness. In addition, thePage 3 of 11results of the mover-stayer LTA might support the direction of the outcome of the HLM.MethodStudy designThis study involved a 1-year longitudinal design withthree measurement points, with about half a year interval. We conducted the baseline assessment (Time 0: T0)for loneliness between January and February, the secondassessment (Time 1: T1) for loneliness and the potentialpredictors (i.e., positive peer relations, victimization, andtwo types of aggression) between June and July, and thethird assessment (Time 2: T2) for loneliness a year afterbaseline between January and February. These interpersonal predictors were assessed at only T1 to match theresults of HLM and mover-stayer LTA.ParticipantsA total of 1088 elementary school students in the 4th and5th grade (531 boys and 557 girls; Mage 10.35, age rangewas 9–11) from eight public schools (37 classes) in Japanparticipated in the survey. The number of participantswith complete data was 1054 at T0, 1046 at T1, 1071 atT2, and 1029 throughout the three measurement points.All participants were Japanese from the lower to uppermiddle-class socioeconomic status. The sample washighly homogeneous in terms of ethnic and cultural background based on their demographics.MeasuresLoneliness (children’s report)We used the Five-item Loneliness Scale for Children(Five-LSC; [28]). All five items use direct expressionsto assess loneliness (Item 1: “Do you feel that you arealone?”, Item 2: “Do you think that there is nobody toplay with?”, Item 3: “Do you feel that you are left behindby people around you?”, Item 4: “Do you think that noone would help you if you were in trouble?”, Item 5: “Doyou feel lonely?”). According to Nishimura et al. [28],the Five-LSC has demonstrated sufficient validity basedon teachers’ observational assessment: the difference inthe score of loneliness between lonely students nominated by teachers and non-nominated was significant(Cohen’s d 0.60). Also, loneliness assessed by the FiveLSC showed a negative correlation with social competence and social skills, but a positive correlation withwithdrawn behaviors. These measures were developedfor use in Japan and well validated in that context. Therating was a 4-point Likert scale ranging from 1 (stronglydisagree) to 4 (strongly agree). We computed the arithmetic mean of the five items with higher scores reflectinghigher loneliness. Participants responded to the FiveLSC at the three measurement points. Because of the
Nishimura et al. BMC Psychology(2022) 10:164underestimations for internal consistency of Cronbach’salpha [9], we used McDonald’s omega (0.91, 0.93, and0.94 at T0, T1, and T2, respectively).Page 4 of 11We assessed positive peer relations with a three-itemscale (e.g., “Are peers kind to you”) that was standardizedand published by the Toshobunka Company in Japan. Thescale was developed for use in Japan and has establishedclinical validity with low scores predicting peer victimization [17] and higher loneliness [29]. The rating is a4-point ranging from 1 (strongly disagree) to 4 (stronglyagree). We computed the arithmetic mean of all threeitems with higher scores reflecting more positive peerrelations. In this study, McDonald’s omega of this scalewas 0.83.on the last page of the questionnaire, which allowed usto link data from different time points and the teacherassessments.This research project involved collaboration with eightpublic schools. We contributed to each school’s educational practice by providing feedback data regardinghomeroom management and identifying students with ahigh risk of school maladjustment. The schools explainedthis project to parents, who provided informed consenton behalf of their children and obtained the agreement inthis research. Also, participants were informed that theyhad the full freedom to participate or withdraw at anytime of their participation by written consent. The institutional research board (IRB) at the authors’ universityapproved the procedures. All methods were performedin accordance with the guidelines.Victimization (children’s report)Statistical analysisWe used a six-item scale of victimization standardized and published by the Tosyobunka Company inJapan. This scale was developed for use in Japan and hasestablished high clinical and prospective validity, withhigh scores predicting non-attendance and being bullied at school [17]. The rating is a 4-point scale rangingfrom 1 (strongly disagree) to 4 (strongly agree). We usedthe arithmetic mean of all six items with higher scoresreflecting higher victimization. In this study, McDonald’somega of this scale was 0.89.All analyses were performed using R 3.1.0 and Mplusver. 7.11 [27]. We used HLM to examine the predictorsof loneliness, because children were nested within classrooms. In HLM, variance in individual-level outcomesis partitioned into a child (within-level) and classroom(between-level) variance. Thus, we first calculated theintra class coefficient (ICC) to assess the percentage ofthe between-level variance in loneliness explained. Thevariance at the between-level was 0.02; although thisvariance was small, we applied HLM to avoid a type-1error [19]. Furthermore, because of the nature of classrooms managed by homeroom teachers, we expectedthat between-level variances would moderate the connection between loneliness at T1 and T2. Thus, we werealso interested in analyzing cross-level interactions. Forease of interpretation, between-level variables were centered at the grand mean in the analysis.Using person-centered approaches, we first run latentprofile analysis (LPA) and then mover-stayer LTA. LPAexamines the number of underlying subgroups of participants with similar patterns based on latent factorscores. For determining the number of profiles whichhad the best fit to the hypothesized model, we referred toAkaike’s information criterion (AIC), Bayesian information criterion (BIC), adjusted BIC (aBIC), and the resultof the bootstrap likelihood ratio test (BLRT). Modelswith relatively lower AIC, BIC, and aBIC values fit betterthan those with higher values. The BLRT compares theimprovement in fit between neighboring class models.The null hypothesis is that the k profile solution fits better than a solution with k-1 profiles. A significant p valueindicates the superiority of the k profile model comparedto the k-1 model. Next, we employed to mover-stayerLTA to examine the transition of participants betweenlatent profiles at T0 and T2. A mover-stayer LTA usesPositive peer relations (children’s report)Relational and overt aggression (teachers’ report)We used a teacher-report measure to assess children’srelational and overt aggression in reference to Click andGrotpeter [7]. This measure has seven items, four ofwhich assess relational aggression (e.g., trying to excludeothers from their group), and three items assess overtaggression (e.g., hits, pushes others) and content validity is established [7]. Items are rated on a five-point scale,ranging from 1 (never) to 5 (always). We used the arithmetic mean with higher scores reflecting higher aggression. Thirty-seven homeroom teachers rated items foreach student in their homeroom. In this study, McDonald’s omega was 0.89 for relational aggression and 0.90for overt aggression.ProcedureHomeroom teachers administered all questionnaire surveys in their class. The top sheet of the questionnairecontained the following statements: (a) the survey wasnot related to school grade evaluations, (b) the privacy ofthose taking the survey would be protected, and (c) participants were guaranteed the freedom to withdraw fromparticipation. Participants provided their demographics data such as grade, class, sex, and student number
Nishimura et al. BMC Psychology(2022) 10:164Page 5 of 11second-order latent class variables that classify individuals into “movers” and “stayers”. We reported the Mplussyntax of the mover-stayer LTA in Appendix 1 as Additional file 1. Then, we estimated the relation betweenthe transition status identified by mover-stayer LTA andeach score of the predictors: positive peer relations, victimization, relational and overt aggression at T1. Finally,we addressed missing data by using the full informationmaximum likelihood method. We checked the patternof missing data and comparison of loneliness score of T2between children with non-missing and missing at T0and T1 and ascertained that the effect sizes of differenceswere small; therefore, we assumed that the data weremissing at random.ResultsPreliminary analysesTable 1 presents the means, standard deviations, andcorrelations among all variables. We observed moderately positive correlations between loneliness each timepoint (r 0.44 to 0.62, p .001). Positive peer relationswere significantly negatively correlated with loneliness,while victimization was significantly positively correlated with loneliness. Neither type of aggression, exceptfor relational aggression at T1, showed any correlationwith loneliness.Predictors of loneliness: hierarchical linear modelingTable 2 presents the results of the HLM with a random intercept and slope model. After controlling fordemographics and baseline variables, we found thatTable 1 Means, standard deviations, 95% confidence intervals and correlations among the variablesMSD95% CI2341. Loneliness (T0: baseline)1.380.62[1.34, 1.42].55***2. Loneliness (T1)1.360.60[1.32, 1.39] .36***3. Positive peer relations (T1)3.330.57[3.30, 3.37]4. Victimization (T1)1.510.57[1.47, 1.54]5. Relational aggression (T1)1.400.59[1.37, 1.44]6. Overt aggression (T1)1.150.40[1.13, 1.18]7. Loneliness (T2)1.410.66[1.37, 1.45] .50***567.43***.02.01.65***.06.04.62*** .49*** .04 .06 .42***.04.44***.06.50***.47***.12***.06T0 Time 0, T1 Time 1, T2 Time 2. CI confidence interval***p .001Table 2 The results of hierarchical liner modeling for loneliness at time 2VariablesγSEp95% CIWithin level(Demographics and baseline variables)GenderAgeLoneliness (T0: baseline) 0.08 0.010.110.03.0100.03.7490.03 .001[ 0.14, 0.02][ 0.06, 0.05][0.05, 0.17](T1 variables)LonelinessPositive peer relationsVictimization0.460.04 .001[0.36, 0.53] 0.130.03 .001[ 0.20, 0.07]0.110.04.002Relational aggression0.090.04.010[0.04, 0.19][0.02, 0.16]Overt aggression0.030.05.719[ 0.06, 0.13][ 0.21, 1.04]Cross-level interactionPositive peer relations with loneliness (T1)0.420.32.192Victimization with loneliness (T1)0.820.35.020[0.13, 1.50] 0.090.08.915[ 0.42, 0.25]0.33.740[ 0.74, 0.53]Relational aggression with loneliness (T1)Overt aggression with loneliness (T1)T0 Time 0, T1 Time 1, CI confidence interval 0.11
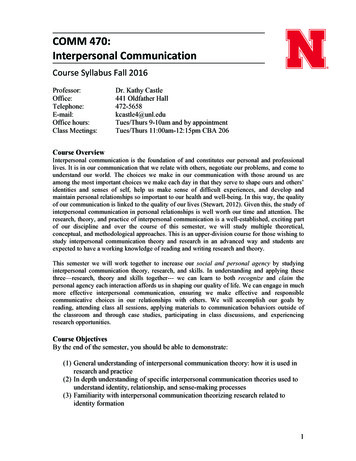
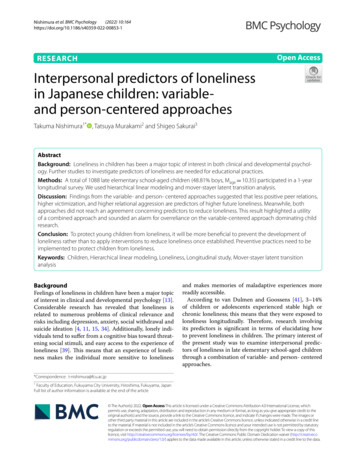
Nishimura et al. BMC Psychology(2022) 10:164Page 6 of 11of loneliness (1.03 to 1.10). In total, 812 students at T0and 792 students at T2 belonged to profile 1. Profile 2was the “relatively low group” as characterized by relatively low scores of loneliness (1.93 to 2.09); overall, 210students at T0 and 215 students at T2 belonged to profile2. Finally, the “high group” under profile 3 was characterized by high scores of loneliness (2.95 to 3.35) in which66 students at T0 and 81 students at T2. Table 5 andFig. 1 present the trajectory patterns. Movers were thosewho transitioned from one profile to another across time.Stayers were those who remained in the same profile.Overall, 768 students (70.59%) were classified as stayers (i.e., patterns 1, 5, and 9) and 219 students (29.41%)as movers including 175 increasers (patterns 2, 3, and6) and 145 decreasers (patterns 4, 7, and 8). The quality of classification of mover-stayer LTA was acceptable(entropy 0.83). Table 6 summarizes the loneliness trajectories found in previous studies and their correspondence with the findings of the current study.Next, we estimated factor scores of positive peer relations, victimization, and relational and overt aggressionin order to examine the effects of children’s interpersonal experiences at T1 on these trajectories ofloneliness at T1, victimization and relational aggressionwere positively correlated with loneliness at T2. Positive peer relations were negatively correlated with loneliness at T2. Overt aggression was not associated withloneliness at T2. Focusing on cross-level interactions,between-level victimization was positively correlatedwith the relation between loneliness at T1 and T2.Predictors of loneliness: mover‑stayer LTAWe first investigated the number of profiles that best fitthe data at T0 and T2. Although we first hypothesizedthat the number of profiles would be more than four,uninterpretable profiles emerged. Therefore, we compared the models from one- to three-profiles. Table 3shows comparisons of the latent profiles. At both measurement points, AIC, BIC, and aBIC of the three-profilemodel were the smallest among the models. We founda significant difference among the models via the BLRT.Therefore, we performed the mover-stayer LTA using thethree-profile model for exploring the transitions betweenthese profiles across measurement points.Table 4 presents the characteristics of each profile. Profile 1 was the “low group” as characterized by low scoresTable 3 The summaries of model comparison of latent profile models at both T0 and T2ModeldfAICBICaBIC LRpOne-profile model1012,103.9112,153.7212,121.96Two-profile model169253.279332.96Three-profile model227741.477851.349282.142862.65 .0017781.471523.51 .001One-profile model1012,155.4112,205.1712,173.41Two-profile model168615.428695.04Three-profile model227141.727251.208644.223551.99 .0017181.331485.69 .001T0: BaselineT2AIC Akaike’s information criterion. BIC Bayesian information criterion. aBIC sample size adjusted BIC. LR means difference of likelihood ratio betweenneighboring class models (i.e., comparing k 1 and the k class models)Table 4 Unstandardized means, standard errors, and 95% confidence intervals at each latent profile1. Low group2. Relatively low group3. High groupMSE95% CIMSE95% CIMSE95% CIItem 11.070.01[1.05, 1.10]2.090.04[2.01, 2.17]3.320.06[3.21, 3.43]Item 21.080.01[1.05, 1.10]1.930.04[1.85, 2.00]2.950.08[2.80, 3.10]Item 31.030.01[1.01, 1.04]2.040.04[1.97, 2.10]3.350.05[3.25, 3.46]Item 41.100.01[1.08, 1.03]1.980.04[1.90, 2.06]2.980.08[2.82, 3.13]Item 51.080.01[1.06, 1.00]2.020.05[1.94, 2.11]3.160.08[3.00, 3.31]Frequency (%)T0: Baseline812 (74.63)210 (19.30)66 (6.07)T2792 (72.79)215 (19.76)81 (7.45)CI confidence interval
Nishimura et al. BMC Psychology(2022) 10:164Page 7 of 11Table 5 Frequency of each mover-stayer latent transition patternLatent profileFrequecny%Change of categoryNoT0: baselineT21Low groupLow group671a61.67Stayer2Relateively low group117b10.75Increaser3High group24b2.21IncreaserLow group102b9.38Decreaser4Relateively low group5Relateively low group74a6.80Stayer6High group34b3.13IncreaserLow group19b1.75Decreaser8Relateively low group24b2.21Decreaser9High group23a2.11Stayer7High groupa"stayers": those participants who were classified into the same latent profile in T0 (baseline) and T2b"movers": those participants who were classified into the different latent profile from T0 (baseline) and T2Fig. 1 All transition patterns of mover-stayer LTAloneliness. Table 7 presents the factor scores of positive peer relations and victimization. Table 8 presentsscores for the two types of aggression for each profilealong with the results of one-sample t-tests and theireffect size (i.e., Cohen’s d). These factor scores represent distal means (from zero); the p value is associated with the null hypothesis (the mean is equal tozero). Overall, several statistically significant effectswere found for positive peer relations, victimization,and relational aggression, but not for overt aggression.The stayer in pattern 1 was associated with higher peerrelations, lower victimization, and lower relationalaggression. Meanwhile, other profiles of the stayer (i.e.,patterns 5 and 9) were associated with lower positivepeer relations and higher victimization but had no relation with either type of aggression. As for the increasers (i.e., patterns 2, 3, and 6), they were associatedwith lower positive peer relations, higher victimization(chance level in profile 2), and relational aggression. Asfor the decreasers, those in patterns 7 and 8 were associated with higher victimization, while pattern 8 wasalso negatively correlated with positive peer relations.No significant effects were found for pattern 4. Surprisingly, although they were decreasers, their factor scoresof positive peer relations and victimization were notpositive and negative, respectively.DiscussionTheoretically, child loneliness is empathized as a subjective experience and is deeply related to difficulty withpeers. This assumption means that poor interpersonalexperiences are risk of loneliness. Meanwhile, simultaneously, this premise implies positive perspectives ofinterpersonal peer relations reducing loneliness. Ouranalyses investigating the interpersonal predictors ofloneliness in late elementary school-aged children givethe interim conclusion for the possibility regarding theeffect of interpersonal experiences. In the following sections, we discuss the results of each analysis by a variable- and person- centered approach in turn, outliningtheir advantages.
Nishimura et al. BMC Psychology(2022) 10:164Page 8 of 11Table 6 Ovrerview of loneliness trajectories and inclusiveness of mover-stayer LTAProfiles identified by mover-stayer LTA12345Result6789Benner [3]〇Chronically high (11%)Low-steady (78%)〇Covered〇
Nishimura et al. BMC Psychology Page 2 of 11 Predictors of loneliness in children Loneliness is a subjective experience and an emotional tendency described as sadness or pain, which is caused by an absence of connection with others [31]. Abundant research to date has focused on interpersonal experi-