Transcription
NINTH ANNUAL REPORTNOVEMBER 2002Arizona Department of Health ServicesCommunity and Family Health Services
Leadership for a Healthy ArizonaJane Dee Hull, GovernorState of ArizonaCatherine R. Eden, Ph.D., DirectorArizona Department of Health ServicesMISSIONSetting the standard for personal and community health throughdirect care delivery, science, public policy and leadership.Arizona Department of Health ServicesCommunity and Family Health ServicesChild Fatality Review Program2927 North 35th AvenuePhoenix, Arizona 85017(602) 542-1875This publication can be made available in alternative format. Please contact the Child Fatality Review Program at(602) 542-1875 (voice) or call 1-800-367-8939 (TDD).Permission to quote from or reproduce materials from this publication is granted when acknowledgment is made.
ARIZONA CHILD FATALITY REVIEW TEAMNINTH ANNUAL REPORTNOVEMBER 2002MISSIONTo reduce preventable child fatalities through systematic,multidisciplinary, multiagency, and multimodality review of childfatalities in Arizona; through interdisciplinary training andcommunity-based prevention education; and through data-drivenrecommendations for legislation and public policy.Submitted toThe Honorable Jane Dee Hull, Governor, State of ArizonaThe Honorable Randall Gnant, President, Arizona State SenateThe Honorable Jim Weiers, SpeakerArizona State House of Representatives
ACKNOWLEDGMENTSOnce again we wish to acknowledge the dedication and unwavering support of our volunteers from throughoutArizona. Over 250 people continue to share their valuable time and expertise to make the process a success. Thisyear we also wish to extend a special thank you to Richard Porter, Chief, Bureau of Public Health Statistics, andhis staff for analyzing the 2001 child fatality data and producing the ninth annual report.In the last year six team members have either retired or moved on to different positions. Many of these memberscontinue to volunteer their time as we transition new members into the positions they held.Dyanne Greer, representing the Arizona Prosecuting Attorney’s Advisory Council, has been involved since theinception of the program. Her background in behavioral health as well as law allowed a balanced view of difficultcase reviews. We appreciate her continued involvement on State Team Committees.Robert Harmon, representing Arizona Economic Security, Division of Developmental Disabilities, has beeninvolved since the inception of the program. His attention to detail, particularly the annual report, is irreplaceable.Karin Kline, representing Arizona Department of Economic Security, Administration for Children, Youth andFamilies, joined us several years ago and added a wealth of knowledge concerning DES policies and issues.Dorothy J. Meyer, representing the Indian Health Service, also has been involved since the inception of theprogram. She has served as Chair of the State Team Data Committee and has brought knowledge, energy andunwavering dedication to the process. Her knowledge of the Native American culture and hands-on clinicalpractice throughout the world has enriched us all.Bev Odgen, representing the Governor’s Division for Children, was perhaps the one person most responsible forthe program’s establishment. Through her will, determination and leadership the process became law in 1993.Virginia Richter, representing the Office of the Attorney General, has also been with us since the inception ofthe program. Virginia chaired the Protocol Committee, which has responsibility for authorizing our local teams.New members may fill their respective positions on the teams but the contributions of these members will alwaysbe cherished.To each of you, a most sincere “Thank you!! You are always welcome back.”
ARIZONA CHILD FATALITY REVIEW TEAMMary Ellen Rimsza, MD, ChairpersonArizona Chapter, American Academy of PediatricsKathryn Bowen, MDLocal Child Fatality Review TeamDavid K. ByersAdministrative Office of the CourtsKipp Charlton, MDArizona Unexpected Infant Death CouncilCalvert CurleyNavajo NationLawrence CzarneckiForensic PathologistSt. Joseph’s HospitalCathryn EcheverriaSusan Burke (former)Arizona Dept. of Health Services,Office of Children withSpecial Health Care NeedsGleebah EnosInter-Tribal Council of ArizonaDonna MartinillaRobert Harmon (former)Arizona Dept. of Economic Security,Division of Developmental DisabilitiesDorothy J. MeyerIndian Health ServiceBev OgdenGovernor’s Division for ChildrenRichard PorterArizona Dept. of Health Services,Bureau of Public Health StatisticsStanley Raker, MDDepartment of Juvenile CorrectionsVirginia RichterOffice of the Attorney GeneralBeth RosenbergChildren’s Action AllianceDyanne GreerArizona Prosecuting Attorney’sAdvisory CouncilFlora SotomayorKarin Kline (former)Arizona Dept. of Economic Security,Administration for Children, Youth, andFamiliesThomas KlemkoDeanna Hearon (former)Arizona Dept. of Health Services,Division of Behavioral Health ServicesJonathan Weisbuch, MDPublic Health ServicesMatthew Lovato, MDFamily Advocacy ProgramLuke Air Force BaseVacant (current)Bob Wetherell (former)Arizona Peace Officers Standards andTraining Board (AZ P.O.S.T.)Linda WrightParent Assistance Office of the Supreme Court
TECHNICAL ASSISTANCEVince MilesAjilon Information SystemsTrentham CoeArizona Department of Health ServicesOffice of Epidemiology and StatisticsAstrid RollArizona Department of Health ServicesOffice of Epidemiology and StatisticsLisa CrimaldiTrauma Prevention CoordinatorRebecca RuffnerExecutive Director,Prevent Child AbuseBahney DedolphArizona Coalition Against Domestic ViolenceBarbara HathawayClinical Coding SpecialistSarah SantanaMaricopa County Department of Public HealthJeffrey HirshensonArizona Department of Health Services,Office of Epidemiology and Health StatisticsIvan TsosieNavajo Nation Department of Law EnforcementEmma Viera-NegronEpidemiologistChristopher MrelaArizona Department of Health ServicesOffice of Epidemiology and Health StatisticsSTAFFRobert SchacknerDirector, Child Fatality Review ProgramDeAnna FoardAdministrative AssistantTeresa GarlingtonAdministrative SecretarySusan NewberryProgram Manager, Citizen Review Panel
TABLE OF CONTENTSEXECUTIVE SUMMARY. iINTRODUCTION.12001 FINDINGS .3Motor Vehicle Crashes .6Unintentional Injuries Other Than Motor Vehicle Crashes .7Violence-Related Deaths .10Sudden Infant Death Syndrome .13Medical Conditions / Prematurity .14Demographic Characteristics of the Children .15ACCOMPLISHMENTS.18CHALLENGES.23APPENDIX 1: ARIZONA REVISED STATUTES .27APPENDIX 2: LOCAL TEAM MEMBERS.33APPENDIX 3: STATE TEAM COMMITTEE MEMBERS .63LIST of FIGURESFigure 1: Local Child Fatality Review Teams and Dates of Authorization .1Figure 2: Preventable Deaths in 2001 by Age.3Figure 3: Preventable Deaths by Primary Category in 2001 .4Figure 4: Primary Categories of All Deaths in 2001 .5Figure 5: Deaths Due to Unintentional Injuries (Other than Motor Vehicle Crashes) in 2001 .8Figure 6: Preventable Deaths Due to Unintentional Injuries (Other than Motor Vehicle Crashes) in 2001.8Figure 7: Violence-Related Deaths in 2001 .10Figure 8: Preventable Violence-Related Deaths in 2001.11LIST of TABLESTable 1: Rates for Selected Primary Categories of Death for Children Whose Deaths Were Reviewed.5Table 2: Leading Categories of Death in 2001 by Age for Children Whose Deaths Were Reviewed.6Table 3: Ages of Children Whose Deaths Were Reviewed .15Table 4: Gender of Children Whose Deaths Were Reviewed.16Table 5: Race/Ethnicity of Children Whose Deaths Were Reviewed .16Table 6: Total and Preventable Crude Death Rates for Race/Ethnicity and Age.17
EXECUTIVE SUMMARYThe year 2001 was the seventh full year in which Arizona’s Child Fatality Review Program has reviewedchild fatalities that occur throughout the state and maintained data on all cases reviewed. The mission of theprogram is to reduce preventable child fatalities through case reviews, training, community education, and datadriven recommendations for legislation and public policy. There were a total of 1051 child deaths reported inArizona during 2001; 969 of these deaths (92.2 percent) had been reviewed by the time this report was prepared.FINDINGS Of the 969 deaths reviewed, 247 (25.5%) were determined to be preventable. For children from ages 1 through 17, almost 50% of the deaths were determined to be preventable. There were 76 violence-related deaths (homicide, suicide, and child abuse) in 2001, a 58% increase from48 deaths from violent causes in 2000. Homicide deaths increased by 129%, from 17 (2000) to 39 (2001). Suicide deaths increased by 40%, from 20 (2000) to 28 (2001). Child abuse deaths decreased by 18%, from 11 (2000) to 9 (2001). In 2001, 43 Arizona children died due to gunshot wounds, an increase of 26 (65%) over the previous year. Approximately 75% of all preventable deaths were due to motor vehicle crashes and unintentional injuries. The CFRT (Child Fatality Review Team) determined that 87% of all motor vehicle crashes werepreventable. Improper seatbelt and child restraint use continues to be a major factor in motor vehicle mortality. There were 40 deaths due to drowning in 2001 compared to 42 deaths in 2000. Of the 40 drowning deaths,35 (87.5%) were determined to have been preventable. Deaths due to suffocation/choking increased by 54%, from 13 (2000) to 20 (2001). Ninety percent (90%) ofthese deaths were determined to have been preventable. Deaths due to smoke inhalation and burns increased by 2 .5 times, from 4 (2000) to 14 (2001). Thirteen(13) of these deaths were the result of residential fires; 85.7% of these deaths were determined to bepreventable. The mortality rate for sudden infant death syndrome decreased from 1.1 per 1,000 infants in 1995 to 0.4 per1,000 infants in 2001.i
In order to prevent child fatalities the CFRT recommends:For elected officials: Support public campaigns and parenting education that focus on prevention of violence-related deaths,including firearm safety. Increase enforcement of laws prohibiting persons under age 18 from possessing a firearm. Fund adequate, appropriate and timely behavioral health services for children and adolescents. Expand and enforce existing pool fencing ordinances. Support public awareness campaigns about safe sleeping arrangements to prevent SIDS and suffocationdeaths. Ensure that all Arizona children have access to medical care. Fund Evidence-Based Prevention Programs.For the Arizona Public Keep children away from guns and guns away from children. Recognize children at risk for suicide and seek intervention for these children. Do not let people drive when under the influence of drugs or alcohol. Always buckle up and use child safety seats. Supervise children in and around traffic, including the driveway of the home. Always supervise a child around water. Install and maintain secure backyard pool fencing. Ensure safe sleeping arrangements for your child. Put infants to sleep on their backs in a crib that does not contain loose bedding or toys. Install and maintain home smoke detectors and have a fire escape plan. Don’t allow anyone to smoke around your baby.ii
INTRODUCTIONThe year 2001 was the seventh full year in which Arizona’s Child Fatality Review Program has reviewed childfatalities that occur throughout the state and maintained data on all cases reviewed. Once again, there is hopefulnews to report. The death rate in four major categories continues to be lower than the 1995 rate, the first full year ofdata collection. These categories are motor vehicle crashes, unintentional injuries (other than motor vehiclecrashes), violence (including homicide, suicide, and child abuse deaths), and SIDS risk factors.While the death rate is decreasing, preventability of child fatalities from many causes remains high. In 2001, 247Arizona child fatalities might have been prevented. This is the conclusion drawn from extensive reviews conductedby Arizona’s child fatality review teams. The teams review the deaths and circumstances surrounding the deaths ofchildren under age 18 who die in Arizona. Over 250 volunteers devote an estimated 4,000 hours each year toparticipation on the teams. This report provides information based on a total of 969 child deaths reviewed in 2001.The Child Fatality Review Program was established by statute in 1993 (see Appendix 1). The mission of theprogram is to reduce preventable child fatalities through case reviews, training, community education, and datadriven recommendations for legislation and public policy. Professional and administrative support is provided bythe Arizona Department of Health Services (ADHS). The State Child Fatality Review Team has a statutorilydefined membership and is responsible for statewide data collection, analysis, and reporting on child fatalities. TheState Team is charged with authorizing local child fatality review teams to conduct reviews of all child deaths inArizona’s counties and with providing consultation and education to the local teams. At a minimum, the local teamsinclude representatives from health, child welfare, social services, behavioral health, law enforcement, and the legalsystem (Appendix 2, local team members).As of July 2002, there were local child fatality review teams in 14 of Arizona’s 15 counties, as shown in Figure 1.La Paz County’s team, which has been in process of development since 1998, was authorized this year. OnlyGreenlee County is still without a team. The Clinical Consultation Committee of the State Child Fatality ReviewTeam reviews deaths for counties that do not have a local team (Appendix 3, State Team Committee members).Figure 1: Local Child Fatality Review Teams and Dates of Authorization
Child fatality review teams follow standard protocols in reviewing death certificates and other records, asnecessary. They assess the circumstances surrounding each child’s death and make a determination ofpreventability, both short term and long term. Data are recorded on a standard form and entered into the childfatality database. The information in the child fatality database goes beyond that which can be gleaned from deathcertificates alone and provides details that can help promote better understanding and, ultimately, prevent childdeaths in Arizona.The State Child Fatality Review Team is mandated to prepare an annual statistical report on child fatalities inArizona and to submit the report to the Governor of the State, the President of the Arizona Senate, and the Speakerof the Arizona State House of Representatives. This is the ninth annual report issued by the State Team. Dataincluded in this report are drawn from child deaths that occurred in 2001 and were reviewed by the child fatalityreview teams. There were a total of 1051 child deaths reported in Arizona during 2001; 969 (92.2 percent) of thesedeaths had been reviewed by the time this report was prepared.PreventabilityIdentifying preventability is a primary goal of legislation mandating child fatality review teams in Arizona.Throughout this report, there are references to “preventable deaths.” The interdisciplinary child fatality reviewteams review the circumstances surrounding each child death that occurs in Arizona. They examine deathcertificates, medical examiner records, hospital records, law enforcement reports, and any other relevant documentsthat provide insight into a child’s death. Then the team makes a determination of short-term preventability, that is,“definitely”, “probably”, “probably not”, or “definitely not” preventable. There is no common or national standardfor the definition of preventability. The Arizona State Child Fatality Review Team has developed the followingoperational definition for use in evaluation of the short-term preventability of a child’s death:A child’s death is considered to be preventable if the community (education, legislation, etc.) or an individual(reasonable precaution, supervision, or action) could reasonably have done something that would havechanged the circumstances that led to the child’s death.“Definitely” preventable implies that the death being reviewed could have, in most cases, been prevented withreasonable intervention. “Probably preventable” indicates that a child’s death could probably have been prevented,but without the same certainty that exists in the category of “definitely.” “Probably not” is used when the childmight still have died even with reasonable intervention. “Not at all”(definitely not) is defined as a death that wouldhave occurred regardless of any and all attempts at intervention.The determination is recorded on the child fatality review data form and entered into a database. Those deathsassessed to be “definitely” or “probably” preventable are referred to in this report as “preventable deaths.”When the report refers to “all deaths” reviewed, the data are based on all 969 fatalities reviewed by the teams.When the report refers to “preventable deaths,” the data are based on the 247 fatalities that were judged by theteams to have been preventable. This distinction is important so that efforts to reduce child fatalities can be focusedin areas that are most amenable to prevention.2
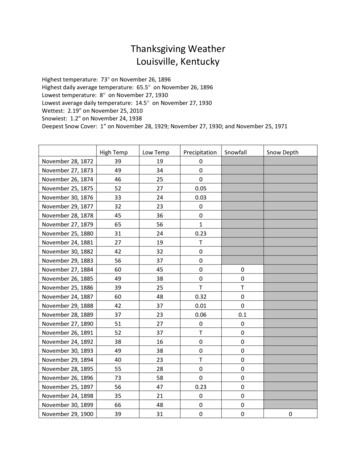
2001 FINDINGSReviews were conducted of 969 of the 1051 fatalities that occurred in Arizona between January 1, 2001 andDecember 31, 2001 among children from birth through age 17 years. In each case, the child fatality review teamreviewing the death made an assessment of preventability. As specified in the State Child Fatality Review Team’sprotocols, a child’s death is considered to be preventable if an individual or the community could reasonably havedone something that would have changed the circumstances that led to death. For deaths rated as not preventable,the information in the case records did not suggest that a reasonable change in circumstances could have preventedthe death or the risk factors associated with the death.PreventabilityOf the 969 deaths reviewed, 247 (25.5 percent) were determined by the child fatality review teams to bepreventable. Preventability increases when neonates (children from birth through 27 days) are excluded from thetotal because the leading causes of death for infants in the first month of life are not as preventable as are theleading causes of death for older children. Nearly 40 percent (240 of 605) of the deaths of children aged 28 daysthrough 17 years were considered to be preventable.Preventable Deaths by AgeFigure 2 shows the percentage of preventable deaths by age category. The age group with the lowest percentage ofpreventable deaths is neonates; only 1.9 percent (7 of 364) of the deaths of newborns were determined to bepreventable. For postneonates (28 days to one year), 20.5 percent (38 of 185) of the deaths were determined to bepreventable. Among 1-4 year olds, 47.8 percent (66 of 138) were preventable; among 5-9 year olds, 50.7 percent(37 of 73) were preventable; and among 10-14 year olds, 46.3 percent (37 of 80) were preventable. Among 15-17year olds, 48.1 percent (62 of 129) of the deaths were 0%20.5%20.0%10.0%0.0%1.9%Neonates Postneonates 1-4 Years5-9 Years10-14 Years 15-17 YearsFigure 2: Preventable Deaths in 2001 by Age for ChildrenWhose Deaths Were Reviewed (N 969)Primary Categories of Preventable DeathsThe primary category of death was identified for all child deaths reviewed. The primary category of death providesinformation about the type of death and is not necessarily the immediate cause of death as listed on the deathcertificate. For example, a gunshot wound might be the immediate cause of death but the category, as recordedherein, might be homicide or suicide. The data are reported in this way because this provides the most helpfulinformation for purposes of prevention.3
Figure 3 shows the categories of death for the 247 preventable deaths reviewed. The categories were: motor vehiclecrashes (97 deaths, 39.3 percent of preventable deaths); unintentional injuries other than motor vehicle crashes (82deaths, 33.2 percent of preventable deaths); violence-related (37 deaths, 15.0 percent of preventable deaths);Sudden Infant Death Syndrome (SIDS) risk factors (11 deaths, 4.5 percent of preventable deaths); and medicalconditions/prematurity (19 deaths, 7.7 percent of preventable deaths). The category of death was undetermined inone child’s death.Medical Conditions/Prematurity7.7%SIDS Risk tor VehicleCrashes39.3%Unintentional Injuries(other than motorvehicle crashes)33.2%Figure 3: Primary Categories of Death forPreventable Deaths in 2001 for Children WhoseDeaths Were Reviewed (N 247)Preventable deaths due to unintentional injuries other than motor vehicle crashes included drowning (35),suffocation/choking (18), smoke inhalation/burns (12), gun shot wounds (5), poisoning (4), head injury (3),falls (2), laceration (1), exposure (1), and electrocution (1). Preventable medical conditions/prematurity includeddeaths due to infectious disease (7), pulmonary condition (3), intestinal condition (2), congenital anomalies (2),surgical complications (2), perinatal condition (1), liver disease (1), seizure disorder (1). Preventable violencerelated deaths included suicides (17), homicides (13), and child abuse (7).Primary Categories of All Deaths ReviewedThe categories of death for all 969 deaths reviewed, including those assessed to be not preventable and those inwhich preventability could not be determined, are shown in Figure 4. The leading categories of death were: medicalconditions/prematurity (634 deaths, 65.4 percent), motor vehicle crashes (112, 11.6 percent), unintentional injuriesother than motor vehicle crashes (99, 10.2 percent), violence-related (76, 7.8 percent), and SIDS (36, 3.7 percent).The category of death was undetermined in 12 deaths (1.2 percent)Medical conditions/prematurity included deaths due to prematurity (223), congenital anomalies (174), infectiousdisease (81), neoplastic disease (cancer) (45), pulmonary condition (20), perinatal conditions (19), neurologicaldisorder (14), cardiac disease (14), metabolic disorder (12), intestinal condition (10), respiratory distress syndrome(9), seizure disorder (3), autoimmune disease (3), surgical complications (3), hematologic disease (1), allergicdisease (1), and renal disease (1).Deaths due to unintentional injuries other than motor vehicle crashes included drowning (40), suffocation/choking(20), smoke inhalation/burns (14), poisoning (9), gunshot wound (5), head injury (4), falls (2), exposure (1),electrocution (1), animal injury (1), laceration (1), and strangulation (1).Violence-related deaths included homicides (39), suicides (28), and child abuse (9).4
SIDS3.7%Violence-Related7.8%Unintentional InjuriesUndetermined1.2%(other than motorvehicle crashes)10.2%Medical Conditions/Prematurity65.4%MotorVehicle Crashes11.6%Figure 4: Primary Categories of Death in 2001 for All DeathsReviewed (N 969)Rates for the leading categories of preventable death highlighted in this report are shown in Table 1. The rates arebased on the deaths reviewed, not the total number of Arizona child deaths for any given year, and therefore shouldnot be used to represent Arizona death rates. Death rates decreased in all categories from 1995 to 2001. However, itshould be noted that the death rates for unintentional injuries, suicide, and homicide increased from 2000 to 2001.Homicides more than doubled and suicides were up 40%.Primary Category of Death 1995 1996 1997 1998 1999 2000 2001Rate Rate Rate Rate Rate Rate RateMotor Vehicle Crashes per100,000 (Birth-17)Unintentional Injuries (otherthan motor vehicle crashes)per 100,000 (Birth-17)12.9 .45.13.55.4Homicides per 100,000(Birth-17)4.73.23.12.52.71.22.8Suicides per 100,000 (10-17)5.54.56.45.43.93.44.6Child Abuse per 100,000(Birth-17)1.41.30.70.90.80.80.6SIDS per 1,000(Under Age 1)1.10.70.60.70.50.50.4Violence-Related per100,000 (Birth-17)Table 1: Rates for Selected Primary Categories of Death for Children Whose Deaths Were Reviewed(N 969)Leading Categories of All Deaths Reviewed by AgeThe leading categories of death among the child fatalities reviewed vary considerably when the age of the childwho died is considered, as shown in Table 2. Only the categories with the highest number of deaths are included.The number of deaths reviewed in each age category is provided for informational purposes.Among neonates, the leading categories of death were all health-related, with prematurity being the highest. Amongpostneonates, the leading category of death was infectious disease. For ages 1-4, the leading cause of death wasdrowning. From ages 5 through 17, the leading category of death was motor vehicle crashes. Violence (homicideand/or suicide) was a leading category among youths 10 through 17 years old.5
Neonates(Birth through 27 Days)(Total Deaths 364)PrematurityCongenital AnomaliesPerinatal ConditionsInfectious DiseasePulmonary Conditions20510218775-9 Year Olds(Total Deaths 73)Motor Vehicle CrashesNeoplastic DiseaseCongenital AnomaliesInfectious DiseaseDrowningPostneonates(28 Days to 1 Year)(Total Deaths 185)Infectious DiseaseCongenital AnomaliesSIDSPrematuritySuffocation/Choking1-4 Year Olds(Total Deaths 138)393333171010-14 Year Olds(Total Deaths 80)1710885Motor Vehicle CrashesNeoplastic DiseaseHomicideSuicideCongenital AnomaliesDrowningMotor Vehicle CrashesCongenital AnomaliesInfectious DiseaseSuffocation/Choking272423201015-17 Year Olds(Total Deaths 129)181411105Motor Vehicle CrashesHomicideSuicideNeoplastic DiseasePoisoning41221877Table 2: Leading Categories of Death in 2001 by Age for Children Whose Deaths Were Reviewed (N 969)MOTOR VEHICLE CRASHESNinety-seven children’s deaths could have been prevented.There were 112 deaths due to motor vehicle crashes among the 969 child fatalities reviewed. Crashes accounted for11.6 percent of all deaths. This is a decrease from 2000 when there were 126 deaths; however, it remains the secondhighest overall category of death and the leading category of death for children age one and older.Of the 112 deaths due to motor vehicle crashes, 97 (86.6 percent) were determined to be preventable. Preventabilitycould not be assessed in seven cases. In eight incidents the death was assessed to be not preventable. Motor vehiclecrashes accounted for 39.3 percent of all preventable child deaths in 2001.Sixty of the 112 children who died in motor vehicle crashes were known to be passengers in cars or trucks. Of thesechild passengers, it is known that 36 were not properly restrained and 9 were in appropriate restraints. Data on theproper use of child passenger safety seats or seat belts were not available in 26 cases. Three of the 46 children whowere not properly restrained were under age one; five children were ages 1-4; eight children were ages 5-9; fivechildren were ages 10-14; and 15 children were ages 15-17.Fifteen of the young persons who died in motor vehicle crashes were known to be drivers (excluding motorcycleand ATV incidents). Of these 15, at least 10 were not wearing seat belts. Five are unknown. Twelve of the driverswere either 16 or 17 years old and three youths were age 15. Age was considered to be a factor in 12 of the deaths.Adverse weather was listed as a factor in one of the deaths. Alcohol was a factor in at least eight of
Gleebah Enos Inter-Tribal Council of Arizona Dyanne Greer Arizona Prosecuting Attorney's Advisory Council Thomas Klemko Deanna Hearon (former) Arizona Dept. of Health Services, Division of Behavioral Health Services Matthew Lovato, MD Family Advocacy Program Luke Air Force Base Donna Martinilla Robert Harmon (former) Arizona Dept. of Economic .


![Financial Advisory and Intermediary Services Act [No. 37 of 2002]](/img/30/a37-020.jpg)