Transcription
Understanding Your Cost of CareMeasuring a Health Center’s PerformanceDave KleiberProject Consultant, Capital LinkSeptember 26, 2018 2018 Capital Linkwww.caplink.org1
IntroductionCapital Link recently collaboratedwith NACHC to provide an updatedCost Per Visit—Measuring HealthCenter Performance that providesuseful methodologies to help healthcenters calculate the componentcosts of care with a focus on costper 5w 2018 Capital Linkwww.caplink.org2
Understanding Your Cost of CareDeveloping the capacity to accurately track, allocate, and compare costs across service linesis an essential tool in the successful management of a health center. 2018 Capital Linkwww.caplink.org3
ComponentsCostofperVisitComponents ofof CostCareAll expenses at the organization can be classified intoone of the following categories: Provider CostDirect Support CostDirect Enabling CostOverhead CostAncillary and Other Cost 2018 Capital Linkwww.caplink.org4
Provider Cost per VisitFour key factors that impact upon provider cost per visitare: CompensationProductivityNon-Clinical ActivitiesProvider Staffing Mix 2018 Capital Linkwww.caplink.org5
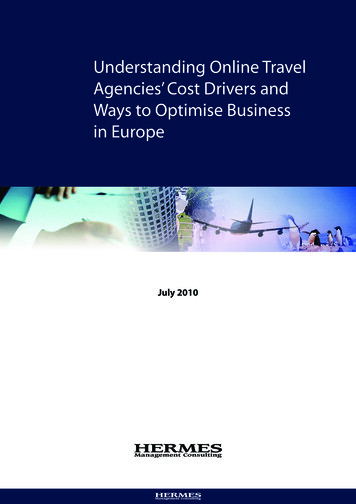
Provider Cost per Visit: ProductivityPhysician TypeTotal SalaryCostTotal VisitsVisits /FTECost per VisitFamily Practice (4 FTEs) 700,00012,3003,075 56.91Internist (1.5 FTEs) 262,5004,4502,967 58.98Pediatrician (2 FTEs) 326,0006,5003,250 50.15OB/GYN (1 FTE) 225,0002,8502,850 78.94 1,513,50026,1003,071 57.98TotalIf Eastside Health Center can increase productivity by 15%, that would result in 30,015 visits.Assuming that salary costs remained the same, the total provider cost per visit woulddecrease to 50.43 – generating an additional 226,600 to be applied to incentivesor other service costs. 2018 Capital Linkwww.caplink.org6
Productivity is an organizationalissue.All staff—from seniormanagement to receptionistand from nurses to specialtyphysicians—are responsible fororganizational productivity. 2018 Capital Linkwww.caplink.org7
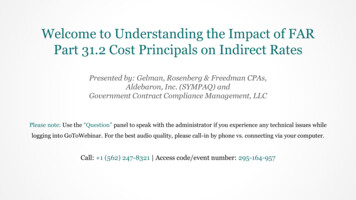
Relative Value UnitsA more accurate way to monitor and evaluate productivity and effort isthrough a Relative Value Unit (RVU) methodology. RVUs measure theintensity and skill level required to provide a service. RVU scales assignnumerical values to procedures and services that reflect their intensity.Physician TypeFamily PracticeAvg.Total Work Avg. WorkAvg. SalaryVisits Per RVUs PerRVUs Per Avg. Salary Per WorkFTE (1)VisitPhysician (2) Per FTE (3)RVU3,0871.594,908 175,000 35.66Internist2,9641.654,891 175,000 35.78Pediatrician3,2511.635,299 163,000 30.76OB/GYN2,8552.406,852 225,000 32.84 2018 Capital Linkwww.caplink.org8
Provider Cost per Visit:Non-Billable FactorsWhen analyzing provider cost per visit, it is necessary to also takeinto account the non-billable factors related to providerperformance, including: Length of Standard WorkweekNumber of Clinic SessionsInpatient and On-Call VisitsClinical TeamsTravel TimeDocumentationContinuing Medical Education (CME) 2018 Capital Linkwww.caplink.org9
Provider Cost per Visit:Provider Staffing MixThe mix of provider staff should be taken into account whenanalyzing provider cost per visit. The chart below illustrates whythis is important:NursePhysicianPractitioner AssistantFamilyPracticePhysicianAvg. % APPto PhysicianAverage Salary 92,000 93,000 %Source: 2016 NACHC Salary Survey and 2016 UDS 2018 Capital Linkwww.caplink.org10
Direct Support Cost per VisitDirect support costs are costs of non-provider staff or items that aredirectly involved in the delivery of healthcare services to patients.These include: Nurses (RNs and LPNs), medical receptionists, medical assistants, andclinical managed care support Direct dental support (includes dental assistants and dentalreceptionists) Mental health support (includes mental health receptionists) Supplies(Note that this is not an exhaustive list—some health centers may employ othersupport staff positions depending upon the major service lines offered.) 2018 Capital Linkwww.caplink.org11
Direct Support Staff Cost per VisitThe major factors that impact the Direct Support StaffCost per Visit include: CompensationProductivityStaffing MixRatio of Support Staff to Providers 2018 Capital Linkwww.caplink.org12
Direct Support Staff Cost per VisitRatio of Support Staff to ProvidersThe health center median in 2017 (UDS) was: 1.89 FTE medical support staff (nurses, other medical personnel)per medical provider FTE;o2.35 for health centers 75th percentile for medical provider productivity.o1.48 for health centers 25th percentile for medical provider productivity 1.23 FTE dental support staff (Dental Assistants, Aides, Techs) perdental provider FTE 0.31 (average) FTE mental health support staff (Other MentalHealth Staff) per mental health provider FTE 2018 Capital Linkwww.caplink.org13
Support Staff Ratios, 2016All Management & Support Staff (1) Per Provider (2)Management & Support Staff Per ProviderFiscal & Billing Staff Per ProviderIT Staff Per ProviderFacility Staff Per ProviderPatient Support Staff per ProviderTotal Administrative, Facility and Patient Support StaffPer ProviderEnabling Staff Per ProviderQuality Improvement Staff per ProviderTotal Non-Clinical Support Staff per ProviderClinical Support www.caplink.orgStaff per Provider 2018 Capital LinkTotal Support Staff per ProviderNational AverageStaff FTEs/Provider 614
Direct Enabling Cost per VisitDirect Enabling Costs are those costs associated with social services orenabling services that are outside of the traditional definition of medicalservices. These services may include: Case Management Eligibility Specialists Patient/Community Education Child Care Programs Outreach Programs Community Health Programs Transportation Other: services outside thescope of the delivery ofprimary care services even ifthese services are consideredmedically necessary Translation Services 2018 Capital Linkwww.caplink.org15
Overhead Cost per VisitOverhead costs include: Rent, interest, and depreciation expense ( other facilities costs)Administrative and facility staff salaries and fringe benefitsMalpractice insuranceOffice supplies, legal/accounting feesOther costs not already classified into a categoryIt does not include costs of resources attributable to categorically grantfunded programs, since these vary across health centers. To avoidduplicating costs in the calculation, it is important to pull out directmedical support staff costs (e.g., medical receptionists) and directenabling staff costs (e.g. transportation workers) from office salaries. 2018 Capital Linkwww.caplink.org16
Overhead Cost per VisitApproximately 70%-75% of health center costs are personnelrelated expenses. Of the remaining 25-30% of costs,approximately 5-10% are facility costs and another 2-5% are otherfixed costs, which are difficult to reduce.On average, the percentage of total costs at a health center thatare accounted for by administrative overhead is between 25%and 40%. Cost reduction considerations include: Productivity Staffing Administrative Staff Compensation Facility Overhead Administrative Overhead 2018 Capital Linkwww.caplink.org17
.only 15-20% of non-personnelcosts are variable and can beimpacted by cost reductionstrategies. Such expenses astelephone, training, and travel donot represent major cost-reductionopportunities for health centers.The significant opportunities forcost reduction are with personnel. 2018 Capital Linkwww.caplink.org18
Overhead Cost per Visit - StaffingThe ratio of administrative to clinical staff mix is critical to the operationsof a health center, but there is no single optimal staffing mix. It isimportant for management to be willing to challenge the administrativeand facility staffing mix and make changes if necessary. Consider: Contracting out vs. direct employment (facility services, billing); Number of administrative supervisory staff and the ratio of supervisors tostaff; Categorize office salaries into functional job categories for evaluation,rather than evaluating the total expense (finance, administrative support,MIS/billing, marketing etc.); Compare average salaries at a health center with local and regional norms; Calculate the percentage of the total budget devoted to administration andto administrative salaries in particular 2018 Capital Linkwww.caplink.org19
Ancillary and Other Cost per VisitAncillary and Other Costs are those costs associated with services that areoutside of traditional primary or specialty care. It is important to note thatwith the growth, diversification and evolution of FQHC services sometraditional ancillary services such as vision and pharmacy can now beconsidered to be their own direct service lines.Typical Ancillary services include: Radiology LaboratoryBe sure to base your calculation on medical visits (as opposed to total visits)unless the center offers both medical radiology and dental radiology services thenseparating those costs and associated visits is appropriate. 2018 Capital Linkwww.caplink.org20
Ancillary Care Cost per VisitDue to the wide variation throughout the country, there is no“standard” set of ancillary services offered at health centers Range of Services ProvidedoOn-Site vs. Off-SiteoAvailability of ServicesoFixed and Variable Costs Utilization of Services Calculation of Costs Quality 2018 Capital Linkwww.caplink.org21
Looking Toward the FutureTeam-Based CareGlobal or Value-Based PaymentsIntegrated Care/ServicesSocial Determinants of HealthPartnerships & Collaborations 2018 Capital Linkwww.caplink.org22
Cost of Care Trends for CommunityHealth Centers, 2012 – 2017 2018 Capital Linkwww.caplink.org23
New Resource Available Nowhttp://go.pardot.com/l/149871/2018-04-23/n9x5w 2018 Capital Linkwww.caplink.org24
Methodology UDS data for all health centers, 2012 – 2017, Tables 5 and 8a Median values for each cost component, by patient, visit and FTEassociated with each service:- Medical- Dental- Behavioral Health- Substance Abuse- Vision- Enabling Services- Other Professional Services- Pharmacy Services- Pharmaceuticals For today’s presentation, also providing some data for small, medium andlarge health centers and urban vs rural health centers 2018 Capital Linkwww.caplink.org25
Medical Cost per Patient - National 2018 Capital Linkwww.caplink.org26
Medical Cost per Visit – National 2018 Capital Linkwww.caplink.org27
Medical Cost per PatientSmall, Medium, Large Health Centers 2018 Capital Linkwww.caplink.orgTrend – last two year average28
Medical Cost per PatientSmall, Medium, Large Health Centers 800 700 600 500 400 300 200 100 020122013Small 2018 Capital d – linear projected29
Medical Cost per VisitSmall Health CentersTrend – last two year average 2018 Capital Linkwww.caplink.org30
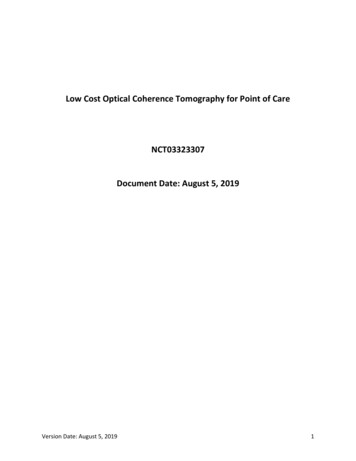
Medical Cost per VisitSmall, Medium, Large Health Centers 250 200 150 11 50 4 18 16 15 68 100 22 21 52 12 12 73 51 4 4 4 58 5 13 13 77 61 54 4 4 4 14 13 56 82 63 3 4 4 22 15 14 59 86 66 4 4 5 15 16 85 61 4 4 15 68 63 5 4 102 90 87 107 94 93 108 99 97 91 87 86 82 75 76 82 81 802012Staff Cost 2018 Capital Link20132014Lab and X-Ray Cost2015Overhead Costwww.caplink.org20162017Other Direct ll 0
Medical Cost per Patient – Rural, Urban 600 500 400 300 200 100 0 42 169 38 175 12 14 42 180 41 185 195 197 209 12 11 213 218 111411 209 211 14 13 13 12 264 268 282 289 303 303 314 311RuralUrbanRuralUrbanRuralUrbanRuralUrban 235 245 249RuralUrbanRuralUrban2013Staff Cost per PatientOverhead Cost per Patient 2018 Capital Link 192 43 47 53 52 14 2582012 46 52 56 542014www.caplink.org201520162017Lab and X-Ray Cost per PatientOther Direct Costs per Medical Patient32
Medical Cost per Visit – Rural, Urban 200 180 160 140 120 100 13 13 13 12 14 15 16 17 17 17 15 17 66 68 67 71 61 63 64 66 56 57 59 74 80 80 83 84 87 90 93 97 97 100 banRuralUrban 52 80 60 40 20 -2012Staff Cost 2018 Capital Link20132014Lab and X-Ray Cost2015Overhead Costwww.caplink.org20162017Other Direct Cost33
600Dental Cost per Dental PatientNational Median 500 400 300 0 169 131 141 149 267 277 289 308 329 339201220132014201520162017 200 100 156 161Dental Facility and Administration Cost per Dental PatientDirect Dental Cost per Dental Patient 2018 Capital Linkwww.caplink.org34
Dental Cost per PatientSmall, Medium, Large Health Centers 650 550 450 350 250 150201220132014Staff and Other Direct Cost per Patient 2018 Capital Linkwww.caplink.org201520162017Overhead Cost per - 50Small 50
Dental Cost per PatientMedium Center 350 300 250 200 150 100 50 02012Staff/Other Direct 2018 Capital Link2013Overhead20142015Staff - Sample centerwww.caplink.org20162017Overhead - Sample center36
Dental Cost per VisitSmall Center 180 160 140 120 100 80 60 40 20 02012Staff and Other Direct 2018 Capital Link2013Overhead20142015Staff/Other Direct - Sample centerwww.caplink.org20162017Overhead - Sample center37
Dental Cost per Dental FTELarge Center 120,000 100,000 80,000 60,000 40,000 20,000 02013Staff and Other Direct 2018 Capital Link2014Overhead20152016Staff/Other Direct - Sample centerwww.caplink.org2017Overhead - Sample center38
Dental Cost per PatientRural, Urban 600 500 400 300 135 129 149 136 153 148 200 100 0 282Rural 257 291UrbanRural2012 268 301 279UrbanRuralUrban2013 156 317 300RuralUrban2014Staff and Other Direct 2018 Capital Link 156www.caplink.org2015 173 167 156 338 319RuralUrban2016 162 362 332RuralUrban2017Overhead39
Mental Health Cost per PatientNational 600 500 400 300 200 100 0 383 1842012 381 2002013 462 446 402 222 21220142015Staff and Other Direct Costs per Patient 2018 Capital Linkwww.caplink.org 470 2312016 2342017Overhead Cost per Patient40
Mental Health Cost per PatientSmall, Medium, Large Health Centers 900 800 700 600 500 400 300 200 100201220132014Staff and Other Direct Costs per Patient 2018 Capital Linkwww.caplink.org201520162017Overhead Cost per Small 0
Mental Health Cost per PatientRural, Urban 800 700 600 500 195 400 179 210 221 193 397Rural 373 399 365UrbanRuralUrban 420 384RuralUrban 481 419 239 227 217 216 200 300 200 246 225 503 435 492 439 100 020122013Rural2014Staff and Other Direct Cost per Patient 2018 Capital an2017Overhead Cost per Patient42
Substance Abuse Cost per PatientNational 1,000 900 297 800 279 700 600 500 195 207 222 233 400 655 300 200 429 421 416201220132014Staff and Other Direct Cost per Patient2015 401 635 100 0 2018 Capital Linkwww.caplink.org20162017Overhead Cost per Patient43
Substance Abuse Cost per VisitNational 180 160 54 140 51 120 100 80 31 33 38 41 60 40 71 72 77 792012201320142015 100 115 20 0Staff and Other Direct Cost per Visit 2018 Capital Linkwww.caplink.org20162017Overhead Cost per Visit44
Substance Abuse Cost per Visit – National 180 160 140 120 100 80 60 40 20 0 77 72 71 312012 332013 100 79 382014 115 51 4120152016 542017Staff and Other Direct CostOverhead CostPoly. (Staff and Other Direct Cost)Expon. (Overhead Cost ) 2018 Capital Linkwww.caplink.org45
Substance Abuse Cost per VisitRural, Urban 200 180 69 160 57 140 120 100 44 42 33 80 28 60 40 87 65 20 -RuralUrban2012 84Rural 69Urban2013 94Rural 40 74 75UrbanRuralUrban2014www.caplink.org 129 113 85Staff and Other Direct Cost 2018 Capital Link 49 43 35 33 492015Rural 94Urban2016Rural 107Urban2017Overhead Cost46
Enabling Services Cost per Patient – National 80 70 60 50 18 40 30 0 23 49 5120162017 19 15 14 20 10 23 27 3020122013 37 3920142015Staff and Other Direct Cost per Patient 2018 Capital Linkwww.caplink.orgOverhead Cost per Patient47
Enabling Services Cost per Visit – National 20 18 16 6 6 13 1320162017 14 5 12 10 8 4 4 6 4 2 0 7 820122013 10 1020142015Staff and Other Direct Cost per Visit 2018 Capital Link 5www.caplink.orgOverhead Cost per Visit48
Enabling Services Cost per PatientRural, Urban 90 80 70 60 50 20 10 0 10 11 36 19RuralUrban2012 22RuralUrban2013 45UrbanRural2014Staff and Other Direct Cost per Patient 2018 Capital Link 46 41UrbanRural 30 28Rural 19 18 14 13 41 25 24 20 18 40 30 28 27www.caplink.org2015 55Urban2016 44Rural 58Urban2017Overhead Cost per Patient49
Enabling Services Cost per VisitRural, Urban 25 20 7 7 15 6 5 5 10 5 4 10RuralUrban2012 10 6RuralUrban2013 12 8RuralUrban 8Rural2014Staff and Other Direct Cost per Visit 2018 Capital Link 5 5 4 3 3 5 0 6www.caplink.org 12 11UrbanRural2015 14Urban 12Rural2016 15Urban2017Overhead Cost per Visit50
Pharmacy Cost per PatientNational 35 30 25 20 15 10 5 0 10.01 9.71 8.97 6.21 5.72 5.50201220132014 11.77 15.62 6.052015Staff and Other Direct Cost per Patient 2018 Capital Linkwww.caplink.org 7.612016 20.41 8.592017Overhead Cost per Patient51
Pharmaceutical Cost per Medical Patient 45 40 35 30 25 20 15 10 5 0 13.90 15.12 17.28201220132014 2018 Capital Link 20.91 26.592015www.caplink.org2016 29.302017Polynomial trendline52
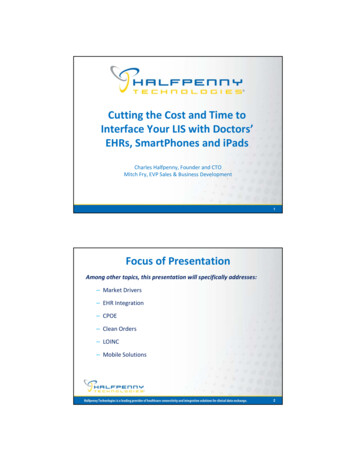
Pharmaceutical Cost per PatientSmall, Medium, Large Health Centers 38.54 40 33.80 35 25.74 25 22.67 19.18 20 15 10 28.71 28.69 30 18.98 13.55 10.47 9.80 9.73 16.76 16.52 14.62 12.42 21.94 21.222012 2018 Capital argeMediumSmallLargeMedium 0Small 5201753
Pharmaceutical Cost per PatientRural, Urban 50 45 40 35 30 25 20 15 10 5 -2012201320142015Rural 2018 Capital Link20162017Urbanwww.caplink.org54
Trends Summary In general, costs on a per patient, visit and FTE basis have continued to rise, butcost increases on an FTE basis (for most services) continue to be much moremodest. Divergence implies that health centers have been intensifying services forpatients without a commensurate increase in per-FTE staffing costs. It appears that health centers’ efforts to control costs may be working and smallcenters are leading the way (perhaps out of necessity). There are some economies of scale apparent in the small/median/large healthcenter comparative data, with small health centers having higher costs perpatient, per-visit and per-FTE for many services, with the exception ofpharmaceuticals and to some extent enabling services. Many of the extended data sets suggest enough year-to-year consistency toallow for a relatively high level of predictability which could be helpful inplanning for rate negotiations. Individual health centers should soon be able to get tailored comparison costreports against a number of relevant cohorts. 2018 Capital Linkwww.caplink.org55
Questions? 2018 Capital Linkwww.caplink.org56
Questions?ContactJonathan ChapmanDave KleiberDirector of CHC Advisory ServicesProject @caplink.orgVisit us Online: www.caplink.org Learn more about our products and servicesDownload our free publications and resourcesRegister for upcoming webinarsSign up for our e-newsletter, Capital InkSubscribe to our blog at capitallinksblog.blogspot.com 2018 Capital Linkwww.caplink.org57
Sep 26, 2018 · Source: 2016 NACHC Salary Survey and 2016 UDS 2018 Capital Link www.caplink.org 11. Direct Support Cost per Visit. Direct support costs are costs of non-provider staff or items that are directly involved in the de