Transcription
HOUSING SP TLIGHTTHE LONGWAITFOR A HOMEVOLUME 6, ISSUE 1 FALL 2016MADE POSSIBLE BY THE GENEROSITY OF
FALL 2016ANDREW AURAND, PH.D., MSWVice President for ResearchNLIHC BOARD OF DIRECTORSDAN EMMANUEL, MSWResearch AnalystChristine Allamanno, Saint Petersburg, FLBrenda J. Clement, Chair, Providence, RIWilliam C. Apgar, Orleans, MADIANE YENTEL, MSSWPresident and CEODara Baldwin, Washington, DCELLEN ERRICOCreative Services ManagerDelorise Calhoun, Cincinnati, OHZOE CHAPINResearch InternLot Diaz, Washington, DCDavid Bowers, Washington, DCEmma “Pinky” Clifford, Pine Ridge, SDChris Estes, Washington, DCBill Faith (Honorary), Columbus, OHGAR MENG LEONGResearch InternDaisy Franklin, Norwalk, CTDora Leong Gallo, Los Angeles, CAKATE RODRIGUESResearch InternMatt Gerard, Minneapolis, MNDeidre “DeeDee” Gilmore, Charlottesville, VAABOUT NLIHCLisa Hasegawa, Washington, DCThe National Low Income Housing Coalition is dedicatedsolely to achieving socially just public policy that assurespeople with the lowest incomes in the United States haveaffordable and decent homes.Moises Loza (Honorary), Washington, DCIsabelle Headrick, Austin, TXFounded in 1974 by Cushing N. Dolbeare, NLIHC educates,organizes and advocates to ensure decent, affordable housingfor everyone.Our goals are to preserve existing federally assisted homesand housing resources, expand the supply of low incomehousing, and establish housing stability as the primary purposeof federal low income housing policy.Housing Spotlight: The Long Wait for a Homeis made possible by the generosity of:The National Low Income Housing Coalition1000 Vermont Avenue, NW Suite 500Washington, DC 20005202-662-1530 www.nlihc.org 2016 National Low Income Housing Coalition2Rachael Myers, Seattle, WAMarla Newman, Baton Rouge, LAAnn O’Hara, Boston, MARobert Palmer, Chicago, ILGreg Payne, Portland, MEEric Price, Washington, DCTara Rollins, Salt Lake City, UTMichael Steele, New York, NYMartha Weatherspoon, Clarksville, TNNLIHC STAFFAndrew Aurand, Vice President for ResearchJosephine Clarke, Executive AssistantDan Emmanuel, Research AnalystEllen Errico, Creative Services ManagerEd Gramlich, Senior AdvisorSarah Jemison, Housing Advocacy OrganizerPaul Kealey, Chief Operating OfficerJoseph Lindstrom, Senior Organizer for HousingAdvocacySarah Mickelson, Policy DirectorKhara Norris, Director of AdministrationJames Saucedo, Housing Advocacy OrganizerChristina Sin, Development CoordinatorElayne Weiss, Senior Policy AnalystRenee Willis, Vice President for Field andCommunicationsDiane Yentel, President and CEOCover Design by Ariel Chu, Summer Graphic Design Intern.Design and Layout by Ellen ErricoNATIONAL LOW INCOME HOUSING COALITION HOUSING SPOTLIGHTFALL 2016HOUSING SPOTLIGHT:The Long Wait for a HomeEXECUTIVE SUMMARYTdocument the current state of waiting lists, NLIHChe Public Housing and Housing Choicesurveyed PHAs in the Fall of 2015 and Winter ofVoucher (HCV) programs provide essential2016. Three hundred twenty PHAs responded withaffordable housing to some of the nation’scomplete surveys, representing a diversity of size,most financially vulnerable households. Fortylocation, and metropolitan status.percent of new public housing admissions and 75%of new voucher holders each year are required toSurvey data paint a bleak picture of waiting listsbe extremely low income (ELI) households, whoclosed to new applicants and long waits for housingearn no more than 30%assistance. Key findingsof their area’s medianinclude:income (AMI) or the Fifty-three percent offederal poverty guideline,CLOSEDWAITINGLISTSHCV waiting lists werewhichever is higher.closed to new applicantsSeventy-one percent of theAND LONG WAITS FORfor housing assistance.nearly 1.1 million publicSixty-five percent of HCVHOUSING ASSISTANCEhousing households andwaiting lists closed to the74% of the 2.2 millionMAKECLEARTHATWEgeneral public had beenHCV recipient householdsclosed for at least oneare ELI (HUD, 2015).MUST EXPAND HOUSINGyear.The housing resourcesRESOURCES FOR OUR Eleven percent ofavailable to ELI renterspublic housing waitinghowever are insufficient.NATION’S LOWESTlists were closed to newThe private and subsidizedINCOME RENTERS.applicants. Thirty-sevenrental markets makepercent of public housingavailable only 3.2 millionwaiting lists closed to theaffordable homes for thegeneral public had beennation’s 10.4 million ELIclosedforatleastoneyear.renter households, resulting in a national shortageof 7.2 million rental homes (NLIHC, 2016). ELI The median HCV waiting list had a wait time ofhouseholds face a long wait for housing assistance.1.5 years. Twenty-five percent of HCV waitingUnable to find affordable housing, 75% of ELI renterlists had a wait time of 3 years or longer.households are severely cost burdened, spending The median public housing waiting list had a waitmore than 50% of their income on housing costs andtime of 9 months. Twenty-five percent of publicleaving little money for other necessities (NLIHC,housing waiting lists had a wait time of 1.5 years2016).or longer.The last nationwide survey of Public Housing ELI households accounted for nearly 74% ofAgencies (PHAs) regarding their public housing andhouseholds on the average HCV waiting list andvoucher waiting lists was conducted in 2012. Sincemore than 67% of households on the typicalthen, rental affordability has worsened, squeezingpublic housing waiting list.ELI renters even further out of the private market. ToNATIONAL LOW INCOME HOUSING COALITION HOUSING SPOTLIGHT3
FALL 2016 Families with children accounted for 60% ofhouseholds on the average HCV waiting list and46% of households on the typical public housingwaiting list. Seniors comprised the most common type ofhousehold on 15% of the public housing waitinglists for which these data were provided.Closed waiting lists and long waits for housingassistance make clear that we must expand housingresources for our nation’s lowest income renters.Legislation introduced in the 114th Congress wouldincrease investments in vouchers, public housing,and other housing programs. While these bills havenot yet moved forward in the legislative process,we encourage members of the upcoming 115thCongress to reintroduce and pass these bills. ThePathways out of Poverty Act (H.R. 2721) and theCommon Sense Housing Investment Act (H.R. 1662)4propose modest changes to the mortgage interestdeduction (MID) that would generate more than 200 billion in savings over ten years to be investedin vouchers, public housing capital improvements,and the national Housing Trust Fund (HTF) tobetter serve the nation’s most financially vulnerablerenters. A third bill, the Ending Homelessness Actof 2016 (H.R. 4888) would provide funding for anadditional 295,000 to 300,000 HCVs over five yearsfor homeless individuals and families. The AffordableHousing Credit Improvement Act of 2016 (S. 3237)would provide incentives for ELI rental housing inthe Low Income Housing Tax Credit program, thelargest affordable housing production program in thecountry.These policy changes, and others like them, couldend housing poverty and homelessness once and forall by providing the resources necessary for every lowincome family to afford a home.NATIONAL LOW INCOME HOUSING COALITION HOUSING SPOTLIGHTFALL 2016INTRODUCTIONTare severely cost burdened, spending more than 50%he Public Housing and Housing Choiceof their income on housing costs and leaving littleVoucher (HCV) programs provide essentialmoney for other necessities (NLIHC, 2016).affordable housing to some of the nation’s mostfinancially vulnerable households. Public housingLocal data paint a bleak picture of long waits forconsists of rental homes operated and maintainedhousing assistance. The Charlotte Housing Authorityby Public Housing Agencies (PHAs), which rentin North Carolina, for example, has more thanthem directly to qualified low-income applicants.31,000 applicants on its HCV waiting list, yet onlyTenants typically pay 30% of their income toward200 to 240 vouchers become available every year torent, and the PHA covers the remaining cost withnew recipients (Clark & Kemp, 2015). In Baltimore,federal funds. The HCV program provides vouchers74,000 applicants applied for a chance at getting onto households who cana waiting list of 25,000 foruse them to rent modesta voucher. Only 1,000 tohousing from landlords1,500 vouchers becomein the private market.ONLY 3.2 MILLIONavailable in Baltimore eachVoucher holders typicallyyear (Wenger, 2014). AtAFFORDABLE HOMESpay 30% of their monthlythat pace, it would takeincome toward the rent,more than 16 years to offerARE AVAILABLE FOR THEand federal funding payshousing assistance to thethe remaining rent up to10.4 MILLION ELI RENTERhouseholds lucky enougha payment standard basedto get on the wait list.HOUSEHOLDS IN THE U.S.,on HUD’s Fair MarketA 2012 survey indicatedRent (FMR).RESULTING IN A NATIONAL that 2.8 million familiesForty percent of newnationwide were on HCVSHORTAGE OF 7.2public housing admissionswaiting lists and moreand 75% of new voucherthan 1.6 million wereMILLION RENTAL UNITS.holders each year areon public housing listsrequired to be extremely(PAHRC, 2015). Thelow income (ELI)actual number of familieshouseholds, who earn no more than 30% of theirin need of housing assistance is even higher, becausearea’s median income (AMI) or the federal povertymany eligible families can’t apply. As of 2012, 48% ofguideline, whichever is higher. The nearly 1.1 millionHCV waiting lists and 6% of public housing waitingpublic housing households have an average incomelists were closed to new applicants (Dunton, Henry,of 14,368. Seventy-one percent are ELI (HUD,Kean, & Khadduri, 2014).2015). The nearly 2.2 million HCV households haveNo regularly updated source of national waiting listan average income of 13,821. Seventy-four percentdata exists. The last nationwide survey of PHAs wasare ELI (HUD, 2015).conducted in 2012. Since then, rental affordabilityThe housing resources available for ELI rentershas worsened, squeezing ELI renters even furtherhowever are insufficient. Only 3.2 million affordableout of the private market. To document the currenthomes are available for the 10.4 million ELI renterstate of HCV and public housing waiting lists, NLIHChouseholds in the U.S., resulting in a nationalsurveyed PHAs in the Fall of 2015 and Winter ofshortage of 7.2 million rental units. Unable to find2016.affordable housing, 75% of ELI renter householdsNATIONAL LOW INCOME HOUSING COALITION HOUSING SPOTLIGHT5
FALL 2016FALL 2016Table 2. Not Reporting Household Characteristics of Waiting ListTable 1. PHA Size DistributionPHA SizeSample (n 320)All PHAsaLess than 300 units46.2% (148)60.2 %Cannot provide information300 to 499 units10.6 % (34)11.0 %500 to 999 units15.3 % (49)12.0 %Reason information cannot be provided(of PHAs who cannot provide)a:1,000 to 2,999 units16.9 % (54)11.2 %3,000 to 4,999 units3.8 % (12)2.4 %5,000 or 9,999 units3.1 % (10)1.8 %10,000 or more units4.1 % (13)1.3 %a. Source: HUD, 2015The survey asked questions about waiting list size,status, wait times, and household composition forNLIHC sent an initial email in October 2015 to PHAsboth vouchers and public housing. The responsesmanaging public housing or HCVs, inviting themprovide a picture of the households waiting forto participate in a web-based survey. A follow-uphousing assistance, but not a precise estimate of theemail was sent two weekscountry’s housing needs.later. Further outreachFirst, PHAs manage theirwas conducted throughlists in a variety of ways,national and state PHAmaking a precise estimateumbrella organizations.of housing needs difficultTHE SURVEY ASKEDThe convenience sample ofto obtain. Some PHAs320 PHAs who completedQUESTIONS ABOUT WAITINGclose their waiting lists tothe survey were diverse innew applicants after theirLIST SIZE, STATUS, WAITsize, metropolitan status,list reaches a certain size.TIMES, AND HOUSEHOLDand location, but largerWhere they are unable toand metropolitan PHAsapply, households whoCOMPOSITION FOR BOTHwere overrepresented.may qualify for assistanceVOUCHERS AND PUBLICPHAs managing morewill be undercounted.than 5,000 public housingOther PHAs keep theirHOUSING.units and voucherslists open, but regularlycombined account forpurge households who3% of all PHAs, but 7%cannot be reached.of our sample (TableSecond, not all qualified1). Metropolitan PHAshouseholds apply for vouchers or public housing.account for 53% of all PHAs, but 64% of our sample.Third, applicants can apply to multiple PHAs atWe applied sample weights based on the response sizethe same time, which may improve their chanceswithin each size and metropolitan status stratum1 tofor assistance. Applicants are also able to apply forestimate the total waiting list population and presentboth vouchers and public housing. Households onresults that better represent the universe of PHAs.multiple waiting lists will be counted more than once.6IncomeRaceHousehold Type36.2%29.0%29.2%Software limitations49.1%52.4%56.3%Lack of staff time to report data30.6%31.2%26.6%Does not ask applicants thisinformation21.8%17.9%15.6%IncomeRaceHousehold Type35.0%27.1%17.8%Software limitations52.5%53.9%61.6%Lack of staff time to report data28.7%21.7%35.5%Does not ask applicants thisinformation13.8%21.7%3.4%Public HousingCannot provide the informationMETHODOLOGY1Housing Choice VouchersSize strata were 100 units, 100 to 299 units, 300 to 499 units, 500to 999 units, 1,000 to 2,999 units, 3,000 to 4,999 units, 5,000 to9,999 units, and 10,000 or more units. Within each size stratum,PHAs were identified as metropolitan, micropolitan, or neither.REPORTING CAPACITYPHAs could not provide data for at least one of threeNATIONAL LOW INCOME HOUSING COALITION HOUSING SPOTLIGHTReason information cannot be provided(of PHAs who cannot provide)a:a. Percentages can sum to more or less than 100%. Some respondents provided more than one reason and a small number ofrespondents did not provide a reason.household characteristics (income, race, or householdtype (i.e., family with children, elderly, householdwith at least one person with a disability) for 45% ofHCV waiting lists and 46% of public housing waitinglists. Of PHAs with HCV waiting lists, 36% could notreport income, 29% could not report race, and 29%could not report household type (Table 2). Of PHAswith public housing waiting lists, 35% could notreport income, 27% could not report race, and 18%could not report household type.often change during the lengthy wait, so they donot verify income until the applicant is at or close tothe top of the waiting list. With regard to householdtype, some PHAs ask about family size, and notcomposition, at the time of application and verifyhousehold type only when housing assistance isavailable.The primary reason for PHAs’ inability to providecomplete household information were limitationson their software capability and staff time. Themajority said that their database managementsoftware did not store the information, or did notmake an aggregation of waiting list data easy toobtain.A minority of PHAs do not ask for or requirehousehold income at the time of initial application,preferring to wait until housing assistance is available,and another small number questioned the accuracy oftheir income information. Household circumstancesNATIONAL LOW INCOME HOUSING COALITION HOUSING SPOTLIGHT7
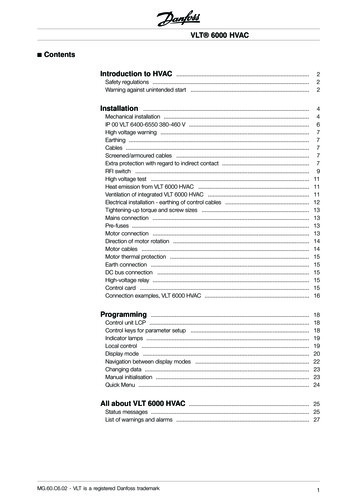
FALL 2016FINDINGSSTATUS OF WAITING LISTSFifty-three percent of HCV waiting lists wereclosed and another 4% were open only to oneor more specific populations (Figure 1), such ashomeless individuals and families, veterans, personswith a disability, or persons with local residency.Sixty-five percent of the HCV waiting lists closed tothe general public had been closed for at least oneyear, 50% had been closed for at least 1.5 years, and13% had been closed for at least five years. More thanhalf of the PHAs with a closed HCV list did not thinkit would reopen over the next year.FALL 2016housing waiting lists nationwide. The averageHCV waiting list consisted of 2,013 households,a number heavily influenced by large PHAs andthose with long waiting lists. The median HCVwaiting list had 256 households, still a significantnumber given that the median PHA managesonly 316 vouchers.2 Twenty-four percent of HCVwaiting lists included more than 1,000 households,approximately 10% had 5,400 or more households,and 5% had at least 11,520 households. The largestwait list in the sample consisted of more than40,000 households.3Figure 1a:Housing Choice VouchersFigure 1b:Public Housing11.4%4.0%18 monthsMedian timeclosed listshave beenclosed53.3%43.1%65%Percentof closedlists closedfor at least1 year6 monthsMedian timeclosed listshave beenclosed84.7%37%Percentof closedlists closedfor at least1 year3.6%OpenOpen to specific populationsClosedOpenOpen to specific populationsClosedEleven percent of public housing waiting lists wereclosed, and another 4% were open only to specificpopulations, typically seniors, families, and personswith a disability. Half of the waiting lists closed to thegeneral public had been closed for at least six months,37% had been closed for at least one year, and 15%had been closed for at least 2 years. Approximatelyone-third of PHAs with a closed public housingwaiting list did not think it would reopen over thenext year.Small PHAs with fewer than 300 units of publichousing and vouchers combined had an averageHCV waiting list of 87 households, while the largestPHAs with more than 5,000 units had an averageHCV waiting list of 12,736 households (Figure 2a).Approximately twenty percent of the largest PHAs hada waiting list of at least 19,000 households. Across allSIZE OF WAITING LISTS3Millions of households are on HCV and public82Calculated from HUD (2015) A Picture of Subsidized Households.Waiting lists larger than 40,000 are rare. The largest PHA, NewYork City Housing Authority, has more than 148,000 families onits HCV waiting list and 263,000 families on its public housingwaiting list (NYCHA, 2015).NATIONAL LOW INCOME HOUSING COALITION HOUSING SPOTLIGHTPHA size categories, the average number of householdson the HCV waiting lists was larger than the median,indicating some PHAs had significantly longer waitinglists relative to others in their size group.housing units combined was 36 months for a voucher.Twenty-five percent of large PHAs had a wait time ofat least 84 months (7 years). PHAs’ ability to servehouseholds on their waiting list is constrained by theslow turnover of voucher recipients and inadequatefunding.The average public housing waiting list included 834households. The median waiting list consisted of 57households, once againa significant numberFigure 2a: Households onwhen approximatelyHousing Choice Voucher Waiting Listshalf of PHAs have fewer14,000than 100 public housing12,736units.4 More than 11% of12,000public housing waitinglists included at least10,0001,000 households. Theaverage size of public7,7288,000housing waiting lists was6,09096 households for small6,000PHAs and 12,986 for thelargest PHAs (Figure 2b).4,0003,476WAIT TIMESWait times are longerfor vouchers than forpublic housing. PHAsadministering vouchersreported a median waittime of 18 months, or1.5 years, on their HCVwaiting list (Figure 3a).Twenty-five percent ofHCV waiting lists had await time of 36 months(3 years) or longer. Themaximum reported waittime was 15 years.The largest PHAstended to have longerwait times. The medianwait time among PHAswith more than 5,000vouchers and public3,1020Calculated from HUD(2015) A Picture ofSubsidized Households.25651All PHAs87Less than 300units187 542300300 to 499units1,007 978500 to 999unitsMedian1,000 to 2,999 3,000 to 4,999unitsunits5,000 or moreunitsAverageFigure 2b: Households onPublic Housing Waiting ,2372,102 2,2252,000042,0132,00057834All PHAs31 96193 270Less than 300units300 to 499units274736500 to 999unitsMedianNATIONAL LOW INCOME HOUSING COALITION HOUSING SPOTLIGHT8001,000 to 2,999 3,000 to 4,999unitsunits5,000 or moreunitsAverage9
FALL 2016times of at least 51 months (4.25 years).PHAs reported a median time of 9 months on theirpublic housing waiting lists (Figure 3b). Twentyfive percent of public housing waiting lists had await time of at least 18 months (1.5 years). Thelargest PHAs had a median wait time of 24 months(2 years) and twenty-five percent of them had waitFigure 3a: HousingMonths9080706050403636302024180Several PHAs commented that the number ofbedrooms a household needed was an importantfactor in the wait time for public housing. Of thePHAs who commented, 34% indicated a longerwait for family housingand 25% indicated aChoice Voucher Wait Timelonger wait for onebedroom units. Theothers were ambiguous84as to the length of waitby apartment size.The need for specific60apartment sizes isdependent on the local47area’s demographics andhousing market, as well36as the mix of housing28offered by the PHA.18All PHAsLess than 300units25141210FALL 2016300 to 499unitsMedianWAITING LISTCOMPOSITION12500 to 999units1,000 to 2,999units3,000 to 4,999units5,000 or moreunits75th PercentileFigure 3b: Public Housing Wait TimeMonths9080706060515040302010019189All PHAs712Less than 300units122424241810300 to 499unitsMedian1024500 to 999units1,000 to 2,999units75th Percentile3,000 to 4,999units5,000 or moreunitsThe average incomedistribution for HCVwaiting lists was 74%ELI households, 18%very low income (VLI)households with incomebetween 31% and 50% ofAMI, and 6% low income(LI) households withincome between 51% and80% of AMI (Figure 4a).Larger PHAs on averagehad a higher percentageof ELI households ontheir HCV waiting liststhan smaller ones.The average incomedistribution of publichousing waiting listswas 67% ELI, 19% VLI,and 12% LI households(Figure 4b). Large PHAshad a significantly poorerNATIONAL LOW INCOME HOUSING COALITION HOUSING SPOTLIGHTwith a higher proportion of white residents, whilelarge PHAs served jurisdictions with a smallerproportion.population on their public housing waiting lists thansmaller PHAs. The average income distribution ofpublic housing waiting lists among the largest PHAswas 86% ELI and 11% VLI, while the average list ofthe smallest PHAs was 65% ELI and 20% VLI.The racial and ethniccomposition of waitinglists varied for PHAsof different sizes. Theaverage HCV waiting listwas 47% white, 37%,black, and 10% Hispanic(Figure 5a). The largestPHAs’ HCV waiting listswere on average lessracially diverse and lesswhite. They were onaverage 19% white, 66%black, and 7% Hispanic.Public housing waitinglists were on average58% white, 31% black,and 8% Hispanic(Figure 5b). Thesmallest and largestPHAs had the leastdiverse lists, but withdifferent populations.The average racial andethnic compositionamong small PHAs was66% white, 25% black,and 7% Hispanic. Theaverage racial and ethniccomposition among largePHAs 20% white, 69%black, and 3% Hispanic.The differences in racialand ethnic compositionof waiting lists acrossdifferently sized PHAsis partly a function ofdemographics. SmallPHAs on average werelocated in jurisdictionsAcross all PHA sizes however black low incomehouseholds appear overrepresented on waiting lists,Figure 4a: Housing Choice Voucher Waiting ListsAverage Income %10%0%23%18%17%16%8%6%5%Less than 500 unitsAll PHAsELI( 30% AMI)3%500 to 999 unitsVLI(31% to 50% AMI)15%1,000 to 2,999 units2%3,000 or more unitsLI(51% to 80% AMI)Figure 4b: Public Housing Waiting ListsAverage Income 0%20%10%0%20%19%12%All PHAs20%14%Less than 500 unitsELI( 30% AMI)16%10%500 to 999 unitsVLI(31% to 50% AMI)NATIONAL LOW INCOME HOUSING COALITION HOUSING SPOTLIGHT5%1,000 to 2,999 units11%3%3,000 or more unitsLI(51% to 80% AMI)11
FALL 2016FALL 2016while white and Hispanic low income householdsappear underrepresented. The average racialdistribution of all very low-income and extremelylow-income renters in jurisdictions with PHAsthat administeredvouchers was 61%Figure 5a: Housing Choice Voucher Waiting Listswhite, 18% black andAverageRaceandEthnicDistribution16% Hispanic5, but the70%66%average voucher waitinglist was 47% white,60%57%37% black and 10%Hispanic. The average49%50%47%racial distribution of45%very low-income and39%40%37%36%extremely low-incomerenters in jurisdictions30%with public housing26%was 67% white,19%20%20% black, and 11%13%Hispanic, but the10%9%10%8%average PHA public7%7%4%4%3%housing waiting list was1%1%1% 2%1%1%0%58% white, 31% black,Less than 500 units500 to 999 units1,000 to 2,999 units3,000 or more unitsAll PHAsand 8% Hispanic. ThisWhiteBlackHispanicNative AmericanOtherpattern existed acrossNote: Percentages do not add up to 100%, because a category for “unknown” is omittedall PHA sizes, but wasless pronounced amongthe smallest PHAs.Figure 5b: Public Housing Waiting ListsAverage Race and Ethnic %31%25%20%20%10%0%12%8%2%All PHAs11%7%1% 2%1%Less than 500 unitsWhiteBlack500 to 999 unitsHispanic1%4%1,000 to 2,999 unitsNative American3%1%5%3,000 or more unitsOtherNote: Percentages do not add up to 100%, because a category for “unknown” is omitted.12The average householddistribution on HCVwaiting lists was 60%families with children,11% seniors, and 18%households with atleast one person with adisability (Figure 6a). Thedistribution was fairlyconsistent across PHAsof different size. Waitinglists of public housingwere more diverse withan average distributionof 46% families with5 Calculated from HUD (2016)Comprehensive HousingAffordability Strategy (CHAS)Data, 2009-2013 ACS 5-yearaverage.NATIONAL LOW INCOME HOUSING COALITION HOUSING SPOTLIGHTchildren, 24% seniors, and 19% households with atleast one person with a disability (Figure 6b).The housing stockmanaged by PHAs mayinfluence the types ofhouseholds on theirpublic housing waitinglists. Recent researchindicates that publichousing is more likelythan private markethousing to providea minimum levelof accessibility forpeople with moderatemobility challenges(Chan & Ellen, 2016).In addition, PHAsoften manage housingdesignated specificallyfor the elderly, whichmay explain the higherproportion of elderlyhouseholds on publichousing waiting liststhan HCV lists. Seniorswere the dominanthousehold type on15% of public housingwaiting lists for whichdata were available,compared to 1% of HCVwaiting lists. Similarly,households with atleast one person witha disability were thedominant householdtype on 11% of publichousing waiting lists.POLICYIMPLICATIONSWe must expand ourhousing resources for thenation’s most vulnerablerenters. Despite the significant need, Public Housingreceived 1.6 Billion less in 2016 than in 2010, capitalFigure 6a: Housing Choice Voucher Waiting ListsHousehold Type Distribution70%60%61%61%60%62%59%50%40%30%20%All PHAs10%Less than 500 unitsFamilies with Children20%17%13%11%10%0%19%18%10%500 to 999 unitsElderly18%9%1,000 to 2,999 units3,000 or more unitsAt least 1 person w/ disabilityNote: Percentages do not add up to 100% because “other” and “unknown” categories areomitted.Figure 6b: Public Housing Waiting ListsHousehold Type %20%25%25%20%19%21%17%13%10%0%All PHAsLess than 500 unitsFamilies with Children500 to 999 unitsElderly1,000 to 2,999 units3,000 or more unitsAt least 1 person w/ disabilityNote: Percentages do not add up to 100% because “other” and “unknown” categories areomitted.NATIONAL LOW INCOME HOUSING COALITION HOUSING SPOTLIGHT13
FALL 2016funding used to repair and renovate the public housingstock has declined by 53% since 2000, and HCVfunding has not yet returned to pre-sequestration levels(CBPP, 2016).A combination of vouchers and affordable housingcapital investment is critical. Vouchers are animportant tool for meeting the housing needs of ELIrenters, with proven success in ending homelessnessand housing insecurity. Funding for the HousingChoice Voucher program should be significantlyexpanded to meet the existing need. Vouchers may,however, be difficult to use in high demand housingmarkets where landlords have more potential tenants.Landlords may reject vouchers because of limitedprogram knowledge, an unwillingness to deal withthe program’s inspections, or outright discriminationagainst voucher holders (Graves, 2016). Voucherrecipients with a disability or those who are seniorsmay face challenges in finding accessible housing, asrental housing in the private market is less likely thanpublic housing to be accessible (Chan & Ellen, 2016).It is equally important to increase capital dollars forthe production, preservation and rehabilitation ofrental homes affordable to the lowest income people.The national Housing Trust Fund (HTF) was createdin 2008 precisely to meet this need; it is the first newhousing program in more than 26 years that is focusedsolely on the nation’s poorest renters. The HTF’s firstnationwide funding allocation of 174 million willbe distributed to states this fall. At least seventy-fivepercent of HTF funds must benefit ELI households,and 100% must benefit them while the HTF iscapitalized under 1 Billion. To meet the existing need,the HTF should be significantly expanded.Legislation introduced in the 114th Congress wouldincrease much needed investments in the HTF,vouchers, public housing, and other housing programs.While these bills have not yet moved forward in thelegislative process, we encourage members of theupcoming 115th Congress to reintroduce and pass thesebills. The Pathways out of Poverty Act (H.R. 2721),introduced by Barbara Lee (D-CA), and the CommonSense Housing Investment Act (H.R. 1662), introducedby Keith Ellison (D-MN), propose modest changesto the mortgage interest deduction (MID) that wouldprovide funds for both vouchers and public housing.14The bills would reduce the mortgage amount eligiblefor a federal tax brea
Kean, & Khadduri, 2014). No regularly updated source of national waiting list data exists. The last nationwide survey of PHAs was conducted in 2012. Since then, rental affordability has worsened, squeezing ELI renters even further out of the private market. To document the current state of HCV and public housing waiting lists, NLIHC