Transcription
*DE01933982X*FRO301255tovsU.S. Experience with Hydrazine and Flow-Accelerated CorrosionM. MERILOD. MUNSONEPRIMICHEL celerated corrosion (FAC) has been studied intensely for the last 30 years. In most regards, theparametric behavior of FAC has been well understood since the eighties. However, recent experience showingthe impact of hydrazine has challenged this understanding.Until the early 1990s, hydrazine levels at most U.S. PWRs had been low, typically around 20 ppb. Since the mid1990's the U.S. trend has been to increase hydrazine concentration 1 00 ppb) to provide further protection thesteam generators tubes from stress corrosion cracking. In the last five years, high concentrations of hydrazinehave been shown in the laboratory to affect the rate of FAC. These experiments have demonstrated this effectalthough there remains considerable scatter in the data supporting this conclusion. It is believed that the impactof hydrazine is due to the change in the oxidizing-reducing potential of the solution, but there is no generallyaccepted theory to completely describe its behavior.Recently, plant experience has begun to support the laboratory data that high hydrazine does increase the rateof FAC. It should be noted that there are several factors affecting the rate of FAC. Since most plants havechanged their water chemistry in recent years, it has been difficult to "back-out" the influence of hydrazine. Butnow, plant experience has clearly shown the impact of high hydrazine especially in the high temperatureportions of the feedwater piping. This has been seen at two PWRs, discussed below, and perhaps at severalothers. This accelerated thinning of the feedwater piping is especially significant since feedwater piping isparticularly expensive to inspect and to replace.In addition to the experience with piping, there has also been degradation reported in steam generators,particularly at Gravelines in France, possibly linked to high hydrazine.In order to deal with this issue, the EPRI computer program CHECWORKS was modified in 1998 to determinethe local hydrazine concentration in the liquid phase throughout the secondary system. Also, a model to predictthe impact of hydrazine on FAC was developed and included in the CHECWORKS corrosion rate formulation.These are discussed below as is future potential changes to the FAC model in CHECWORKS to reflect themost recent laboratory data and plant experience.IntroductionFlow-accelerated corrosion (FAC) is a continuing problem in nuclear and fossil power plants. In spite of theprogress made in the last 15 years in reducing the rate of FAC, leaks and the occasional failure are stilloccurring. Costly inspection programs are continuing to identify the need for replacements.FAC is a degradation process that affects carbon and low-alloy steels under specific conditions of temperatureand water chemistry. Unfortunately, these particular conditions are often found in power plants. FAC results inlarge areas of thinning (as opposed to local attack such as pitting). These thinned areas may eventually rupturecausing a catastrophic failure of the piping component. Ruptures have resulted in fatalities at the Surry NuclearPlant and at the Pleasant Prairie Power Plant (see Reference 1). In addition to the human cost, thinning causedby FAC has required numerous repairs and replacements, costly inspection programs, and unscheduled plantoutages. Referenceis a comprehensive reference on FAC.
Many years of study have established that the rate of FAC depends on a number of variables. These parametricdependencies are described in detail in Reference 1. For convenience, these variables can be divided up asfollows:Hydrodynamic - flow rate, temperature, geometry, and steam quality.Alloy content - amount of chromium, copper and molybdenum contained in the steel.Water chemistry - pH at operating temperature, oxygen and hydrazine concentrations.Prior to about 1995, the modeling approach taken by EPRI was to correlate the rate of FAC with thehydrodynamic and alloy content parameters mentioned above. The role of water chemistry was includedthrough two parameters: Dissolved oxygen - the rate of FAC was correlated with the amount of oxygen dissolved in theliquid phase. The oxygen factor was normally unity for PWR conditions and varying but normallyless than unity for most BWR lines. Hot pH - the pH at temperature was correlated with the rate of FAC. This pH was determinedknowing the concentration of any pH control chemicals present.Before discussing how hydrazine was treated in CHECWORKS prior to 1998, the uses of hydrazine will beintroduced.Hydrazine (1\121-14) is a chemical that is commonly added to the secondary circuit of PWR nuclear power plantsand to fossil power plants. In PWR plants, it is primarily used as a scavenging agent (remove oxygen) and tocreate reducing conditions in the steam generators. Such conditions are believed to help suppress intergranularstress corrosion cracking of inconel steam generator tubes.Until the mid to late 1990s, most U.S. PWRs operated with relatively low concentrations of hydrazine (e. g., 20ppb). These were also the conditions that formed the basis for the empirical equations for FAC that are found inCHECWORKS (Reference 2). However, beginning in the early to mid 1990s, many nuclear plants began toincrease their concentration of hydrazine in order to provide further protection to the steam generator tubes.The CHIECWORKS project was alerted to the possible ramifications of high hydrazine in the 1997 timeframefrom two sources:1. Dr. Barry Dooley, EPRI's fossil plant cycle chemistry expert, began to champion the use of"hydrazine-less" water chemistry in fossil plants that had an all ferritic condensate and feedwatersystems. The use of such chemistries was found to reduce the iron transport rate to the boiler by afactor of 2 or 3 (Reference 1). It should be noted that, in many fossil plants the only measurement ofFAC - direct or indirect - is the iron transport measurements, and2.Based on some historical information (References 3 4), researchers at EDF were concerned thathigh hydrazine could potentially increase FAC rates and ran a series of tests at the CIROCO loop toinvestigate the effect (Reference 5). Additionally, theoretical considerations indicated that FACmight be related to hydrazine to the 16 power.At this time, EPRI became concerned that the CHECWORKS predictions might be non-conservative for thehigher hydrazine concentrations, particularly in cases where a plant had recently increased the hydrazineconcentration. Such increases to the corrosion rates would not be immediately detected by plant inspections.Similarly, plant FAC wall loss data that was being trended by utilities might also be non-conservative in caseswhere the hydrazine concentration was recently increased (trending data is relying on the relationship of pastinspection data to project future behavior without the use of an analytical model such as CHECWORKS).Prior to 1998, CHECWORKS had an implicit assumption of feedwater hydrazine levels of about 20 ppb. Thehydrazine was considered in the modeling, but only, to the extent that the hydrazine reaction with oxygenreduced the feedtrain oxygen. The hydrazine was not tracked after it reached the steam generator as it wasassumed that it was all decomposed within the steam generator. Note, the amount of ammonia generated bythe decomposition of hydrazine was negligible compared with the amount of ammonia already present.With the advent of'high hydrazine'chemistry, CHECWORKS was revised in 1998 to:determine the hydrazine concentration throughout the entire steam/feeedwater circuit.calculate the decomposition of hydrazine in the feedtrain, the steam generators and the moistureseparators, and the resulting ammonia generatedadd a hydrazine factor to account for the effect of hydrazine on the rate of FAC.
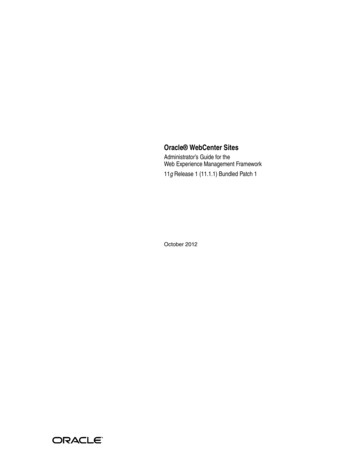
The hydrazine factor was developed using plant data from American and Japanese plants that operated on highhydrazine, theoretical considerations, and from consideration of iron transport data from fossil plants operatingwith zero hydrazine. The hydrazine factor thus developed is presented in Figure 1. The form of the hydrazinedependency is similar to the curve later determined by EDF from their laboratory data (see below). Both curvesshow that the rate of FAC increases with hydrazine to about 150 ppb at which case hydrazine begins to loseinfluence and the curve falls back to unity at about 500 ppb.Single-Phase Hydrazine Factor2.5 0 2.0LL1.N1 .00)C- ' 0.50.00100200300400500Hydrazine - ppbFigure I - Hydrazine Factor used in CHECWORKSThe above hydrazine model was coded in CHECWORKS Version 1.OF in 1998 and continued into Version1.OG, which was released in 1998. Shortly thereafter mid-1 999), EDF released laboratory results that showedthat there was a temperature below which the hydrazine concentration did not influence the rate of FAC. Thisprompted EPRI to reexamine the available plant data. Based on this evaluation, a near-term decision wasmade not to include the temperature dependency at this time. The logic was that adding a "cut-in temperature"only slightly improved comparisons of predictions to plant inspection data. This slight improvement was offsetby the desire to keep the predictions conservative by leaving out the temperature dependency,Laboratory WorkWith this as background, a short summary of the pertinent experimental work done in this area is presentedbelow.The earliest significant work done in this area were by Ducreux (Reference 3) and Woolsey (Reference 4) in the1980's. At the time, these works were not terribly important in that most U.S. plants ran at low levels ofhydrazine (- 20 ppb). Also in this period, the attention in the water chemistry community was focused on otherareas, especially changing the pH control amine from ammonia to an amine that would better protect bothsteam and water portions of the balance of plant piping.It was not until the mid-90s that attention was focused on the role of hydrazine on FAC. As mentioned above,there were several factors that caused this shift in focus. The most important of these was greaterunderstanding of the differences in iron-oxide chemistry caused by the presence or absence of hydrazine. Theinteraction among hydrazine concentration, oxide chemistry and FAC was well explained by Berge andBouchacourt (Reference 5).3
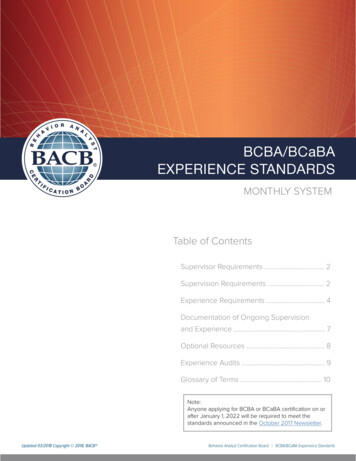
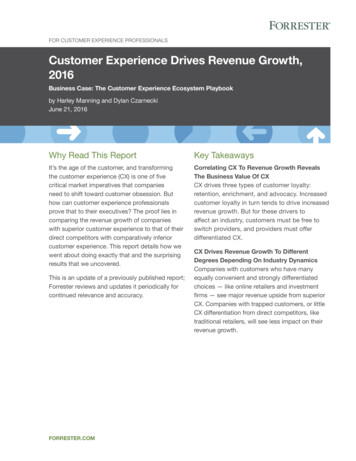
During the last years, there have been a number of experiments performed to relate the hydrazineconcentration to the rate of FAC. Two recent papers describing the French and British tests are presented inReferences 6 and 7 while still more recent information can be found in Reference 8. Perhaps the two mostimportant conclusions of these recent tests can be summarized on Figures 2 and 3.Figure 2 presents recent EDF data showing the effect of hydrazine at temperatures above 200' C. This figureshows a variation in rate of FAC with hydrazine concentration similar to Figure 1. Further, this chart whileindicating the large scatter present in the experimental data shows that some British and Japanese experienceis at least in general agreement with the French data plotted.Hydrazine effect on Relative FAC rate - T 200'C3,00 -1312,50C EDF (235'C One phase. pH25'C 9.0)(1)A MITSUBISHI (230'C One phase, 500ppb NH4OH) U) 2,00i*BR13ITISH Energy (250'C TwophasesO.75SQ,603ppb NH4 )2)C350U.CD I 00(3ag[313Z - :0,5013(2)50A11-- -Hot temperature pH dependence0,001400ppb0200400N2H46008001000o)Figure 2 - Recent EDF Laboratory Data at 2350CFigure 3 presents more recent EDF data at a temperature of 1800 C. This data clearly shows that hydrazine hasno impact on the rate of FAC through a concentration of 200 ppb. Note again that in Figures and 2 the peakof FAC rates occurs at a hydrazine concentraion of between 150 and 200 ppb.Hydrazine effect on Relative FAC rate - 180"C1.4-6 12Hot temperature pH ependence1,0- - - - - - - - - - --Arm- - - - - - - - -0,80,62!ig 0AX0.2rn 6 - 0 M/smrun 12 - 0 WSrun 13 - Ws0,0050100N2H4(ppb)150200Figure 3 - Recent EDF Laboratory Data at 180' CWith this as background, a discussion of U.S. plant experience with hydrazine is presented below.4
Plant ExperienceFAC is known to have caused failures in virtually every part of the steam, feedwater, and drain system pipingexcept the main steam line. FAC has also caused thinning and leaks in various pieces of equipment fabricatedof carbon steel (e.g., steam generator internals, feedwater heater shells). However, when trying to identify thelocations where hydrazine would have the greatest effect on FAC both the system temperature and thereplacement practices followed by most plants should be considered.Since it appears from the laboratory work discussed above that hydrazine does not impact FAC below about1800 C, then a great deal of the FAC susceptible piping is excluded form consideration. The BOP principalsystems above this temperature are:high-pressure extraction lineshigh-pressure main steamreheater drainshigh-pressure heater drainsfeedwater.In addition to these piping systems, there is off course, the carbon steels components within the steamgenerators.In most U.S. PWRs, the high-pressure extraction lines have been replaced with resistant material normallychromium-molybdenum steels or austinitic stainless steel. Also, the reheater drains and the high-pressureheater drains are fairly small lines compared to the main steam and feedwater. Finally, the main steam lineshave proven not to be very susceptible to FAC. Therefore, in considering the above list, the two key concernswith high levels of hydrazine are the feedwater lines and the carbon steel components in the steam generators.These areas will now be discussed.Older vintage steam generators often contained carbon steel components in contact with flowing water orsteam. These components, notably the J-tubes, have been very prone to damage by FAC. As the temperatureis higher in the steam generators than anywhere else in the secondary system, one would expect the maximumimpact of hydrazine to be seen there. And this may be the case. However, these carbon steel components arenot inspected often enough, nor in a quantitative manner to allow assessments of the change in corrosion ratewith time such as would be the case ifthe plant went from low-hydrazine to high-hydrazine water chemistry.The feedwater lines are the next area in the plant to look for change in rates of FAC caused by a switch to highhydrazine water chemistry. Feedwater lines have experienced a great deal of thinning at U.S. plants. ReferenceI describes the experiences at Surry, Trojan and Pleasant Prairie. Also, as opposed to steam generatorcomponents, some locations in the feedwater line are inspected periodically - often every outage. This isbecause the feedwater line is high pressure, with some portions being nuclear safety-related. Also, thestructural margins (i.e., the difference between the actual thickness and the thickness needed to meet the pipingcode) are often quite small. These margins can be as small as 0.1 mm or even smaller in certain extremecases. Finally, feedwater lines are difficult and costly to replace, so that plant management often wants to put offreplacing them for as long a time as possible.From the above discussion, it seems obvious that the feedwater lines are the place to look for changes in FACrate due to changes in the hydrazine level. However, there are four difficulties in making this evaluation.1. The rate of FAC in feedwater lines is normally less than 0.25 mm per year of operation.2. Other changes in water chemistry (e.g., change in the feedwater pH, or change of pH controlamine) may mask the impact of a change of the hydrazine concentration.3. The piping and fittings in the feedwater system are thick (-1.5 cm), and as mentioned above theloss of thickness is small so that the uncertainty of the thickness measurement is comparable withthe amount of wall loss in an outage.4. Inspections may be conducted at every outage, but outages are normally 18 or 24 months apart.In consideration of these reasons, it is not surprising that it is difficult to deduce the influence of hydrazine on theFAC rate. However, there is plant experience indicating the impact of elevated hydrazine levels on FAC rate.The first clear example of this was found in late 2000. The "PWR A" site contains a two-unit WestinghousePWR. At this plant, higher than expected rates of wall loss were found in numerous locations in the feedwatersystem downstream of the last feedwater heater. The temperature at these locations is about 2230 C (4330 F).At the time that this was found, personnel of PWR A were using CHECWORKS Version 1.01E, which does notcontain the hydrazine factor discussed above. In attempting to understand the poor predictions being obtained
with CHECWORKS Version 1.OE, EPRI converted the PWR A model to CHECWORKS Version 1.OF, whichcontains the hydrazine factor. Considerably better predictions were obtained. This seems to indicate thatincluding in the model the approximately 50 ppb hydrazine used in PWR A made the differences between badpredictions and good ones.It is true that there are possibly other reasons for this unexpected thinning, however, the predictions fromCHECWORKS Version .017 were good enough to strongly indicate that hydrazine was the cause of theadditional wall loss seen.Another, similar instance was found at the "PWR B" plant in the spring of 2001. PWR is a single unitWestinghouse plant. As was the case at PWR A, a large number of areas were found to be thinned more thanthat expected in the final feedwater. The temperatures at these locations is approximately, 227 C 440' F).Components in the turbine building and in the containment had to be replaced and the restart of the plant wasdelayed.This unexpected thinning prompted an investigation to see if this unexpected thinning could have to do with thelevels of hydrazine found at PWR B. It should be mentioned that PWR B has been running with elevated levelsof hydrazine (from about 140 ppb initially, tapering downwards to 55 ppb most recently) since 1992. Thisinvestigation was performed using a methodology developed by EDF using laboratory data from the CIROCOloop as validated with plant experience. The first step was to predict the wear that should have been seen in the final feedwater pipingassuming that the hydrazine concentration was zero. The measured thickness and the predicted thickness were then compared. This step gives aconservative result in that as the amount of wear occurring is a relatively small percentage of theoverall thickness, most of the components should agree with the predictions. The measured wear is then compared with the predicted wear. This is a much more sensitive testof the data than the previous step. From this comparison, it was determined that the predicted wearwas on average too low, and that higher predictions were needed to best match the measured data. The final step was to obtain a "best-fit" of the data using estimates of wall thickness based on themanufacturing tolerance, and an unknown "hydrazine multiplier." Using this approach the hydrazinemultiplier came out to be about 1.5. Note that if only the high hydrazine portions of operation areconsidered, the factor is close to 2.The factor of 1.5 can be considered as a "lifetime hydrazine factor" or an "average hydrazine factor" as it relatespredictions without hydrazine to actual wear with a variable amount of hydrazine present with time. The value of1.5 is viewed as a reasonable number in consideration of:the data shown on Figures I and 2,for the first 5 operating cycles, PWR B operated at low levels of hydrazine (i.e., about 20 ppb). Thisdata must be considered as the part of the lifetime wear, andfor the last 7 operating cycles the hydrazine has been mostly above I 0 ppb, and in the last twocycles it has been as low as 55 ppb.It is thus believed that the plant experience with hydrazine at PWR A and PWR 6 matches fairly well with thelaboratory experience.Further WorkIt is planned in 2002 to continue to examine plant data to confirm the role of hydrazine. Specific plans include:e examining the lower temperature (- 1500 to 1800C) feedwater data from PWR B to confirm thelaboratory results that hydrazine does not play a role below a temperature of 180'C.examining the data from plants with relatively low levels of hydrazine ( 100 ppb), andexamining the plant data from one or more additional "high hydrazine" plants to confirm the resultsof PWR A and PWR B.Additionally, the planned tests at EDF will be followed, and the results shared with the FAC community. Theresults of these planned efforts should greatly strengthen the understanding of the role of hydrazine in FAC.
DiscussionBased on the experience described above, it appears that the hydrazine factor in CHECWORKS is capturingthe hydrazine behavior at high temperature. However, the laboratory data, particularly the laboratory data at1800C is prompting a reexamination of the use of a temperature dependency. In fact the laboratory data is alsoprompting a reexamination the way in which hydrazine and oxygen are treated in CHECWORKS.When CHECWORKS was being developed, it was assumed, based on previous work and judgment, that thefactors in the correlation were by and large independent of each other. In examining the recent laboratory workin this area, the suggestion is that hydrazine and oxygen behave in concert, and that one should model themtogether. It should be noted that there is nothing new about this approach, rather it was suggested by the dataof Woolsey (Reference 4 in the mid 1980s.Thus, the plans in 2002 call for a reexamination of applicable laboratory and plant data, and appropriateupdates too the hydrazine and oxygen factors in CHECWORKS.Itis hoped that an improved hydrazine factor and/or oxygen factor that is encoded in CHECWORKS will providemore accurate plant predictions of FAC. This would potentially allow plant owners to reduce the number ofinspections in cases of recent or planned changes to the hydrazine concentration.ConclusionsDuring the past ten years, a great deal of effort has been expended to understand the role of hydrazine particularly at elevated levels - has on the rate of flow-accelerated corrosion. Both laboratory and plantinformation have combined to produce a much cleared picture of what is occurring. The experience at PWR Aand PWR indicate that high levels of hydrazine cause elevated rates of FAC to occur.EPRI together with the CHUG (CHUG CHECWORKS User Group) organization are planning to incorporatethe latest available information into a future version of the program.AcknowledgementThe contribution of Odile de Bouvier of EDF to this paper is acknowledged. She has been the key researcher inobtaining the recent hydrazine and oxygen data at the CIROCO loop (references 6 and 8). EPRI and EDF arecofunding this work.References1. Chexal, B., et al., Flow-Accelerated Corrosionin PowerPlants, EPRI Report TRA 0661 1-R1, July 1998.2. Chexal, B., et al., "CHECWORKS Flow-Accelerated Corrosion Application -Version 1.OG User Guide," EPRIreport TR-103198-Pl-Rl, October 2000.3. Ducreux, J., "Theoretical and Experimental Investigation of the Effect of Water-Chemistry on ErosionCorrosion of Steels" (in French), presented at the Proceedings of "Corrosion-Erosion of Steels in HighTemperature Water and Wet Steam," Les Renardies, France, 1982.4. Woolsey, 1.S., et al., "The Influence of Oxygen and Hydrazine on the Erosion-Corrosion Behaviour andElectrochemical Potentials of Carbons Steel under Boiler Feedwater Conditions," CEGB ReportTPRD/U3021/R86, August 1986.5. Berge, P. and Bouchacourt, M., "Flow Accelerated Corrosion and Hydrazine," Eskorn InternationalConference on Process Water Treatment and Power Plant Chemistry, Midrand. South Africa, Nov. 1997.6. de Bouvier, et al., "About the Hydrazine Effect on Flow Accelerated Corrosion Occurrence and Tube Foulingin PWR's Steam Generators, , V1111h International Conference of Water Chemistry of Nuclear ReactorSystems, BNES, Bournemouth (UK), October 2000.7. Woolsey, I.S., et al., "Effects of Hydrazine, Amine and Contaminant Species on Two-Phase Flow AcceleratedCorrosion, , V1111h International Conference of Water Chemistry of Nuclear Reactor Systems, BNES,Bournemouth (UK), October 28. de Bouvier, 0. and Bouchacourt, M., "An Update of EDF Research on FAC," presented at the twenty-fifthEPR/CHUG Meeting, Reno, Nevada, June 2001.7
dependency is similar to the curve later determined by EDF from their laboratory data (see below). Both curves show that the rate of FAC increases with hydrazine to about 150 ppb at which case hydrazine begins to lose influence and the curve falls back to unity at about 500 ppb. Single-Phase Hydrazine Factor 2.5 - 0 2.0 LL 1. - 0) C N 1 .0