Transcription
San Mateo CountySexually Transmitted Diseaseand HIV-AIDS SurveillanceAnnual Report, 2015www.smchealth.org/std · HIV Testing Van: 650-619-9125 · STD Clinic: 650.573.2999·Aracely Tamayo PhD, Epidemiologist ·Vivian Levy MD, STD Controller·Scott Morrow MD, MPH, MBA, Health Officer
Introduction and AcknowledgementsThis is the 2015 report of data and program highlights from the STD/HIV Program in the San Mateo County Health System. For questions and feedback on this report or on the STD/HIV Program, please contact the Epidemiology unit.San Mateo County Health SystemEpidemiology225 W 37th AveSan Mateo, CA 94403epidemiology@smcgov.org650-573-2144Suggested CitationSan Mateo County Department of Public Health, Policy & Planning. San Mateo County Sexually Transmitted Diseaseand HIV-AIDS Surveillance Annual Report, 2015. San Mateo County Department of Public Health, Policy & Planning,San Mateo, California. December 2016.Note on data for previous years:Numbers in the document listed for past years may not match totals in previous reports. Totals may increase due to latereports, and may decrease when duplicate reports are removed or cases are subsequently identified as out of our jurisdiction. In addition, disease rates may have changed due to updated denominator data from the U.S. Census Bureau orthe California Department of Finance.The following contributed to the creation of this report: Matt Geltmaker, Sharon Jones, Darryl Lampkin, Teresa Lopez,Judith Ochoa, Marco Vergara, and Karen Pfister.San Mateo County STD/HIV-AIDS Surveillance Report 2015
Table of ContentsI. Overview of the Sexually Transmitted Diseases and HIV-AIDS Program . 2II. Bacterial Sexually Transmitted Diseases in San Mateo County .3-201. Overview of Bacterial STDs in San Mateo County . 3Figure 1. STDs Rates By Year in San Mateo County, 2001-2015 . 3Table 1. STD Cases and Rates By Year Reported in San Mateo County, 2001-2015 . 4Figure 2. STDs Rates for Females By Year in San Mateo County, 2001-2015 . 5Figure 3. STDs Rates for Males By Year in San Mateo County, 2001-2015 . 5A.Chlamydia . 61. Overview of Chlamydia in San Mateo County . 6Figure 4. Chlamydia Cases and Rates by Year in San Mateo County, 2001-2015 . 6Figure 5. Chlamydia Rates by Gender and Year in San Mateo County and State of California, 2001-2015 . 7Figure 6. Chlamydia Cases by Gender and Age in San Mateo County, 2015 . 7Figure 7. Chlamydia Cases by Gender and Selected Race/Ethnic Groups in San Mateo County, 2015 . 8Table 2. Chlamydia Cases and Rates by Demographic and Clinical Characteristics by Gender in San Mateo County, 2014 and 2015 . 9Figure 8. Chlamydia Rates by Census Tract in San Mateo County, 2015 . 10B. Gonorrhea . 111. Overview of Gonorrhea in San Mateo County . 11Figure 9. Gonorrhea Cases and Rates by Year in San Mateo County, 2001-2015. 11Figure 10. Gonorrhea Rates by Gender and Year in San Mateo County and State of California, 2001-2015 . 12Figure 11. Gonorrhea Cases by Gender and Age in San Mateo County, 2015 . 12Figure 12. Gonorrhea Cases by Gender and Selected Race/Ethnic Groups in San Mateo County, 2015 . 13Table 3. Gonorrhea Cases and Rates by Demographic and Clinical Characteristics by Gender in San Mateo County, 2014 and 2015 . 14Figure 13. Gonorrhea Rates by Census Tract in San Mateo County, 2011-2014 . 15C. Syphilis . 161. Overview of Syphilis in San Mateo County . 16Figure 14. Early Syphilis Cases and Rates by Year in San Mateo County, 2001-2015 . 16Figure 15. Early Syphilis Rates by Gender and Year in San Mateo County and State of California, 2001-2015 . 17Figure 16. Early Syphilis Rates by Syphilis Stage and Year in San Mateo County, 2001-2015 . 17Table 4. Early Syphilis Cases and Rates by Syphilis Stage, Demographic Characteristics, and Risk Factors, San MateoCounty, 2014 and 2015 . 18Table 5. Syphilis Cases and Rates by Demographic Characteristics for All Syphilis Cases in San Mateo County, 2015 and 2014 . 19Figure 17. Early Syphilis Rates by Census Tract in San Mateo County, 2011-2015 . 20III. HIV/AIDS in San Mateo County . 21-26A. HIV/AIDS . 211. Overview of HIV/AIDS in San Mateo County . 21Table 6. Newly Reported HIV cases and Percentage of Late Testers by Year of Diagnosis, San Mateo County, 2006-2015 . 21Table 7. Characteristics of Newly Reported HIV Cases by Year of Diagnosis, San Mateo County, 2011-2015 . 21Table 8. Characteristics of Late HIV, San Mateo County, 2011-2015 . 22Figure 18. Adult HIV Cases Diagnosed From 2011-2015 by Transmission Category, Gender, and Race/Ethnicity, San Mateo County. 23Figure 19. Proportion Living with HIV, Living with AIDS, and the County Population by Race/Ethnicity, San Mateo County, 2015. 24Table 9. Demographic and Risk Characteristics of Living Persons Diagnosed with HIV/AIDS, San Mateo County (2015) and California(2014) . 25Figure 20. Cumulative Prevalence of Reported Living HIV/AIDS Cases by Current Residential Zip Code in San Mateo County, 2015 . 26IV. Summary of Sources and Technical Notes . 27San Mateo County STD/HIV-AIDS Surveillance Report 2015
Overview of the Sexually Transmitted Diseases and HIV-AIDS ProgramSan Mateo County Health System STD/HIV Program OverviewThe STD/HIV Program was created in November 2008, with the merging of the long-standing STD and AIDSPrograms, in order to integrate STD and HIV services within the San Mateo County Health System. The program aims to identify, prevent and treat Sexually Transmitted Diseases (STDs) and HIV, as well as monitorSTD/HIV disease trends in San Mateo County.Services of the STD/HIV Program Provide comprehensive primary and specialty medical care, psychosocial support and case management for persons infected with HIV Ensure availability and access to effective STD and HIV diagnostic, treatment and counseling services for persons at risk for STDs Provide linkage to care services for newly infected HIV patients as well as HIV infected patients whohave fallen out of care Develop program policy and procedures that are responsive to morbidity Provide STD and HIV prevention and treatment information through the Health System web site:http://www.smchealth.org/std Conduct case and behavioral surveillance, analysis and reporting of syphilis, gonorrhea, chlamydia,and HIV disease trends using demographic, clinic, and interview data Conduct STD prevalence monitoring in high-risk settings such as STD clinic and correctional facilities Conduct disease intervention services, including field-delivered therapy and partner services whereappropriate Support training opportunities and distribute STD/HIV clinical educational materials to health care providers Partner with public and private laboratories offering STD/HIV testing Collaborate with public and private key stakeholders to support, and/or conduct activities related toinsights and solutions to STD prevention and treatment.External partners include: California Department of Public Health, San Francisco Department of PublicHealth, San Francisco Mayor’s Office of Housing, California Conference of Local AIDS Directors, CaliforniaSTD Controllers Association.Community partners include: Mental Health Association of San Mateo County, AIDS Community ResearchConsortium, Harm Reduction Therapy Center.Funding and GrantsThe STD/HIV Program received funding from the following sources in 2015: San Mateo County General Fund Federal Health Resources and Services Administration (HRSA) - Ryan White Part A as part of the SanFrancisco Eligible Metropolitan Area (EMA) Federal Centers for Disease Control & Prevention (CDC) - HIV Prevention Funds as part of the SanFrancisco Eligible Metropolitan Area (EMA) Federal Housing and Urban Development (HUD) - Housing Opportunities for People with AIDS(HOPWA) as part of the San Francisco Eligible Metropolitan Statistical Area (EMSA) Federal Substance Abuse and Mental Health Services Association (SAMHSA) California Department of Public Health – Office of AIDS HRSA - Ryan White Part B HRSA - Minority AIDS Initiative (MAI) California Department of Public Health – STD Control Branch Chlamydia Screening Project (ClaSP) STD Community Interventions Program (SCIP)San Mateo County STD/HIV-AIDS Surveillance Report 20152
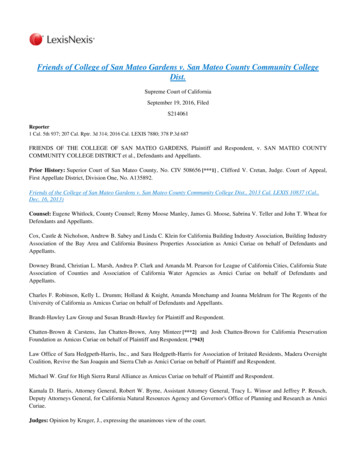
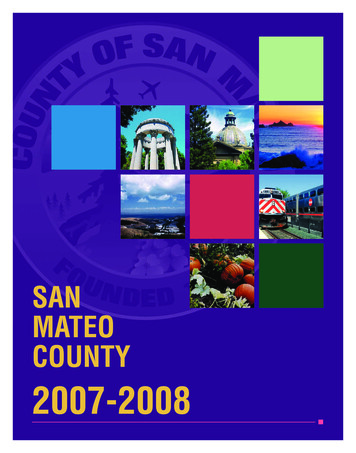
All Bacterial STDS In San Mateo County (SMC)Overview SMC early syphilis cases (acquired in the last year) increased 23% in 2015 compared to 2014. SMC HIVc o-infected early syphilis cases increased 59% compared to early syphilis cases in 2014. Femalescomprised 7% of SMC early syphilis cases in 2015 compared to 3% in 2014. SMC gonorrhea (GC) case numbers and rates are the highest reported since 2000, with a 50% increasein cases compared to 2014. The 2015 GC increase is much steeper in males compared to females. Chlamydia trachomatis (CT) cases increased 4% in 2015 compared to 2014. Statewide and nationally, all three notifiable STDs increased compared to 2014 and the prior five years. SMC rates are below California rates for all three notifiable STDs. Disparities persist, the highest rates are among youth, men who have sex with men (MSM) and AfricanAmericans. The drivers of these increases are likely multifactorial with possible reasons including increasedtransmission, increased oral and rectal screening in MSM, and less condom use in the setting of HIV preexposure prophylaxis (PreP). We urge routine STD screening and timely treatment for patients at risk for STDs or the most devastatingconsequences of STDs, such as congenital syphilis.Figure 1. STD Rates by Year in San Mateo County, 2001-2015GonorrheaEarly Syphilis1430012250102008150610045020Early Syphilis Rates per 100,000Chlamydia and Gonorrhea Rates per 100,000Chlamydia02001 2002 2003 2004 2005 2006 2007 2008 2009 2010 2011 2012 2013 2014 2015YearEarly Syphilis is defined as primary, secondary, and early latent syphilis stages of disease. Note difference in scale for Early Syphilis. Data for SanMateo County is compiled from the California Reportable Disease Information Exchange (CalREDIE) system and the Automated Vital Statistics System (AVSS) .San Mateo County STD/HIV-AIDS Surveillance Report 20153
All Bacterial STDSTable 1. STD Cases and Rates by Year Reported in San Mateo County, 2001-2015Reported CasesChlamydiaGonorrheaSyphilis (Total)PrimarySecondaryEarly Latent(Total Early Syphilis1)Late LatentNeurosyphilis2Congenital 0920102011201220132014 2015Chlamydia172.2 190.9 196.2 211.0 223.1 241.2 258.8 279.2 247.5 275.2 267.8 247.4 237.2 305.3 30.031.736.643.348.472.0Syphilis 1.05.14.15.7Early 4(Total Early 10.412.8Late 30.10.00.03Congenital 00.011.21Early syphilis includes primary, secondary and early latent syphilis stages. 2 Neurosyphilis cases are a sequelae of syphilis and not a stage, neurosyphilis cases are captured under other syphilis stages. 3Rates equal cases per 100,000 live births per year based on CA Department of Finance,Demographic Research Unit, Historical and Projected Births by County. 4Rates equal cases per 100,000 residents per year based on population datafrom the California Department of Finance. Data for San Mateo County is compiled from the California Reportable Disease Information Exchange(CalREDIE) system and the Automated Vital Statistics System (AVSS) .San Mateo County STD/HIV-AIDS Surveillance Report 20154
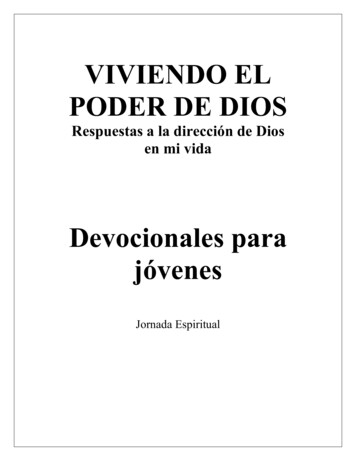
All Bacterial STDSFigure 2. STD Rates For Females by Year in San Mateo County, 2001-2015GCEarly 0Early Syphilis Rate per 100,000Chlamydia and Gonorrhea Rate per100,000CT0.02001 2002 2003 2004 2005 2006 2007 2008 2009 2010 2011 2012 2013 2014 2015YearEarly Syphilis is defined as primary, secondary, and early latent syphilis stages of disease. Note difference in scale for Early Syphilis.Rates equal cases per 100,000 female residents per year based on population data from the California Department of Finance. Data forSan Mateo County is compiled from the California Reportable Disease Information Exchange (CalREDIE) system and the Automated VitalStatistics System (AVSS).Figure 3. STD Rates For Males by Year in San Mateo County, 2001-2015GCEarly 0Early Syphilis Rate per 100,000Chlamydia and Gonorrhea Rate per 100,000CT0.02001 2002 2003 2004 2005 2006 2007 2008 2009 2010 2011 2012 2013 2014 2015YearEarly Syphilis is defined as primary, secondary, and early latent syphilis stages of disease. Note difference in scale for Early Syphilis.Rates equal cases per 100,000 male residents per year based on population data from the California Department of Finance. Data forSan Mateo County is compiled from the California Reportable Disease Information Exchange (CalREDIE) system and the AutomatedVital Statistics System (AVSS).San Mateo County STD/HIV-AIDS Surveillance Report 20155
ChlamydiaOverview SMC chlamydia trachomatis (CT) cases increased 4% between 2014 and 2015. SMC females saw a modest increase in CT rates from 2014 to 2015 and male CT rates had a largerincrease during this time. SMC CT rates remain below California CT rates for both males and females. The largest number of female CT cases were in women age 20-24 years. Annual screening isrecommended for sexually active women age 25 and under. Given approximately half of all CT cases are asymptomatic, screening in women age 25 and under, menwho have sex with men, and high risk heterosexuals is recommended at least annually or more frequentlybased on risk. CA Healthy Youth Act passed in 2016 mandates medically accurate instruction on STDs in schools.Figure 4. Chlamydia Cases and Rates San Mateo County, ,342 1,3761,4801,980 37300200Rate per 100,000Cases100002001 2002 2003 2004 2005 2006 2007 2008 2009 2010 2011 2012 2013 2014 2015YearData for San Mateo County is compiled from the California Reportable Disease Information Exchange (CalREDIE) system and the AutomatedVital Statistics System (AVSS). Rates equal cases per 100,000 residents per year based on population data from the California Department ofFinance.San Mateo County STD/HIV-AIDS Surveillance Report 20156
ChlamydiaFigure 5. Chlamydia Rates By Gender and Year in San Mateo County and Stateof California, 2001-2015SMC FemaleSMC MaleCA FemaleCA Male700Chlamydia Rate per 100,00060050040030020010002001 2002 2003 2004 2005 2006 2007 2008 2009 2010 2011 2012 2013 2014 2015YearData for San Mateo County is compiled from the California Reportable Disease Information Exchange (CalREDIE) system and the AutomatedVital Statistics System (AVSS). Data for California rates was provided by the California Department of Public Health STD Control Branch. Ratesequal cases per 100,000 gender specific residents per year based on population data from the California Department of Finance.Figure 6. Chlamydia Cases by Gender and Age in San Mateo County, 2015FemaleMale600500Cases4003002001000 1515-1920-2425-2930-3435-3940-4445-4950-5455-5960 Age GroupData for San Mateo County is compiled from the California Reportable Disease Information Exchange (CalREDIE) system.San Mateo County STD/HIV-AIDS Surveillance Report 20157
ChlamydiaFigure 7. Chlamydia Cases by Gender and Selected Race/Ethnic GroupsSan Mateo County, 2015 (n 0AsianAfrican-AmericanLatina/oPacific IslanderWhiteRace/Ethnic GroupsData for San Mateo County is compiled from the California Reportable Disease Information Exchange (CalREDIE) system.San Mateo County STD/HIV-AIDS Surveillance Report 20158
ChlamydiaTable 2. Chlamydia Cases and Rates by Demographic and Clinical Characteristics by Gender inSan Mateo County Residents, 2014 and 2015WomenMen2014CasesPercentCounty Total2,277100Gender Total1,44463.4Age 1.342.6262.999.260 2-Race/EthnicityAmerican cePacific .4-14217.1-33437.4-WhiteOther/Unknown3Clinical Site of InfectionRectal/PharyngealOther/UnknownCase data for San Mateo County is compiled from the California Reportable Disease Information Exchange (CalREDIE). 1 Rates equal cases per100,000 gender and age or race/ethnicity specific residents per year based on population data from the California Department of Finance. 2 Race/ethnicity data not available for many cases as positive tests for infections are automatically reported to testing laboratories and no follow-up interviewsare conducted for chlamydia cases. Note: There were 5 transgender CT cases in 2014 and 10 transgender CT cases in 2015.San Mateo County STD/HIV-AIDS Surveillance Report 20159
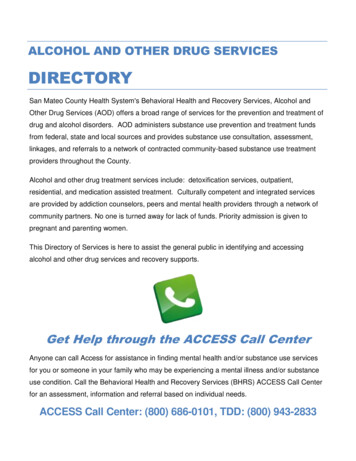
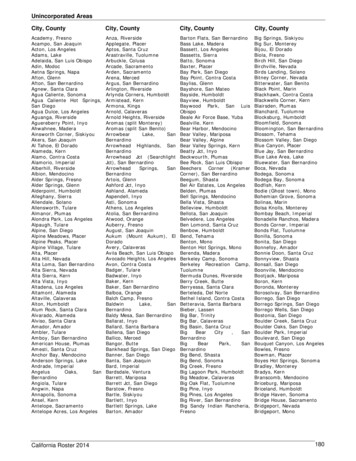
The Geography of Chlamydia in San Mateo County The highest rates of chlamydia infections in 2015 were seen in census tracts in parts of Daly City, San Mateo,South San Francisco, Redwood City, Menlo Park, and East Palo Alto.Figure 8. Chlamydia Rates by Census Tract in San Mateo County, 2015Case data based on California Reportable Disease Information Exchange (CalREDIE) San Mateo County. Rates equal count of 2015chlamydia cases per census tract population.San Mateo County STD/HIV-AIDS Surveillance Report 201510
GonorrheaOverview SMC gonorrhea (GC) case numbers and rates are the highest reported since 2000, with a 50% increasein cases compared to last year. While the gonorrhea rate increased in both males and females from 2014 to 2015 the increase was muchsteeper in males. Most gonorrhea cases were in White and Latino race/ethnicities, but rates are highest for AfricanAmericans in part due to the small population size of this group. Despite 20% male gonorrhea cases missing anatomic site data, MSM made up 35% of gonorrhea casesin 2015. In California, gonorrhea cases increased 21% compared to last year, with the highest statewidegonorrhea case numbers and rates since the early 1990s. SMC gonorrhea rates for males and females remain below California rates.Figure 9. Gonorrhea Cases and Rates by Year San Mateo County, 2001-2015Data for San Mateo County is compiled from the California Reportable Disease Information Exchange (CalREDIE) system and the Automated VitalStatistics System (AVSS). Rates equal cases per 100,000 residents per year based on census data from the California Department of Finance.San Mateo County STD/HIV-AIDS Surveillance Report 201511
GonorrheaFigure 10. Gonorrhea Rates By Gender and Year in San Mateo County and Stateof California, 2001-2015Data for San Mateo County is compiled from the California Reportable Disease Information Exchange (CalREDIE) system and the Automated VitalStatistics System (AVSS). Data for California rates was provided by the California Department of Public Health STD Control Branch. Rates equalcases per 100,000 gender specific residents per year based on population data from the California Department of Finance.Figure 11. Gonorrhea Cases by Gender and Age in San Mateo County, 2015FemalesMales100908070Cases6050403020100 1515-1920-2425-2930-3435-3940-44Age Group45-4950-5455-5960 Data for San Mateo County is compiled from the California Reportable Disease Information Exchange (CalREDIE) system.San Mateo County STD/HIV-AIDS Surveillance Report 201512
GonorrheaFigure 12. Gonorrhea Cases By Gender and Selected Race/Ethnic Groups inSan Mateo County, 2015 (n AmericanLatina/oRace/Ethnic GroupsWhiteData for San Mateo County is compiled from the California Reportable Disease Information Exchange (CalREDIE) system.San Mateo County STD/HIV-AIDS Surveillance Report 201513
GonorrheaTable 3. Gonorrhea Cases and Rates by Demographic and Clinical Characteristics by Gender inSan Mateo County, 2014 and 2015WomenMen2014CasesPercentCounty Total362100Gender 031.0133.249.660 33.23.421.62.241.55.6102.413.4American ace11.17.921.615.610.47.910.27.8Pacific 38.1-16339.6-GenitourinaryAge 15Race/EthnicityClinical Site of .3-2710.1-8320.1-Case data for San Mateo County is compiled from the California Reportable Disease Information Exchange (CalREDIE). 1Rates equal cases per100,000 gender and age or race/ethnicity specific residents per year based on population data from the California Department of Finance. 2Race/ethnicity data not available for many cases as positive tests for infections are automatically reported to testing laboratories and no follow-upinterviews are conducted for gonorrhea cases. Note: There was 1 transgender GC case in 2014 and 2 transgender GC cases in 2015.San Mateo County STD/HIV-AIDS Surveillance Report 201514
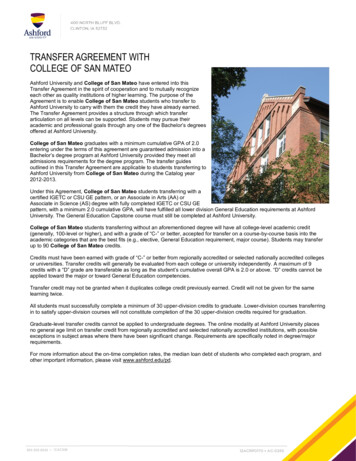
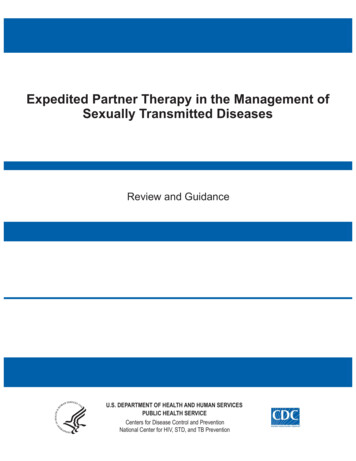
The Geography of Gonorrhea in San Mateo County The highest rates of gonorrhea infections in 2011-2015 were seen in census tracts in parts of Daly City,Pacifica, Redwood City, San Mateo, South San Francisco, Menlo Park, and East Palo Alto.Figure 13. Gonorrhea Rates by Census Tract in San Mateo County, 2011-2015Case data based on California Reportable Disease Information Exchange (CalREDIE) San Mateo County. Rates equal count of 2011-2015 gonorrheacases per census tract population.San Mateo County STD/HIV-AIDS Surveillance Report 201515
SyphilisOverview SMC total syphilis and early syphilis (defined as acquired in the last year) cases and rates increased in2015 compared to 2014. SMC early syphilis cases increased 23% compared to last year; SMC totalsyphilis cases increased 32% compared to last year. In 2015, 93% of SMC early syphilis cases were diagnosed in men and 66% of these were in men whohave sex with men (MSM). Females comprised 7% of early syphilis cases in 2015, compared to 3% in 2014. This is especiallyconcerning given the statewide increase in morbidity of syphilis in newborns. In 2015, SMC had onecongenital syphilis case. HIV co-infected early syphilis cases increased 59% compared to early syphilis cases last year. California total syphilis cases increased 26% compared to last year. SMC male and female syphilis ratesremain below California rates. SMC encourages at least an annual, and consideration of more frequent (every 4-6 months) syphilisscreenings in HIV infected MSM.Figure 14. Early Syphilis Cases and Rates by Year San Mateo County, 48403207811020393222343732413423235Rate per 100,000Cases80176002001 2002 2003 2004 2005 2006 2007 2008 2009 2010 2011 2012 2013 2014 2015YearEarly Syphilis includes primary, secondary, and early latent stages of syphilis. Data for San Mateo County is compiled from the California ReportableDisease Information Exchange (CalREDIE) system and the Automated Vital Statistics System (AVSS). Rates equal cases per 100,000 residents peryear based on population data from the California Department of Finance.San Mateo County STD/HIV-AIDS Surveillance Report 201516
SyphilisFigure 15. Early Syphilis Rates by Gender and Year in San Mateo County andState of California, 2001-2015Early Syphilis Rate per 100,000SMC FemaleSMC MaleCA FemaleCA Male504540353025201510502001 2002 2003 2004 2005 2006 2007 2008 2009 2010 2011 2012 2013 2014 2015YearEarly Syphilis includes primary, secondary, and early latent stages of syphilis. Data for San Mateo County is compiled from the California ReportableDisease Information Exchange (CalREDIE) system and the Automated Vital Statistics System
External partners include: California Department of Public Health, San Francisco Department of Public Health, San Francisco Mayor's Office of Housing, California Conference of Local AIDS Directors, California STD Controllers Association. Community partners include: Mental Health Association of San Mateo County, AIDS Community Research