Transcription
Track 2 – Core Energy TechnologiesAdvanced Water ManagementCooling Tower Water Conservation:Simple Strategies & Advanced TreatmentEric ElamWater Savers LLC, RTS WaterAugust 15th, 2017Tampa Convention Center Tampa, Florida
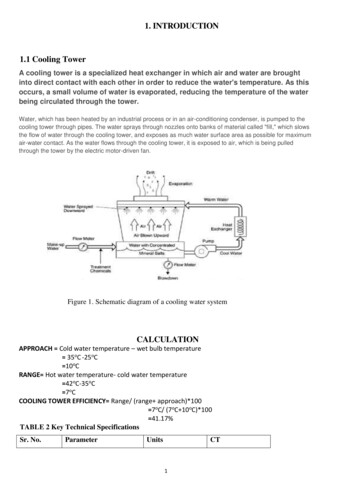
Coolingtowers comein all sizes2Energy Exchange: Connect Collaborate Conserve
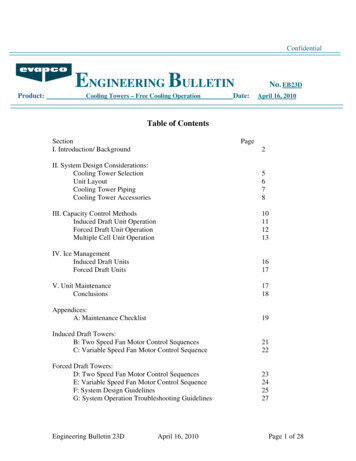
Cooling Tower Water UseTypical Cooling Tower Flow DiagramFan and MotorProcess ReturnDriftEliminatorsFill MaterialMake-upFloatOverflowPumpTo Process3BlowDownBasinConductivityControllerEnergy Exchange: Connect Collaborate Conserve
Cooling Tower Water UseSix Ways of Water Loss Evaporation Blowdown Drift loss Wind loss Overflow Leaks4Energy Exchange: Connect Collaborate Conserve
Cooling Tower Water UseWater Use Equations for Cooling TowersMU E BD D LWhereMU MakeupE EvaporationBD BlowdownD Drift and wind loss- accounts for less than 0.001% of water useL Leaks, overflows, and other losses- Should be controllable with proper fill valves and routine maintenance5Energy Exchange: Connect Collaborate Conserve
Cooling Tower Water UseWater Use Equations for Cooling TowersE 1% x CWFR x T/10 x 60min/hr xAnnual Runtime HoursWhereE EvaporationCWFR Condenser Water Flowrate T Temp Change Across Tower- Generally towers are designed at 10oF T- Higher T generally translates to higher evaporation, but towers experience shorterruntimes in order to meet load requirementsAnnual Runtime Hours Actual operating hours- Can be estimated using ASHRAE Full Load Equivalent Hours6Energy Exchange: Connect Collaborate Conserve
Cooling Tower Water UseWater Use Equations for Cooling TowersFull Load Equivalent Cooling Hours by RegionTampa Area 3,068 FLE Cooling HoursRegion Specific FLE Cooling Hours: Pacific Northwest 100-700Northern CA 200-800Northeast 300-900Midwest 700-1200Mid-Atlantic 1000-1500Southern CA 1200-2000Southeast 1500-2300Texas & Florida 1700-4000Hawaii 5000Be Mindful of System Redundancy7Energy Exchange: Connect Collaborate Conserve
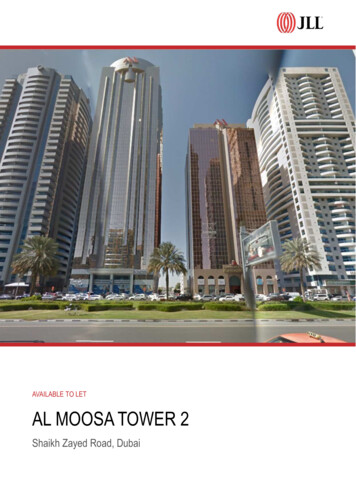
Cooling Tower Water UseWater Use Equations for Cooling TowersEvaporation is a function ofCooling LOAD!So, Water Conservation opportunitiesresult primarily from a reduction inblow-down losses by increasing cyclesof concentration.8Energy Exchange: Connect Collaborate Conserve
Cooling Tower Water UseCoolingTowerWaterUseGallonsperTon-HourGallons per ofConcentration8Energy Exchange: Connect Collaborate Conserve
Cooling Tower Water UseWater Quality DictatesCycles of Concentration Limits pH TDS (Total Dissolved Solids) TSS (Total Suspended Solids) Calcium Hardness Total Silica Organic Contamination10Energy Exchange: Connect Collaborate Conserve
Cooling Tower Water UseWhat Determines theAmount of Blowdown? There are many factors thatlimit cooling waterconcentration The blowdown required isthe least needed to satisfyALL of the constraints. The only control theoperator has to meet theselimits is blowdown.11Typical CWS Water Chemistry LimitsParameterLimitConstraintConductivity 4000uSTowerwarrantyCalcium 75ppmCorrosionControlLSI 2.5CalciumScaleControlSilica 180ppmSilica ScaleControlMagnesiumSilicateMgSiO2 25,000 Energy Exchange: Connect Collaborate Conserve
Cooling Tower Water UseCycles of Concentration (CoC)A Measurement of Cooling Tower Water EfficiencyCoC MU / BDBD E / (CoC – 1)CoC κ condenser / κ make-upWhereκ (kappa) Conductivity in µS/cm, or µmhos- Condenser water conductivity is presumably at or near the blow-down setpoint- Make-up water conductivity will fluctuate seasonally and depends on watersourcing12Energy Exchange: Connect Collaborate Conserve
Cost Savings & Water Conservation StrategiesSewer Exemption Sub-MeteringEvaporation Credits are available from mostWater/Sewer Providers, especially inmetropolitan areas.Each Provider may have a different policy/procedurefor obtaining the evaporation exemption, andmay also impose significant fees/permittingrequirements in effort to recover lost revenue.Evaporation Credits are NOT a water conservationmeasure! But they can result in significant costsavings opportunities.In Tampa area, the cost savings can equate to nearly 16 per Ton annually.(Lower Rate, Higher Cooling Load)In DC area, the cost savings can equate to nearly 18 per Ton annually.(Higher Rate, Lower Cooling Load)13Energy Exchange: Connect Collaborate Conserve
Cost Savings & Water Conservation StrategiesTraditional Chemical TreatmentDepends on Regional Make-upWater QualityTraditional chemical treatments typicallyinvolve 3 main components:Anti-scalant – to combat against scale formingcompounds such as calcium, magnesiumBiocide – to combat against algae, bacteria, and otherbiofouling contaminantsCorrosion Inhibitor – to prevent degradation ofmechanical components and piping.14Energy Exchange: Connect Collaborate Conserve
Cost Savings & Water Conservation StrategiesTraditional Chemical TreatmentMajor treatment providers get very comfortableoperating in the 3 cycle range.THIS MEANS 50% of Evaporative load is lost asBlow-down WasteContact your Chemical Treatment Provider aboutopportunities for High Cycle water treatment programs,and real-time monitoring capabilities.15Energy Exchange: Connect Collaborate Conserve
Cost Savings & Water Conservation StrategiesWhat if there wasANOTHER OPTION?Treat water from the source!16Energy Exchange: Connect Collaborate Conserve
Cost Savings & Water Conservation StrategiesAdvanced Water Treatment SolutionsPartial SofteningSofteners are designed to remove calcium hardness They do so by exchanging with sodium, whichresults in higher conductivity of make-up water,but lowered calcium hardness Allows for an increase of blow-down set-point Why not make up with fully softened water?Corrosivity is increased, which can shorten life ofcapital equipment.17Energy Exchange: Connect Collaborate Conserve
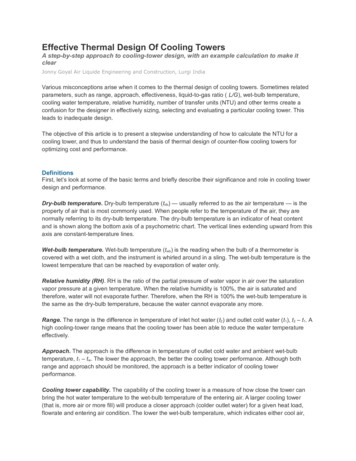
Cost Savings & Water Conservation StrategiesPartialDemineralizationCityWater(2 inch copper or on Reverse Osmosis Softeners will not reduce conductivity or removesilica, so demineralization approach may be aneffective solution Partial De-min utilizes pre-filtration and softening, andultimately generates ideal condenser water make-upquality by blending RO permeate with filtered water Can achieve 15 cycles of concentration, whileeffectively maintaining corrosion TUVNanofilter UnitBreakTankUVFrom softener,filter backwash,and nanofilterdischarge18SensorsWMEnergy Exchange: Connect Collaborate Conserve
Cost Savings & Water Conservation StrategiesAdvanced Water Treatment SolutionsSide-stream FiltrationSide-Stream Filtration DOES NOT Save Water Allows for better high cycle cooling toweroperation by filtering out debris, organics,and some bacterial contaminants Reduces bio-film on heat transfer surfaces May result in heat transfer efficiency gainsof 5-15% depending on current towerconditions But, will actually result in increased waterconsumption due to filter backwashing19Energy Exchange: Connect Collaborate Conserve
Cost Savings & Water Conservation StrategiesAdvanced Water Treatment SolutionsReal-time Monitoring & BAS Integrationwith Advanced ControllersBAS Integration Capable utilizing BACNet or MODBUS Allows for real-time monitoring of system conditions Creates alarm case conditions for targeted maintenance Provides for accurate measurement and verification ofsystem performance, with over 30 critical data points20Energy Exchange: Connect Collaborate Conserve
MCRD Parris Island (Parris Island, SC)– Eleven locations with small packaged Partial Softening and Sidestream Filters (100-300 ton chiller systems)– One location with Centralized Partial Softeners and localized SideStream Filters (4x200 ton chiller system)21Energy Exchange: Connect Collaborate Conserve
MCRD Parris Island22Energy Exchange: Connect Collaborate Conserve
NMSHA (Beaver, WV)– Centralized Partial Softening and SSF (750 ton chiller system)23Energy Exchange: Connect Collaborate Conserve
NMSHA24Energy Exchange: Connect Collaborate Conserve
Corpus Christi Army Depot (Corpus Christi, TX)– Phase 1 – (4 space cooling systems 2,730 ton total cooling capacity) Central Demineralization Plant with Distributed Make-up Localized Side Stream Filtration, BAS Integration– Phase 2 – (10 process cooling towers 500 ton equiv. each) Partial Softening Side-stream Filtration25Energy Exchange: Connect Collaborate Conserve
CCAD – Phase 126Energy Exchange: Connect Collaborate Conserve
CCAD – Phase 127Energy Exchange: Connect Collaborate Conserve
CCAD – Phase 128Energy Exchange: Connect Collaborate Conserve
CCAD – Phase 129Energy Exchange: Connect Collaborate Conserve
CCAD – Phase 230Energy Exchange: Connect Collaborate Conserve
Department of Interior HQ (Washington, DC)––––31Groundwater CollectionPartial DemineralizationSide-stream FiltrationBAS IntegrationEnergy Exchange: Connect Collaborate Conserve
DOI HQIts what you cant see that matters the most Several underground sumps pits to capture ground water 2-large sump pumps discharging water to storm sewer system32Energy Exchange: Connect Collaborate Conserve
DOI HQMeasurement and Verification Water flow were measured at 30 gallons per minute 43,200 Gallons per day or 15,768,000 Gallons per year potential Cooling tower annual make-up is 6,500,000 gallons per year33Energy Exchange: Connect Collaborate Conserve
DOI HQGround Water Collection and Re-Use34Energy Exchange: Connect Collaborate Conserve
DOI HQWater Reclamation System Overview35Energy Exchange: Connect Collaborate Conserve
DOI HQGround Water Filtration System36Energy Exchange: Connect Collaborate Conserve
DOI HQ37Energy Exchange: Connect Collaborate Conserve
THANK YOUEric ElamVice President – Design & EngineeringWater Savers LLC, RTS Watereelam@watersaversllc.com38Energy Exchange: Connect Collaborate Conserve
Cooling Tower Water Use Water Use Equations for Cooling Towers 7 Full Load Equivalent Cooling Hours by Region Tampa Area 3,068 FLE Cooling Hours Region Specific FLE Cooling Hours: Pacific Northwest 100- 700 Northern CA 200-800 Northeast 300-900 Midwest 700-1200 Mid-Atlantic 1000-1500 Southern CA 1200-2000 .