Transcription
Journal of Industrial Engineering, University of Tehran, Special Issue, 2011, PP. 79-9379Analyzing Customer Segmentation Based on CustomerValue Components (Case Study: A Private Bank)(Technical note)1Mahboubeh Khajvand *1 and Mohammad Jafar Tarokh 1IT Group, Industrial Engineering Department, K.N. Toosi University of Technology,Tehran, Iran(Received 6 December 2010, Accepted 12 June 2011)AbstractStudying about the customer segmentation and begetting customer ranking plan divertsmore attention in recent years. In this regard, this study tries on providing a methodology forsegmenting customers based on their value driver parameters which extracted from transactiondata and then ranks customers with regard to their customer lifetime value (CLV) score.Discovering hidden pattern between customers ranking result the other data such as customerproduct ownership data and socio-demographic information is the other work which addressedin this paper. Achieving this, we used data mining techniques such as different classificationand clustering approaches, and implemented them on real data from an Iranian private bank.Current study can provide good insights for marketing and CRM department of theorganization in identifying different segments of customer for designing future strategicprogram.Keywords: Customer lifetime value, Customer segmentation, Data mining, RFM analysis,Decision ruleIntroductionNowadays, with increase in marketcompetition, more and more companies dorealize that their most priceless asset is theexisting customers [1], so they give moreattentiontocustomerrelationshipmanagement (CRM) than past. The maingoal of a CRM system is to understandprofitable customers, to create and sustainrelations with them. Thus it is so importantto segment customers based on their valueand dedicate rank to them and establishdifferent relation with different segments ofcustomer and different ranks. Customerlifetime value (CLV) as a paradigm ofanalytical CRM is considered by researchersand companies in different industries. CLVis the present value of all future profits forfirms generated from a customer [2].Calculating CLV has had lots of applicationsand several authors have developed modelsfordifferentapplicationssuchasperformance measurement [3], targetingcustomers[4],marketingresourcesallocation [5,6], product offering [7, 8, 9],* Corresponding author:Tel: 98-21-84063362pricing [10], and customer segmentation [11,12, 13].This study prepared to segment customersof an Iranian bank and based on it, the bankcan focus on niche segment to propose newproduct and services to them which is one ofthe determined decisions in marketingstrategy.We considered three factors: Recency(R), Frequency (F), and Monetary (M) tocluster customers, analyzing clusters in RFMaspect, calculating CLV value of differentclusters. Then clusters with homogeneousCLV value incorporate and construct asegment and based on the CLV value of thesegments, we dedicate rank to them. Afterthat decision tree and decision rulesclassifiers are used to estimating theaccuracy rate of the customer segmentationand present rules for different segments toprovide a clear and perspicuous knowledgeexplanation about different segments. Thensocio-demographic predictors (e.g. age, sex)and product ownership predictors (e.g. typesof customer accounts) are employed as inputTel: 98-21-88674858Email: m.khajvand1984@gmail.com
80Journal of Industrial Engineering, University of Tehran, Special Issue, 2011variables to extract rule set for segments.These rules explain which customer withwhich characteristics lead to which segmentwith which value. Then evaluate which ofthe predictors have positive, negative, orneutral effect on customer CLV rank. Basedon these extracted knowledge the bank coulddevelop branch strategies like creditendowment or facility grant, marketingstrategies, CRM strategies or evenorganization strategies for different segmentof customer with different CLV rank.The rest of this study is organized asfollows. Section 2 outlines the backgroundand reviews related work on customerlifetime value, CLV divisions andclassifications, RFM analysis, and datamining definitions and techniques incustomer segmentation application. Section3 describes the research methodology andcase study. Finally, section 4 drawsconclusionsandsummarizingthecontributions of this work.1. Theoretical background1.1. Customer lifetime valueCustomer lifetime value (CLV) concept isgoingfromcustomerrelationshipmanagement (CRM) issue. Peppers believesthat “the goal of CRM is to forge closer anddeeper relationships with customers and tomaximize the lifetime value of a customer toan organization” [14]. There has been anexplosion of interest in the discipline andpractice of CRM in the worlds of businessand academic over the last decade especiallyin identifying and ranking of customersbased on customer value drivers.Based on the approach of estimatingCLV, there are different definitions for thisterm. One of the earliest definition said,CLV is expected profits from customersexcept cost of customer management [15].Pfeifer et al. defined CLV as the presentvalue of the future cash flows attributed tothe customer relationship [16] and finallySublaban and Aranha [6] described CLV asestimated monetary value that the client willbring to the firm during the entire lifespan ofhis/her commercial relationship with thecompany, discounted to today value. Inliteraturereview,therearesomeclassifications for CLV models. One of thesedivisions was proposed by Jain and Singh in[17] and the other by Gupta et al. in [18].Jain and Singh determined that many modelshave been proposed in CLV literaturedealing with all kinds of issues related toCLV. The following selection of modelsprovides summaries of some key modelsaddressingsomemajorresearchopportunities in CLV research andapplications. Based on the threefold streamof research related to CLV, they dividedthem into three corresponding categories[17]:I. Models for calculation of CLV: Thiscategory includes models that arespecifically formulated to calculate theCLV and/or extend this calculation toobtain optimal methods of resourceallocation to optimize CLV.II. Models of customer base analysis: Suchmodels take into account the pastpurchase behavior of the entire customerbase in order to come up withprobabilities of purchase in the next timeperiod.III. Normative models of CLV: Thesemodels have been proposed and usedmainly to understand the issuesconcerning CLV. Managers depend onmany commonly held beliefs in makingdecisions regarding CLV.Proposed paper works on normative modelof Jain and Singh categories. The result ofthis research could be used by differentdepartment of the bank to make decision orplan strategy.Gupta et al. described six modelingapproaches in CLV issue [18]: RFM Models: Based on Recency,Frequency, and Monetary. Probability Models: Based onPareto/NBD model and Markov chains. EconometricModels:Likeprobability model based on Pareto/NBDmodel and customer acquisition,
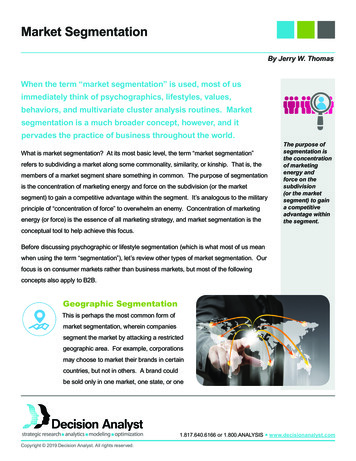
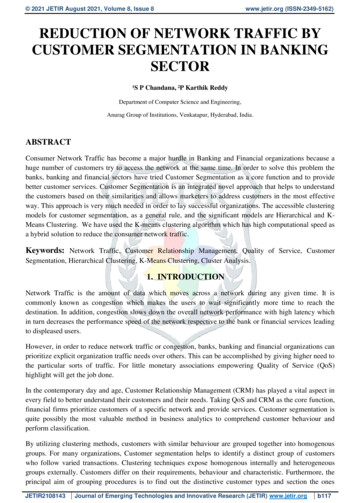
Analyzing Customer Segmentation .customer retention, and customer marginand expansion. Persistence Models: Based onmodeling the behavior of its components,that is, acquisition, retention, and crossselling. Computer Science Models: Based ontheory (e.g., utility theory) and are easyto interpret. In contrast, the vastcomputer science literature in datamining,machinelearning,andnonparametric statistics has generated. Diffusion/Growth Models: Based oncustomer equity (CE).This study works on RFM model and usescomputer science models’ technique ofGupta’s categories.1.1.1. RFM analysisOne of the most powerful and simplestmodels to implement CRM may be the RFMmodel – Recency, Frequency, and Monetaryvalue [19]. Bult and Wansbeek defined RFMas [20]: (1) R (Recency): the period since thelast purchase; a lower value corresponds to ahigher probability of the customer s makinga repeat purchase; (2) F (Frequency): numberof purchases made within a certain period;higher frequency indicates greater loyalty;(3) M (Monetary): the money spent during acertain period; a higher value indicates thatthe company should focus more on thatcustomer.In recent researches, some authorsproposed WRFM - Weighted RFM - insteadof RFM. Depend on the importance of theseparameters in their case they dedicatedweights to R, F, and M. For example, Stonein [21] suggested placing the highestweighting on the Frequency, followed by theRecency, with the lowest weighting on theMonetary measure, in Liu and Shih [7]study, Recency is the most importantparameter and Monetary is the less importantparameter, but in Chuang and Shen study,Monetary has the most value and Recencyhad the least value [22].To determine importance (weight) ofRFM parameters, AHP method is exploited.81The three main steps of this method are asfollows ([]:1. Perform pairwise comparisons withasking evaluators (decision makers orexperts)2. Assessing the consistency of pairwisejudgments;3. Employing eigen value computation toderive the weights of RFM variables.Some researches try to develop RFMmodel and add some parameters to thesethree parameters. For example, Cheng Yehet al. derived an augmented RFM model,called RFMTC model (Recency, Frequency,Monetary value, Time since first purchase,and Churn probability), using Bernoullisequence in probability theory [19]. In thisstudy, RFM parameters are employed forcustomer segmentation.1.2. Data mining concept and methodsSimply stated, data mining is the processofautomaticallydiscoveringusefulinformation in large data repositories.Imielinski and Virmani described datamining as a pattern query in large data bases[23]. Data mining should have been moreappropriately named knowledge mining fromdata. Han and Kumber believe that it is astep in the knowledge discovery process[24]. Knowledge discovery as a process isdepicted in an iterative sequence of thefollowing steps: Data cleaning; Dataintegration;Dataselection;Datatransformation; Data mining; Patternevaluation; Knowledge presentation. Therelation between the steps is shown in tionDataMiningFigure 1: knowledge discovery and data miningprocess
82Journal of Industrial Engineering, University of Tehran, Special Issue, 2011Phase 1: Business and data understandingBusiness statusBusiness problemData mining goalsData collectionand selectionPhase 3: ModelingFind optimum Kwith Dunn indexEstimating CLVscore of clustersClustering customerbased on RFM parameterSegmenting customers to 4groups based on similarity inCLV score and dedicatingrank to themPhase 2: Data preparing and preprocessingExtracting data: Transaction Data(Recency (R),Frequency(F), andMonetary (M) parameters Demographic Data(Age, Sex, and BranchZone) Behavioral Data(account type, cardownership status)ScalingR, F, MparametersMergingTransaction,Demographicand ProductownershipdataPhase 4: EvaluationEvaluating the results with metricsBalancing imbalancedsegmentsExtract rules basedon demographic andbehavioralpredictors fordifferent segmentsExtract rules based ontransaction predictors fordifferent segment with AccuracyPrecisionRecallF-measureclassification methodEvaluating that which business objectives aremet by the proposed work (in marketingstrategy scope)Figure 2: Structure of Research methodologyData mining methods are two categories:descriptive and predictive. Descriptivemethod such as classification and predictivemethod such as clustering are used in currentissue. Ngai et al. compare classification andclustering models as follow [25]:Classification aims at building a model topredict future customer behaviors throughclassifying database records into a number ofpredefined classes based on certain criteria,whereas clustering is the task of segmentinga heterogeneous population into a number ofmore homogenous clusters. It is different toclassification in that clusters are unknown atthe time the algorithm starts. In other words,there are no predefined clusters. Commontools used for classification are neuralnetworks, decision trees and if then-elserules [12] and common tools for clusteringinclude neural networks and discriminationanalysis [26].In CLV context, both of these modelsused in academic research, Baesens et al.used classification Bayesian networkclassifier in [27] and Drew et al. employedclustering neural network [28]. In this study,K-means algorithm as a clustering methodand several decision tree algorithms asclassification methods are used.
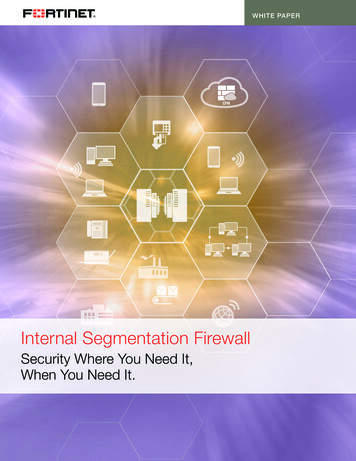
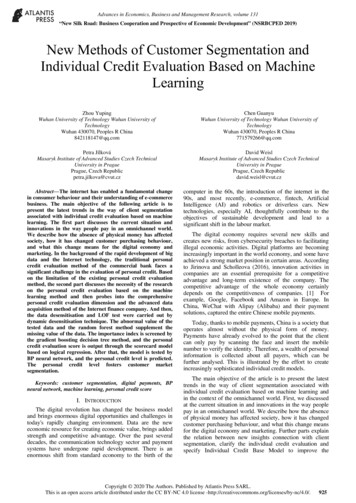
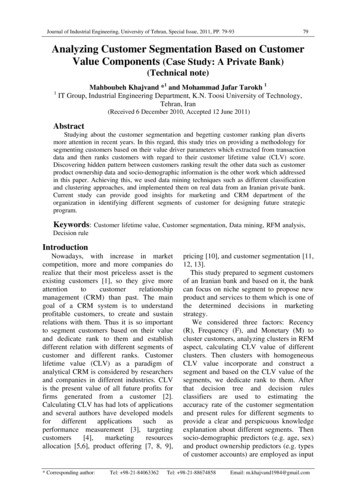
Analyzing Customer Segmentation .2. Methodology2.1. Crisp methodologyThere are different methodologies forimplementing data mining projects but oneof the powerful methods is CRISP (CRossIndustry Standard Process for Data Mining)methodology [29]. As a process model,CRISP provides an overview of the datamining life cycle. CRISP uses six phases todescribe the process from gathering businessrequirements to deploying the results [29]: Business Understanding: This phasetypically involves gathering requirementsand meeting with expert personnel todetermine goals rather than working withdata. Dataunderstanding:Thedataunderstanding phase of CRISP involvestaking a closer look at the data availablefor mining. This phase includescollecting initial data, describing data,exploring data, and verifying dataquality. Data preparation: Data preparation is oneof the most important and often timeconsuming aspects of data miningprojects and includes selecting data,cleaning data, constructing new data, andintegrating data. Modeling: The data which was spenttime preparing are ready to bring intodata mining algorithms, and the resultsbegin to shed some light on the businessproblem posed. Selecting modelingtechniques, generating a test design,building the models, and assessing themodel construct this phase. Evaluation: In this phase, evaluating theresults, review process, and determiningthe next steps are done. Deployment: Deployment is the processof using the new insights to makeimprovements within the organization.2.2. Research methodologyThe CRISP methodology is flexible andcan be customized easily. With regards tothis methodology, a research methodologywas proposed to ranking customers based onsegmenting customer with customer value83driver parameters. Figure 2 illustrateresearch methodology of this study.Phase 1: Business and data understanding.The case study concerns a private bank inIran. It was established by a consortium ofindustrial, construction and investmentcompanies, with the aim of providingflexible financial services to the burgeoningIranian private sector. It has since grown tooffer a full range of retail and commercialbanking solutions, serving individualcustomers, small to medium sized businessesand large corporations and publicinstitutions, both online and through ourextensive national network of branches. Datamining department is a new department inthis financial institute. This department triesto construct data warehouse from its hugedata bases to replace analyzing on data basedon OLTP (OnLine Transaction Process)system with OLAP (OnLine AnalyticalProcess).The most important goal of thisorganization is presentation of best servicesto customers. But the problem is that there isno taxonomy of customers based on theirvalue in the bank. The main objective ofcurrent study is analysis on the customers’data to discover similar pattern betweendifferent segments of customer based ontheir equity and then assigning each segmentof customer a rank based on their value, thenextracting rule set for different segment leadto identifying high-value customers. Theresults of the study can then be used by thebusiness to establish marketing and CRMstrategy for different group of customers.For this purpose, two years data oftransactions, approximately five millionsrecords for 50,000 customers, have beencollected with simple stochastic samplingmethod. The data can be categorized , transaction information, andproduct ownership information. Table 1explains some information about data.Phase 2: Data preparing and preprocessing.
84Journal of Industrial Engineering, University of Tehran, Special Issue, 2011Extracting data, scaling R, F, M parameters,merging transaction, demographic, andproduct ownership data are sub phase of datapreparing and preprocessing phase.There are transaction data in detail whichinclude type of transaction, date oftransaction, monetary value of transaction(positive or negative), and type of deposit.For extracting R, F, and M parameters ofeach customer we aggregate records basedon customer ID. In each aggregated record,there is a unique customer with her/hisnumber of monetary transaction as Fparameter, latest transaction date as Rparameter and total amount of money in allof her/his deposit account at the end of thecertain period (2 years) as M parameter.Then we scale each of these three parametersin five scales, very low, low, medium, high,and very high scale. For the scaling Rparameter, first sort the data based on Rattribute by ascendant order then partitionthe customers transaction dataset into 5partitions. Customers in the first partitionhave lowest value of Recency and theirRecency value named very low, secondpartition named low, third partition hasmedium scale, fourth is high scale andfinally fifth partition named very high. Forthe scaling F and M parameters the sameprocedure must be done.In the socio-demographic data, there is afield that called Branch zone, this attribute isderived from branch code. Tehran is dividedinto 22 zones (1 to 22) and has 95 branches,in the other hand, 111 branches aredistributed to the other cities. These cities aredivided into 6 zones (23 to 28) based ondefined supervision zone in the bank.In last step of this phase, we integrate datawith merging socio-demographic, productownership data and the result table of RFMaggregation. At the earliest, we have 50000customers’ data, but in the end of this phasewe have a new aggregated data that includeinformation (socio-demographic, productownership, and aggregated transactioninformation) about 34000 customers.Table 1: Data category and descriptionData demographicinformationBranch vingaccountShort termtimedepositaccountsLong termtimedepositaccountsDebit cardownershipIs a range of 2 to 880 for men and 1 forwomenThere are 28 zonesthat 22 of them are inTehran. It is derivedfrom Branch code ofeach customer.Latesttransactiondate during 2 yearsNumber of monetarytransactionmadewithin 2 yearsTotal amount ofmoney in all of thecustomer’s depositsin the end of theperiodTotal numbers ofproduct1 for ownership 0for non ownership1 for ownership 0for non ownership1 for ownership 0for non ownership1 for ownership 0for non ownership1forcardownership 0 fornon card ownership.Scaling5 scoreScaling nameVery high (VH)Table 2: Scaling RFM parametersRecencyFrequency2010/1/6- 2010/1/10[126,16968)4 score3 score2 score1 scoreHigh (H)Medium (M)Low (L)Very low (VL)2009/12/23- 2010/1/62009/11/24- 2009/12/232009/4/1- 2009/11/242008/1/9- 79 35,424,208,1462,027,705 - 26,913,379253,333- 2,027,70518.213 - 253,3330 - 18,213
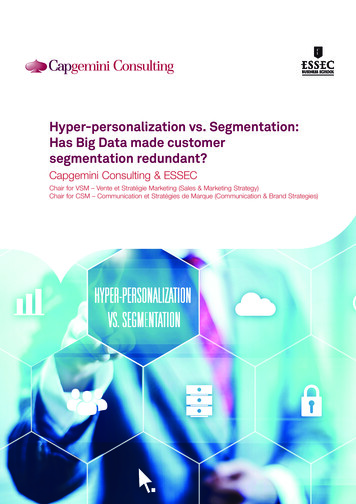
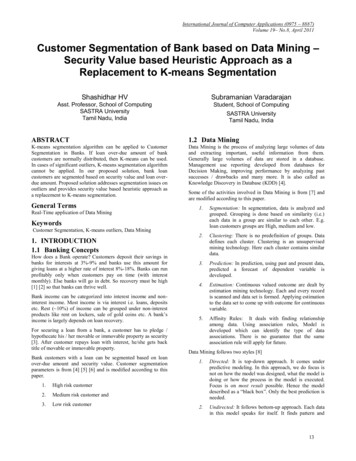
Analyzing Customer Segmentation .Phase 3 and 4: Modeling and evaluationAs it is mentioned in first phase, the goalof using data mining tools in this study isranking customers based on ion is done in two ways: customerneed-based and customer value-basedsegmentation [7, 8, 12, and 30]. Inparticular,customerneeds-basedsegmentation must ultimately drive CRMprograms even though a customerprofitability segmentation analysis can serveas a good starting point for efficient programdevelopment [31].For clustering customers, there aredifferent algorithms which can be used. Avariety of factors need to be consideredwhen deciding which type of clusteringtechnique to use [32]. One of the mostcommon iterative algorithms is the K-meansalgorithm [33] which can be used for a widevariety of data types. It is also quiteefficient, even though multiple runs areoften performed. K-means has troubleclustering data that contains outliers. Outlierdetection and removal can help significantlyin such situations. Finally, K-means isrestricted to data for which there is a notionof a center (centroid) [32]. At first step ofmodeling phase, we cluster customers basedon customer value drivers (recency,frequency and monetary), with K-meansalgorithm. There are some indices forfinding the optimum K (the number ofclusters) that reviewed in [34]. We usedDunn index in this study [35]. The maingoal of this measure is to maximizeintercluster distances (distance betweendifferent clusters), whilst minimizingintracluster distances (distance betweenmembers of a cluster) [34]. For any,wherepartitionthrepresents the i cluster of such partition,the Dunn indices, D, is defined as inequation (1):85(1)Where σ(ci, cj) defines the distancebetween clusters ci , cj(intercluster (ci) represents thedistance), andintracluster distance of cluster ci or the sizeof the cluster cj , and k is the total number ofclusters. In this study:(2)(3)where and are the centroid of clusterand. Thus large Value of Dcorresponds to good clusters. Therefore, thenumber of cluster that maximizes D is takenas the optimal number of clusters, c. In thisstudy optimum number of clusters (K) is 9which calculated by Dunn index (Figure 3).Figure 3: Optimum K with Dunn Second, based on centroid point of eachcluster and information of table 2, R, F, andM score are dedicated to each cluster, as it isshown in table 3.
86Journal of Industrial Engineering, University of Tehran, Special Issue, 2011Table 3: Clustering customers with RFM parametersc1c2c3No. H - VH - 4641,384VH - VH - VHVL - L - Mc7209242009/12/2912098,573,791H - VH - VHc826632009/10/10576,525,315L - H - Hc925312009/03/06231,887,606VL - L - MclusterRFMRFM 0,457934,639,633649,263L - M - MH - VH - VHVL - VL - MTable 4: RFM Score of clusterscluster% of customerR ScoreF scoreM ScoreRFM 6ParameterTable 5: Weights of RFM parametersRFMWeight0.0870.3450.653Table 6: Calculating CLV with approach 2ClusterNormal RNormal FNormal 340.0900.0770.0514114234
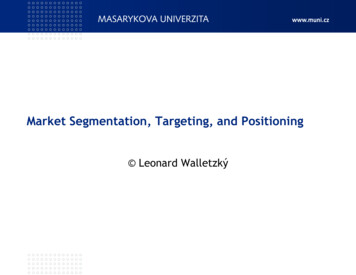
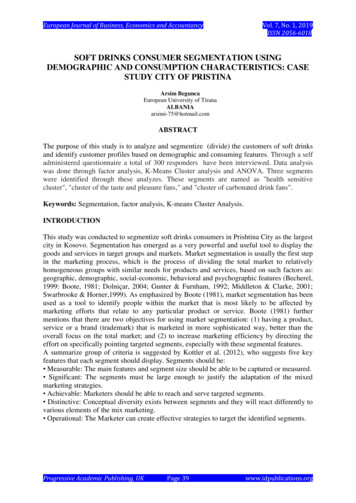
Analyzing Customer Segmentation .87RFM score of each cluster can becalculated with equation (4), as follow:Whererefers to recency score ofis frequency score ofcluster ci,cluster ci, andi is monetary scoreof cluster ci (table 4).Cluster 2 and 7 with 20929 memberswhich include 60 percents of all customershave 14 RFM score, other hand, C4 and C5altogether have 395 members which includejust one percent of all customers have 15RFM score, as it is shown in figure 4.original data [32]. Suppose that minA andmaxA are the minimum and maximumvalues of an attribute, A. Then min-maxnormalization maps a value, v, of A to in] bythe range of [computing:(6)In current study the new range is [0, 1].According to the assessments obtained bythe AHP method with regard to expert’sinsight of the bank, the relative weights ofthe RFM variables are mentioned in table 5.In table 6 the normal R, F and M valuesfor each cluster's centroid and CLV of themis shown.Figure 4: Diagram of customers' RFM scoreAfter that, we calculate CLV score of eachcluster based on weighted RFM analysis asfollow in equation (5):(5)whererefers to normal recency ofcluster ,is the weight of recency,is normalized frequency,is theweight of frequency,is normalizedmonetary, andis the weight ofmonetary. In this study, min-maxnormalization method is used fornormalizing data. Min-max normalizationperforms a linear transformation on theFigure5: Distribution of customers in segmentsIn general we have four segments ofcustomers (as it is shown in last column oftable 6). For analyzing customers’transaction behavior based on their valuedriver parameters, classifier algorithm canbe used to extract rules. In fact, we extractrules for explanation of clear knowledgeabout different segments of customers withdifferent ranks. In current study, severalclassifiers are used and PART (ProjectiveAdaptive Resonance Theory) algorithm ischosen for extracting rules [36] because ofits best metrics results (see table 8). PARTuses separate-and-conquer and builds apartial C4.5 decision tree in each iteration
88Journal of Industrial Engineering, University of Tehran, Special Issue, 2011and makes the best leaf into a rule. Thecomparison among decision tree classifiersand rule set classifiers is shown in table 8and the rule set of PART decision ruletechnique is presented in list 1.Metrics are used to guide the data miningalgorithms and to evaluate the results of datamining. Recall and precision are two widelyused metrics employed in applicationswhere successful detection of one of theclasses is considered more significant thandetection of the other classes [32]. Precisionand recall can be summarized into anothermetric known as the F-measure:Where is: TP corresponds to the number ofpositive examples correctly predicted bythe classification model FN corresponds to the number ofpositive examples wrongly predicted asnegative by the classification model FP corresponds to the number ofnegative examples wrongly predicted aspositive number of negative exampleswrongly predicted as positive by theclassification model TN corresponds to the number ofnegative examples correctly predicted bythe classification modelTable 8: Comparison among 9.9498.8210.9990.97710.9990.98810.9990.983To discover the pattern betweencustomers’ value base segmentation (the lastcolumn of table 6) as target field and theirsocio-demographic and product ownershipattributes as predictors, rule set algorithmcan be used to extract rules. The algorithmwhich is exploited in current study is PARTdecision rule. Because of unbalancingproblem among the four segments, all of therules terminate in segment 2 with 60percents of all customers. In a conceptlearning problem, the data set is said topresent a class imbalance if it contains manymore examples of one class than the other.Such a situation poses challenges for typicalclassifiers such as decision tree inductionsystems or multi-layer perceptrons that aredesigned to optimize overall accuracywithout taking in to account the relativedistribution of each class. As a result, theseclassifiers tend to ignore small classes whileconcentrating on classifying the large onesaccurately. There are some of the methodsdeveloped for handling the class imbalanceproblem [37]. Sampling-based methods andalternative metrics besides accuracy (i.e.recall and precision) introduced in this side.Data-based techniques for sampling includeundersampling, oversampling, and a hybridof both approaches. In the current study, weused hybrid one to reduce overfittingproblem which is the result of oversamplingmethod and omitting certain importantrecords that is the result of undersamplingmethod.
Analyzing Customer Segmentation .As it is mentioned prior, predictors fieldsinclude socio-demographic and productownership attributes and the target field isthe segment number. So, we run PARTdecision rule two times, first with productownership data as predictors and secondwith socio-demographic data. Survey onresults shows that socio-demographic dataof customers are not good predictors of thesegment of customers, because the accuracyof the rules is about 37 percents, that is verylow. But product ownership data could beproper predictors for customer basesegmentation. Before sampling, all of therules terminated in segment 2 with 60percents of all customers but after balancingdata, we could extract a rule set for productownership variables and the segmentation ofthe customers, which cover all segments(see list 2). The discovered knowledge issummarized in table 9. The content of table9 show that Current account, the totalnumber of product ownership and long termtime deposit accounts have a positiverelation with CLV score of customers. Alsosocio-demographic data such as age, sex andbranch zone have no relation with customervalue score.2.2.1. Segmentations ranking analysis andproposed strategySegment 1: First segment includes themost valuable customers of the financialinstitute. This group is constructed from C2,C4, and C5 which have high CLV value.These customers are labeled “goldcustomers” and just one percent ofcustomers belong to this segment. The bankmust have special program and strategy forthem. Private banking that is one of the threescopes of banking marketing strategies, mustbe consider for this segment. The bankshould give consultant services to this groupfor managing their property.89Segment 2: Cluster 7 with 60 percents ofcustomers’ contribution constructs thissegment. This group contains customerswho averagely refer to the bank one time ina week and the last transaction date of themis about ten days ago and average totalmonetary value of them is very high score ofmonetary scoring in retail banking scope. Sothis segment includes valuable customers ofthe bank and the insti
of customer with different CLV rank. The rest of this study is organized as follows. Section 2 outlines the background and reviews related work on customer lifetime value, CLV divisions and classifications, RFM analysis, and data mining definitions and techniques in customer segmentation application. Section 3 describes the research methodology and