Transcription
Integrating SQuaRE data quality model with ISO31000 risk management to measure and mitigatesoftware biasAlessandro SimonettaDepartment of Enterprise EngineeringUniversity of Rome Tor VergataRome, Italyalessandro.simonetta@gmail.comORCID: 0000-0003-2002-9815Antonio VetròDept. of Control and Computer Eng.Politecnico di TorinoTurin, Italyantonio.vetro@polito.itORCID: 0000-0003-2027-3308Maria Cristina PaolettiRome, Italymariacristina.paoletti@gmail.comORCID: 0000-0001-6850-1184Marco TorchianoDept. of Control and Computer Eng.Politecnico di TorinoTurin, Italymarco.torchiano@polito.itORCID: 0000-0001-5328-368XAbstract — In the last decades the exponential growth ofavailable information, together with the availability of systemsable to learn the knowledge that is present in the data, haspushed towards the complete automation of many decisionmaking processes in public and private organizations. Thiscircumstance is posing impelling ethical and legal issues since alarge number of studies and journalistic investigations showedthat software-based decisions, when based on historical data,perpetuate the same prejudices and bias existing in society,resulting in a systematic and inescapable negative impact forindividuals from minorities and disadvantaged groups. Theproblem is so relevant that the terms data bias and algorithmethics have become familiar not only to researchers, but also toindustry leaders and policy makers. In this context, we believethat the ISO SQuaRE standard, if appropriately integrated withrisk management concepts and procedures from ISO 31000, canplay an important role in democratizing the innovation ofsoftware-generated decisions, by making the development ofthis type of software systems more socially sustainable and inline with the shared values of our societies. More in details, weidentified two additional measure for a quality characteristicalready present in the standard (completeness) and another thatextends it (balance) with the aim of highlighting informationgaps or presence of bias in the training data. Those measuresserve as risk level indicators to be checked with commonfairness measures that indicate the level of polarization of thesoftware classifications/predictions. The adoption of additionalfeatures with respect to the standard broadens its scope ofapplication, while maintaining consistency and conformity. Theproposed methodology aims to find correlations between qualitydeficiencies and algorithm decisions, thus allowing to verify andmitigate their impact.Keywords— ISO Square, ISO31000, data ethics, data quality,data bias, algorithm fairness, discrimination riskI.INTRODUCTIONSoftware nowadays replace most human decisions inmany contexts [1] ; the rapid pace of innovation suggests thatthis phenomenon will further increase in the future [2]. Thistrend has been enabled by the large availability of data and ofthe technical means to analyze them for building thepredictive, classification, and ranking models that are at thecore of automated decision making (ADM) systems.Advantages for using ADM systems are evident and theyconcern mainly scalability, efficiency, and removal ofdecision makers’ subjectivity. However, several criticalaspects have emerged: lack of accountability and transparency[3], massive use of natural resources and low-unpaid labor tobuilding extensive training sets [4] , the distortion of the publicsphere of political discussion [5], and the amplification ofexisting inequalities in society [6]. This paper focuses on thelatter problem, which occurs when automated softwaredecisions “systematically and unfairly discriminate againstcertain individuals or groups of individuals in favor of others[by denying] an opportunity for a good or [assigning] anundesirable outcome to an individual or groups of individualson grounds that are unreasonable or inappropriate” [7] . Inpractice, software systems may perpetuate the same bias ofour societies, systematically discriminating the weakestpeople and exacerbating existing inequalities [8]. A recurringcause for this phenomenon is the use of incomplete and biaseddata, because of errors or limitations in the data collection(e.g., under-sampling of a specific population group) orsimply because the distributions of the original population areskewed. From a data engineering perspective, this translatesinto imbalanced data, i.e. a condition with an unequaldistribution of data between the classes of a given attribute,which causes highly heterogeneous accuracy across theclassifications [9] [10]. Imbalanced data is known to beproblematic in the machine learning domain since long time[11]. In fact, imbalanced datasets may lead to imbalancedresults, which in the context of ADM systems meansdifferentiation of products, information and services based onpersonal characteristics. In applications such as allocation ofsocial benefits, insurance tariffs, job profiles matching, etc.,such differentiations can lead to unjustified unequal treatmentor discrimination.For this reason, we maintain that imbalanced andincomplete data shall be considered as a risk factor in all theADM systems that rely on historical data and operate inrelevant aspects of the lives of individuals. Our proposal relieson the integration of the measurement principles of the ISOSQuaRE [12] with the risk management process defined inISO 31000 [13] to assess the potential risk of discriminatingsoftware output and take action for remediations. In the paper,we describe the theoretical foundations, and we provide aworkflow of activities. We believe that the approach can beCopyright 2021 for this paper by its authors. Use permitted under Creative Commons License Attribution 4.0 International (CC BY 4.0).
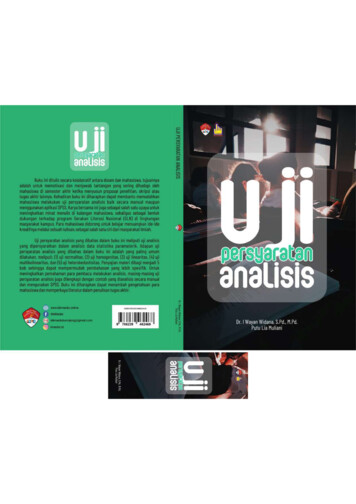
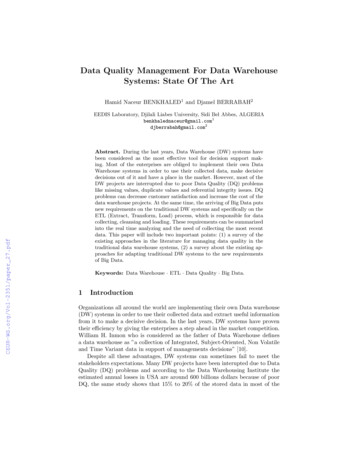
useful to a variety of stakeholders for assessing the risk ofdiscriminations, including the creators or commissioners ofsoftware systems, researchers, policymakers, regulators,certification or audit authorities. Assessments should prompttaking appropriate action to prevent adverse effects.II.METHODOLOGYFigure 1 gives an overview of the proposed methodology.The process begins with the common subdivision of theoriginal data into training and test data. At this point, it ispossible to measure the quality in the training data (balanceand completeness) and the fairness in the results obtained onthe test data. Data balance measures extend the characteristicsof the data quality model (ISO/IEC 25012), whilecompleteness measures complement it. Data quality measuresgive rise to an indicator for unbalanced or incomplete data forthe sensitive characteristics, which implicates a risk of biasedclassifications by the algorithm. In this circumstance, it isnecessary to also assess the fairness of the algorithms usedthrough the measures outlined in this paper. The presence ofunfair results from the point of view of sensitive features incorrespondence with poor quality data leads to the necessarydata enrichment step to try to mitigate the problem. Thus, ourproposed methodology is composed by two main blocks:A. Risk analysis: measuring the risk that a trainingset could contain unbalanced data, integrating theSQuaRE approach with ISO 31000 riskmanagement principles;B. Risk evaluation: verify that a high level of riskcorresponds to unfairness, and in positive caseenrich original data with synthetic data tomitigate the problem.A. Risk analysis: where SQuaRE and ISO3100 meetWe integrate the SQuaRE theoretical framework with theISO 31000 risk management principles to measure the riskthat an unbalanced or incomplete training set might causediscriminating software output. Since the primary recipientsof this document are the participants of the “3rd InternationalWorkshop on Experience with SQuaRE series and its FutureDirection”1, we do not describe here the standard, however wesummarize the most important aspects for the scope of thepaper. Firstly, we remind that SQuaRE includes qualitymodeling and measurements of software products2, data andsoftware services. According to the philosophy andorganization of this family of standards, quality is categorizedinto one or more quantifiable characteristics and subcharacteristics. For example, the standard ISO/IEC25012:2011 formalizes the product quality model ascomposed of eight characteristics, which are furthersubdivided into sub-characteristics. Each (sub) characteristicrelates to static properties of software and dynamic propertiesof the computer system3. The ISO/IEC 25012:2008 on dataquality has 15 characteristics: 5 of them belongs to the“inherent” point of view (i.e., the quality relies only on thecharacteristics of the data per se), 3 of them are systemdependent (i.e., the quality depends on the characteristics ofthe system hosting the data and making it available), theremaining 7 belonging to both points of view. Data balance isnot recognized as a characteristic of data quality in ISO/IEC25012:2008: it is proposed here as an additional inherentcharacteristic. Because of its role in the generation of biasedFigure 1. The proposed methodology1See http://www.sic.shibaura-it.ac.jp/ tsnaka/iwesq.htmlA software product is a “set of computer programs, procedures,and possibly associated documentation and data” as defined inISO/IEC 12207:1998. In SQuaRE standards, software qualitystands for software product quality.3A system is the “combination of interacting elements organizedto achieve one or more stated purposes” (ISO/IEC 15288:2008),2for example the aircraft system. It follows that a computer systemis “a system containing one or more components and elementssuch as computers (hardware), associated software, and data”, forexample a conference registration system. An ADM system thatdetermines eligibility for aid for drinking water is a softwaresystem.
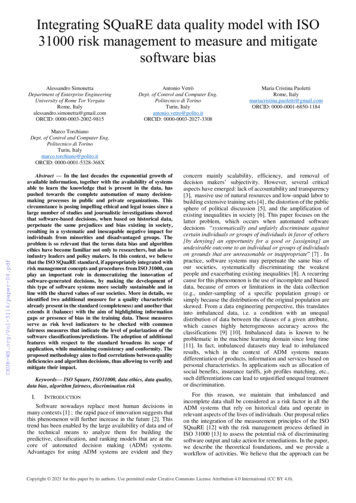
software output, data balance reflects the propagationprinciple of SQuaRE: the quality of the software product,service and data affects the quality in use. Therefore,evaluating and improving product/service/data quality is onemean of improving the system quality in use. A simplificationof this concept is the GIGO principle (“garbage in, garbageout”): data that is outdated, inaccurate and incomplete makethe output of the software unreliable. Similarly, unbalanceddata will probably cause unbalanced software output,especially in the context of machine learning and AI systemstrained with that data. This principle applies also tocompleteness, which is already an inherent characteristic ofdata quality in SQuaRE: in this work we propose an additionalmetric to those proposed in ISO/IEC 25024:2015, that is moresuitable for the problem of biased software.To better address the problem of biased software output,we consider the measures of data balance and completenessnot only as extension of SQuaRE data quality modelling butalso as risk factors. Here comes the integration of SQuaREtheoretical and measurement framework with the ISO31000:2018 standard for risk management. The standarddefines guiding principles and a process of three phases: riskidentification, risk analysis and risk evaluation. Here, webriefly describe them and specify the relation with ourapproach.Risk identification refers to finding, recognizing anddescribing risks within a certain context and scope, and withrespect to specific criteria defined prior to risk assessment. Inthis paper, this is implicitly contained in the motivations andin the problem formulation: it is the risk of discriminatingindividuals or groups of individuals by operating softwaresystems that automate high-stake decisions for the lives ofpeople.Risk analysis is the understanding of the characteristics andlevels of the risk. This is the phase where measures of dataIndexGiniFormula𝑚𝒢 1 𝑓𝑖2𝑖 1balance and completeness are used as indicators, due to thepropagation effect previously described.Risk evaluation, as the last step, is the process in which theresults of the analysis are taken into consideration to decidewhether additional action is required. If affirmative, thisprocess would then outline available risk treatment optionsand the need for conducting additional analyses. In our case,specific thresholds for the measures should be decided for thespecific prediction/classification algorithms used, the socialcontext, the legal requirements of the domain, and otherrelevant factors for the case at hand. In addition to thetechnical actions, the process would define other types ofrequired actions (e.g., reorganization of decision processes,communication to the public, etc.) and the actors who mustundertake them.1) Completeness measureThe completeness measure proposed is agnostic with respectto classical ML data classification because for our purposeswe are interested in evaluating those columns that assumevalues in finite and discrete intervals, which we will callcategorical with respect to the row data. This characteristicwill allow us to consider the set of their values as the digitsconstituting a number in a variable base numbering system.The idea of the present study is based on the principle that alearning system provides predictions consistent with the datawith which it has been trained. Therefore, if it is fed with nonhomogeneous data it will provide unbalanced anddiscriminatory predictions with respect to reality. For thisreason, the methodology we propose starts with the analysisphase of the reality of interest and of the dataset, an activitythat must be carried out even before starting the pre-trainingphase in line with previous studies where some of the authorsproposed the use of balance measures in automated decisionNormalized formula𝑚𝑚𝒢𝑛 (1 𝑓𝑖2 )𝑚 1𝑖 1Notesm is the number of classesf is the relative frequency of each class𝑛𝑓𝑖 𝑚 𝑖 𝑛𝑖 1 𝑖ni absolute frequencyThe higher G and Gn, the higher is theheterogeneity: it means that categorieshave similar frequenciesThe lower the index, the lower is theheterogeneity: a few classes account formajority of instancesSimpson𝐷 12 𝑚𝑖 1 𝑓𝑖𝐷𝑛 11( 𝑚 2 1) 𝑚 1 𝑖 1 𝑓𝑖For m, f, fi and ni check GiniHigher values of D and Dn indicate higherdiversity in terms of probability ofbelonging to different classesThe lower the index, the lower is thediversity, because frequencies areconcentrated in a few classesTable 1. Example of measures of balance
making systems [14][15][16][17]. In particular, during thisphase, it is necessary to identify all the independent columnsthat define whether the instance belongs to a class or category.Suppose we have a structured dataset as follows:DS { C0, C1, . , Cn 1 }len(df)/(M k)(1)Indicating with the set S the positions of the columnscategorising the instances, functionally independent of theother columns in the dataset:S { 0, 1, . , n – 1 } , dim(S) m , m nM df.groupby(['CS0',.,'CSm-1']).size().reset index(name 'counts').counts.max()(2)we can analyze the new dataset consisting of the columnsCS(j) with j [0, m 1].Having said that, we can decide to use two different notionsof completeness: maximum or minimum. In the first case thepresence in the dataset of a greater number of distinctinstances that belong to the same categorising classesconstitutes a constraint for all the other instances of thedataset. That is, one must ensure that one has the same numberof replicas of distinct class combinations for distinct instances.Instead, in the second case it is sufficient to have at least onecombination of distinct classes among those possible for eachinstance. For simplicity, but without loss of generality of theprocedure, we will explore the minimum completeness of thedataset, then we will reduce the dataset to just the columns (𝑗)by removing duplicate rows. We will use the Python languageto explicate the calculation formulas and make themathematical logic implied less abstract. The Python languagehas the pandas library, which makes it possible to carry outanalysis and data manipulation in a fast, powerful, flexible andeasy-to-use manner. Through the DataFrame class it ispossible to load data frames from a simple csv file:import pandas as pddf pd.read csv( file name )The ideal value of minimum completeness for thecombinatorial metric is when in the dataset there is at least oneinstance that belongs to each distinct combination ofcategories. The absence of some combination could create thelack of information that we do not want to exist. To calculatethe total number of distinct combinations we need to calculatethe product of the distinct replicas per single category.k ( df['CS0'].unique().size *df['CS1'].unique().size *.*df['CSm-1'].unique().size )2) Balance measuresSince imbalance is defined as an unequal distributionbetween classes [9], we focus on categorical data. In fact,most of the sensitive attributes are considered categoricaldata, such as gender, hometown, marital status, and job.Alternatively, if they are numeric, they are either discrete andwithin a short range, such as family size, or they arecontinuous but often re-conducted to distinct categories, suchas information on “age” which is often discretized into rangessuch as “ 18”, “19-35”, “36-50”, “51-65”, etc. We show twoexamples of measures in Table 1, retrieved from the literatureof social and natural sciences, where imbalance is known interms of (lack of) heterogeneity and diversity. They arenormalized in the range 0-1, where 1 correspond to maximumbalance and 0 to minimum balance, i.e. imbalance. Hence,lower level of balance measures mean a higher risk of bias inthe software output.B. Risk evaluation with fairness measuresThe majority of fairness measures in machine learningliterature rely on the comparison of accuracy, computed foreach population group of interest [18]. For computing theaccuracy, two different approaches can be adopted: the firstattempts to measure the intensity of errors, i.e. the deviationbetween prediction and actual value (precision), while theother measures the general direction of the error. Indicatingwith ei the ith error, with fi and di respectively the ith forecastand demand, we have:𝑒𝑖 𝑓𝑖 𝑑𝑖(3)At this point we can add up all the errors with sign and findthe average error:1𝑎𝑣𝑒𝑟𝑎𝑔𝑒 𝑒𝑟𝑟𝑜𝑟 𝑛 𝑖 𝑒𝑖However, this measure is very crude because errorcompensation phenomena may be present so generically it ispreferred to use the mean of the absolute error or the squareroot of the mean square error:1On the other hand, in the dataset we only have thecharacterising columns so we can derive the true number ofdistinct instances in order to determine how far the datadeviates from the ideal case.len (df.drop duplicates())/ kThe value for maximum completeness is calculated fromthe maximum number of duplicates of the same combinationsof characterising columns. For this reason it is necessary tomaintain in the dataset in addition to the columns (𝑗) adiscriminating identification field of the rows with the samevalues in these columns. To determine the potential total, oncethe maximum number of duplications (M) has beendetermined, it is necessary to extend this multiplication factorto all other classes.(4)𝑀𝐴𝐸 𝑛 𝑖 𝑒𝑖 1𝑅𝑀𝑆𝐸 𝑛 𝑖 𝑒𝑖 2(5)(6)RMSE is sensitive to important errors, while from thispoint of view MAE is fairer because it considers all errors atthe same level. Moreover, if our prediction tends to themedian it will get a good value of MAE, vice versa if itapproaches the mean it will get a better result on RMSE.Under conditions where the median is lower than themean, for example in processes where there are peaks ofdemands compared to normal steady state operation, it willnot be convenient to use MAE which will introduce a biaswhile it will be more convenient to use RMSE. Things are
reversed if outliers are present in the distribution as MAE isless sensitive than RMSE.To measure model performance, you can choose tomeasure error with one or more KPI.In the case of classification algorithms instead you can usethe confusion matrix that allows you to compute the numberof true positives (TPs), true negatives (TNs), false positives(FPs) and false negatives (FNs):𝑝11 𝑝1𝑛(7)𝑃 [ . ]𝑝𝑛1 𝑝𝑛𝑛You can use the following equations to calculate thefollowing values:𝑇𝑃(𝑖) 𝑝𝑖𝑖(8)𝑛𝐹𝑃(𝑖) 𝑝𝑘𝑖(9)𝑘 1,𝑘 𝑖𝑛𝐹𝑁(𝑖) 𝑝𝑖𝑘IV.(10)𝑘 1,𝑘 𝑖𝑛𝑇𝑁(𝑖) 𝑝𝑘𝑘(11)𝑘 1,𝑘 𝑖At this point, the single values could be computed for eachpopulation subgroup (e.g., “Asian” vs “Caucasian” vs“African-American” etc. , or “Male” vs “Female”, etc.) andthe same applies to the concepts of precision, recall, andaccuracy, known from the literature and reported here:𝑃𝑟𝑒𝑐𝑖𝑠𝑖𝑜𝑛 𝑅𝑒𝑐𝑎𝑙𝑙 𝐴𝑐𝑐𝑢𝑟𝑎𝑐𝑦 𝑇𝑃𝑇𝑃 𝐹𝑃𝑇𝑃𝑇𝑃 𝐹𝑁𝑇𝑃 𝑇𝑁𝑇𝑃 𝑇𝑁 𝐹𝑃 𝐹𝑁(12)(13)(14)Fairness measures should be then compared withappropriate thresholds selected with respect to social contextin which the software application is used. If the unfairness ishigher than the maximum allowed thresholds, then theoriginal dataset should be integrated with synthetic data tomitigate the problem. One way to repopulate the datasetwithout causing distortion in the data is to add replicas of dataselected from the same set at random (known as bootstrapping[19]); other rebalancing techniques have been proposed in theliterature (e.g. SMOTE [20], ROSE [21]).III.It is a joint initiative of MIT Media Lab and Berkman KleinCenter at Harvard University: https://datanutrition.org/.CONCLUSION AND FUTURE WORKWe propose a methodology that integrates SQuaREmeasurement framework with the ISO 31000 process with thegoal of evaluating balance and completeness in a dataset asrisk factors of discriminatory outputs of software systems. Webelieve that the methodology can be a useful instrument for allthe actors involved in the development and regulation ofADM systems, and, from a more general perspective, it canplay an important role in the collective attempt of placingdemocratic control on the development of these systems, thatshould be more accountable and less harmful than how theyare now. In fact, the adverse effects of ADM systems areposing a significant danger for human rights and freedoms asour societies increasingly rely on automated decision making.It must be stressed that this is still at a prototypical stage andfurther studies are necessary to improve the methodology andto assess the reliability of the proposed measures, for exampleto find meaningful risk thresholds in relation to the context ofuse and the severity of the impact on individuals. The currentpaper is also way to seek engagement from other researchersin a community effort to test the workflow in real settings,improve it and build an open registry of additional measurescombined with evaluations benchmark. Finally, we areconscious that technical adjustments are not enough, and theyshould be integrated with other types of actions because of thesocio-technical nature of the problem.REFERENCES[1]RELATION WITH LITERATURE AND OUR PAST STUDIESAn approach similar to ours is the work of TakashiMatsumoto and Arisa Ema [22], who proposed a risk chainmodel (RCM) for risk reduction in Artificial Intelligenceservices: the authors consider both data quality and dataimbalance as risk factors. Our work can be easily integratedinto the RCM framework, because we offer a quantitativeway to measure balance and completeness, and because it isnatively related to the ISO/IEC standards on data qualityrequirements and risk management.4Other approaches which can be connected to ours are inthe direction of labeling datasets: for example “The DatasetNutrition Label Project” 4 aims to identify the “keyingredients” in a dataset such as provenance, populations, andmissing data. The label takes the form of an interactivevisualization that allows for exploring the previouslymentioned aspects and spot flawed, incomplete, orproblematic data. One of the author of this paper tookinspiration from this study in previous works for “Ethicallyand socially-aware labeling” [16] and for a data annotationand visualization schema based on Bayesian statisticalinference [17] always for the purpose of warning about therisk of discriminatory outcomes due to poor quality ofdatasets. We started from that experience to conductpreliminary case studies on the reliability of the balancemeasures [14] [15]: in this work we continue in that directionby adding a measure of completeness and proposing anexplicit workflow of activities for the combination of SQuaREwith ISO 31000.[2][3]F. Chiusi, S. Fischer, N. Kayser-Bril, and M.Spielkamp, “Automating Society Report 2020,”Berlin, Oct. 2020. Accessed: Nov. 10, 2020. ithmwatch.orgE. Brynjolfsson and A. McAfee, The Second MachineAge: Work, Progress, and Prosperity in a Time ofBrilliant Technologies, Reprint edition. New YorkLondon: W. W. Norton & Company, 2016.F. Pasquale, The Black Box Society: The SecretAlgorithms That Control Money and Information.Cambridge: Harvard Univ Pr, 2015.
[4][5][6][7][8][9][10][11][12][13]K. Crawford, Atlas of AI: Power, Politics, and thePlanetary Costs of Artificial Intelligence: The RealWorlds of Artificial Intelligence. New Haven: YaleUniv Pr, 2021.P. N. Howard, Lie Machines: How to Save Democracyfrom Troll Armies, Deceitful Robots, Junk NewsOperations, and Political Operatives. New Haven ;London: Yale Univ Pr, 2020.V. Eubanks, Automating Inequality: How High-TechTools Profile, Police, and Punish the Poor. New York,NY: St. Martin’s Press, 2018.B. Friedman and H. Nissenbaum, “Bias in ComputerSystems,” ACM Trans Inf Syst, vol. 14, no. 3, pp. 330–347, Jul. 1996, doi: 10.1145/230538.230561.C. O’Neil, Weapons of Math Destruction: How BigData Increases Inequality and Threatens Democracy,Reprint edition. New York: Broadway Books, 2017.H. He and E. A. Garcia, “Learning from ImbalancedData,” IEEE Trans. Knowl. Data Eng., vol. 21, no. 9,pp. 1263–1284, Sep. 2009, doi:10.1109/TKDE.2008.239.B. Krawczyk, “Learning from imbalanced data: openchallenges and future directions,” Prog. Artif. Intell.,vol. 5, no. 4, pp. 221–232, Nov. 2016, doi:10.1007/s13748-016-0094-0.N. Japkowicz and S. Stephen, “The class imbalanceproblem: A systematic study,” Intell. Data Anal., vol.6, no. 5, pp. 429–449, Oct. 2002.International Organization for Standardization,“ISO/IEC 25000:2014 Systems and softwareengineering — Systems and software QualityRequirements and Evaluation (SQuaRE) — Guide toSQuaRE,” ISO-International Organization forStandardization, 2014.https://www.iso.org/standard/64764.html (accessedNov. 10, 2020).International Organization for Standardization, “ISO31000:2018 Risk management — Guidelines,” ISO International Organization for Standardization, isoorg/contents/data/standard/06/56/65694.html (accessed Nov.10, 2020).[14] M. Mecati, F. E. Cannavò, A. Vetrò, and M.Torchiano, “Identifying Risks in Datasets forAutomated Decision–Making,” in ElectronicGovernment, Cham, 2020, pp. 332–344. doi:10.1007/978-3-030-57599-1 25.[15] A. Vetrò, M. Torchiano, and M. Mecati, “A dataquality approach to the identification of discriminationrisk in automated decision making systems,” Gov. Inf.Q., p. 101619, Sep. 2021, doi:10.1016/j.giq.2021.101619.[16] E. Beretta, A. Vetrò, B. Lepri, and J. C. De Martin,“Ethical and Socially-Aware Data Labels,” inInformation Management and Big Data, Cham, 2019,pp. 320–327.[17] E. Beretta, A. Vetrò, B. Lepri, and J. C. D. Martin,“Detecting discriminatory risk through data annotationbased on Bayesian inferences,” in Proceedings of the2021 ACM Conference on Fairness, Accountability,and Transparency, New York, NY, USA, Mar. 2021,pp. 794–804. doi: 10.1145/3442188.3445940.[18] S. Barocas, M. Hardt, and A. Narayanan, Fairness andMachine Learning. fairmlbook.org, 2019.[19] “Handling imbalanced data sets with syntheticboundary data generation using bootstrap re-samplingand AdaBoost techniques - 2013.04.019 (accessedSep. 18, 2021).[20] N. V. Chawla, K. W. Bowyer, L. O. Hall, and W. P.Kegelmeyer, “SMOTE: synthetic minority oversampling technique,” J. Artif. Intell. Res., vol. 16, no.1, pp. 321–357, Jun. 2002.[21] G. Menardi and N. Torelli, “Training and assessingclassification rules with imbalanced data,” Data Min.Knowl. Discov., vol. 28, no. 1, pp. 92–122, Jan. 2014,doi: 10.1007/s10618-012-0295-5.[22] T. Matsumoto and A. Ema, “RCModel, a Risk ChainModel for Risk Reduction in AI Services,”ArXiv200703215 Cs, Jul. 2020, [Online]. Available:http://arxiv.org/abs/2007.03215
Integrating SQuaRE data quality model with ISO 31000 risk management to measure and mitigate software bias Alessandro Simonetta Department of Enterprise Engineering University of Rome Tor Vergata Rome, Italy alessandro.simonetta@gmail.com ORCID: 0000-0003-2002-9815 Marco Torchiano Dept. of Control and Computer Eng. Politecnico di Torino